. 2017 May 22;27(10):1413-1424.e4.
doi: 10.1016/j.cub.2017.03.077. Epub 2017 May 4.

Theta Oscillations during Active Sleep Synchronize the Developing Rubro-Hippocampal Sensorimotor Network

Affiliations

Theta Oscillations during Active Sleep Synchronize the Developing Rubro-Hippocampal Sensorimotor Network

Carlos Del Rio-Bermudez et al. Curr Biol. .

Abstract

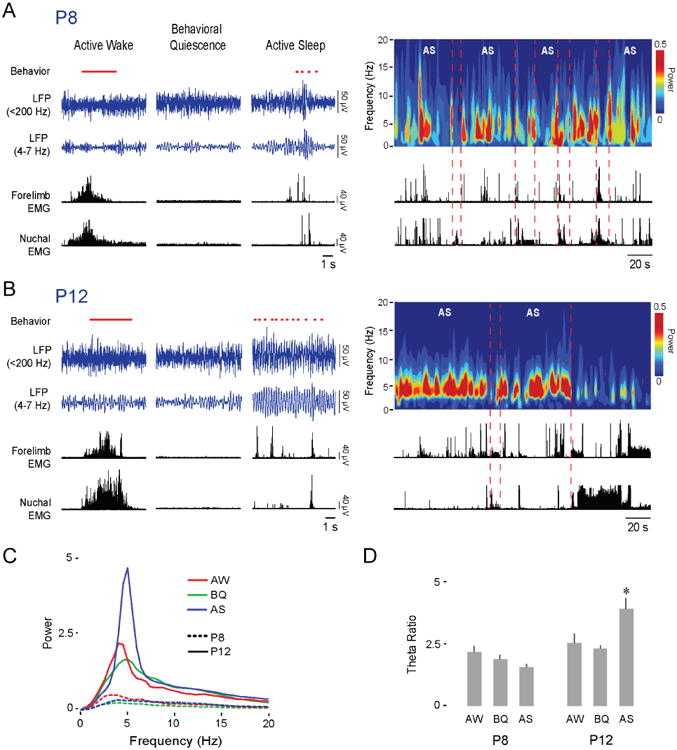
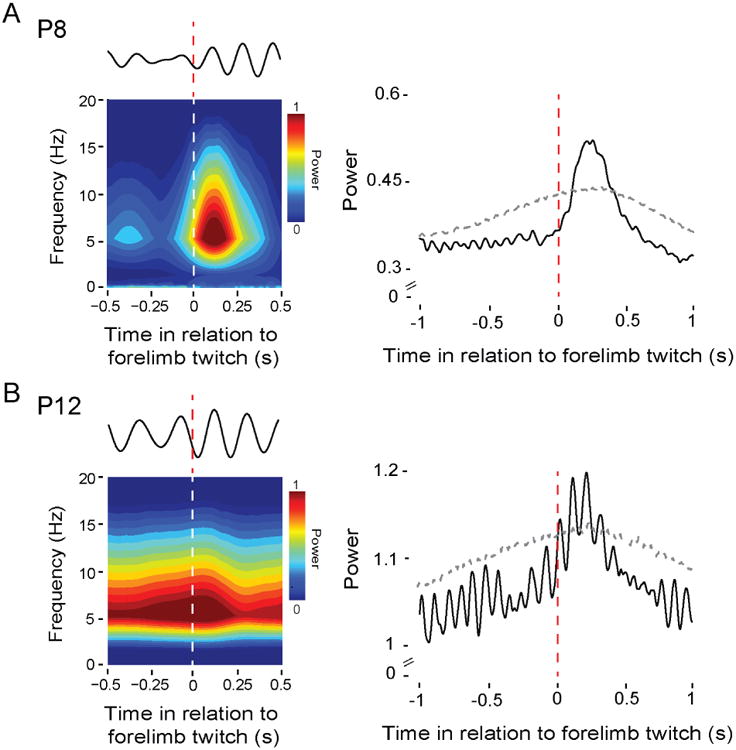
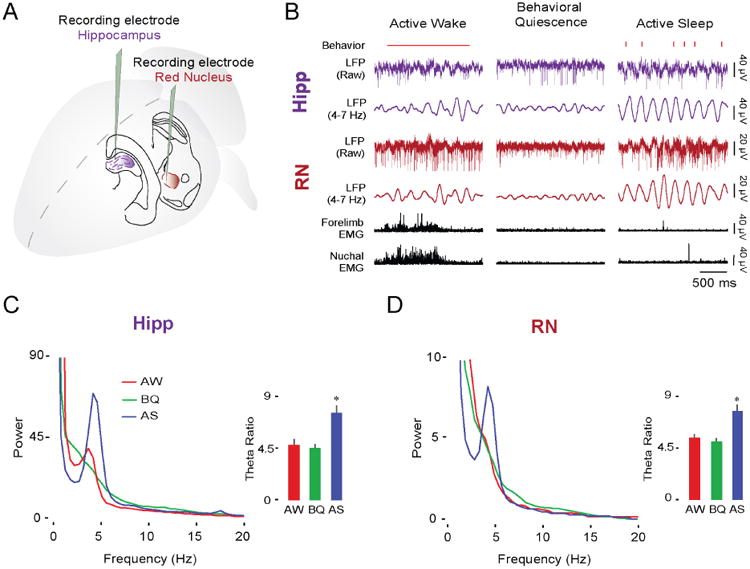
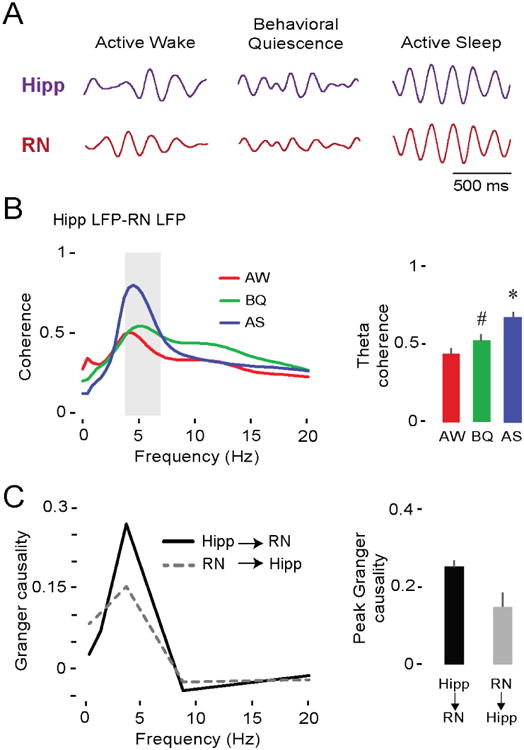
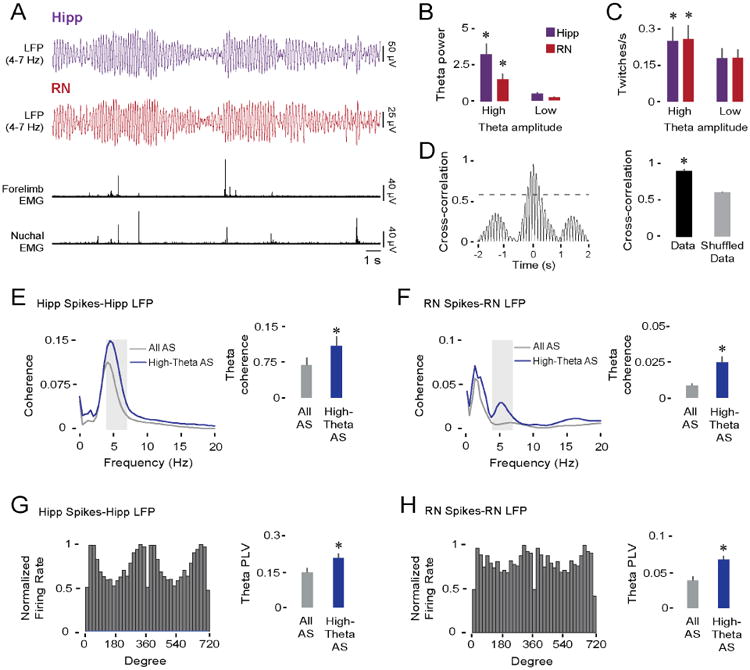
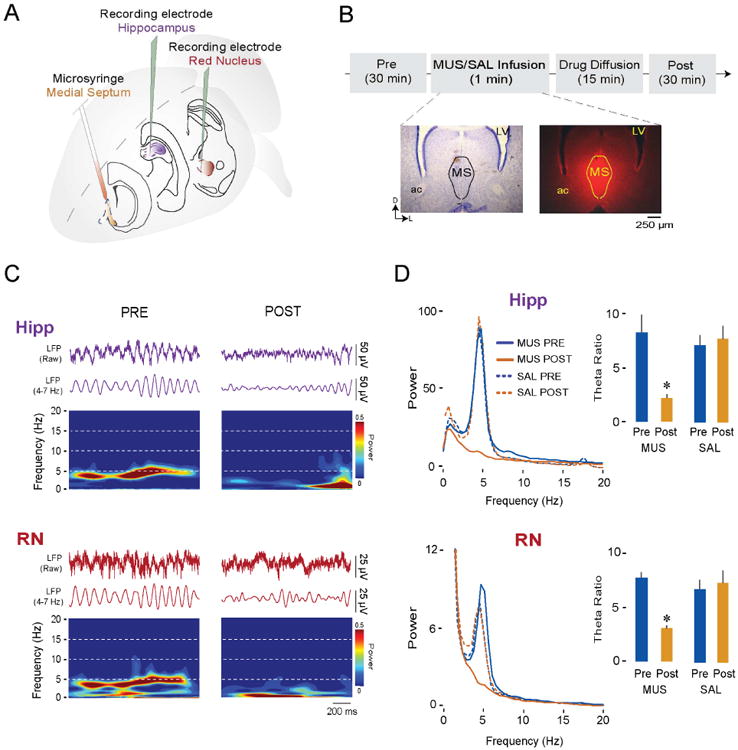
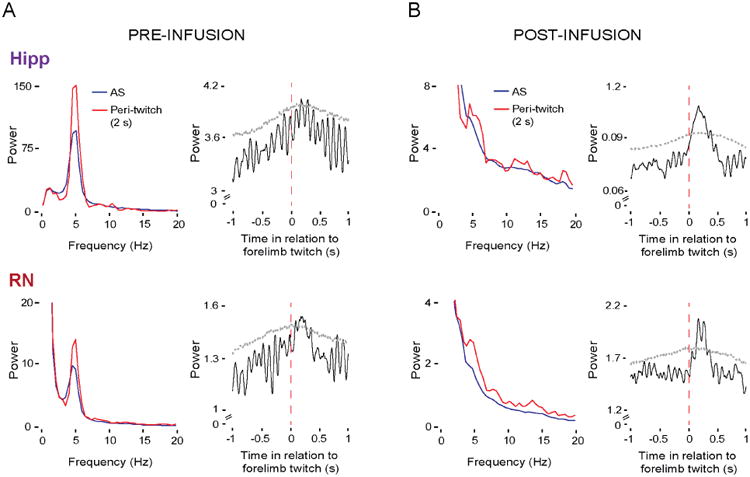
Neuronal oscillations comprise a fundamental mechanism by which distant neural structures establish and express functional connectivity. Long-range functional connectivity between the hippocampus and other forebrain structures is enabled by theta oscillations. Here, we show for the first time that the infant rat red nucleus (RN)-a brainstem sensorimotor structure-exhibits theta (4-7 Hz) oscillations restricted primarily to periods of active (REM) sleep. At postnatal day 8 (P8), theta is expressed as brief bursts immediately following myoclonic twitches; by P12, theta oscillations are expressed continuously across bouts of active sleep. Simultaneous recordings from the hippocampus and RN at P12 show that theta oscillations in both structures are coherent, co-modulated, and mutually interactive during active sleep. Critically, at P12, inactivation of the medial septum eliminates theta in both structures. The developmental emergence of theta-dependent functional coupling between the hippocampus and RN parallels that between the hippocampus and prefrontal cortex. Accordingly, disruptions in the early expression of theta could underlie the cognitive and sensorimotor deficits associated with neurodevelopmental disorders such as autism and schizophrenia.

Keywords: LFP; autism; connectivity; development; hippocampus; myoclonic twitching; neurodevelopmental disorder; red nucleus; sleep; theta rhythm.


Figures

Figure 1
Figure 1. The infant RN exhibits AS-dependent theta oscillations
(A) Left: Representative data in a P8 rat depicting sleep and wake behavior (wake movements: horizontal red line; twitches: red ticks; manually scored), RN LFP (blue traces), and forelimb and nuchal EMGs (black traces) across behavioral states. Right: Representative time-frequency spectrogram and associated EMG activity at P8 as pup cycles in and out of AS. (B) Same as in (A) but at P12. (C) Mean power spectra of LFP activity in the RN of P8 (11 pups, dashed lines) and P12 (n = 11 pups, continuous lines) rats during AW (red), BQ (green), and AS (blue). (D) Mean (+ SE) theta ratio for P8 and P12 rats during AW, BQ, and AS. Asterisk indicates significant difference from other behavioral states at P12, p < 0.002.
Figure 2
Figure 2. Myoclonic twitches trigger theta oscillations in the RN
(A) Left: Twitch-triggered time-frequency spectrogram for a representative P8 rat (108 forelimb twitches). Above the spectrogram is a representative LFP signal (4-7 Hz) from the same pup in response to a single forelimb twitch. Right: Mean twitch-triggered LFP power (4-7 Hz, root mean square) pooled across subjects (11 pups; 2,292 forelimb twitches). Horizontal dashed line denotes upper acceptance band, p < 0.01. (B) Left: Same as in (A) but at P12 (147 forelimb twitches). Right: Same as in (A) but at P12 (11 pups; 1,054 forelimb twitches).
Figure 3
Figure 3. The hippocampus and RN exhibit similar state-dependent theta activity at P12
(A) Illustration depicting electrode placements in the dorsal hippocampus and RN. (B) Representative data from a P12 rat showing sleep and wake behavior (wake movements: horizontal red line; twitches: red ticks; manually scored), simultaneously recorded LFP activity in the hippocampus (purple traces) and RN (red traces), and forelimb and nuchal EMGs (black traces) across behavioral states. (C) Mean LFP power spectra and mean (+ SE) theta ratios in the hippocampus at P12 (19 pups) during AW (red), BQ (green), and AS (blue). Asterisk denotes significant difference from other behavioral states, p < 0.001. (D) Same as in (C) but for RN. See also Figure S2 and Figure S4.
Figure 4
Figure 4. Theta oscillations in the hippocampus and RN at P12 are coherent and mutually interactive during AS
(A) Representative theta-filtered LFPs (4-7 Hz) in the hippocampus (purple trace) and RN (red trace) in a P12 rat across behavioral states. (B) Left: Mean LFP-LFP coherence spectra between hippocampus and RN (19 pups, 19 LFP pairs) during AW (red), BQ (green), and AS (blue). Shaded gray area indicates theta-frequency range. Right: Mean (+ SE) theta coherence across behavioral states. Asterisk denotes significant difference from AW and BQ, p < 0.001. Hashtag indicates significant difference from AW, p < 0.05. (C) Left: Mean Granger causality spectra for pups exhibiting significant bidirectional interactions between hippocampus and RN (p < 0.01; 9 pups, 9 LFP pairs). Right: Mean (+ SE) peak Granger causality value within theta-frequency range (9 pups, 9 LFP pairs). See also Figure S4.
Figure 5
Figure 5. Comodulation of theta in the hippocampus and RN during AS at P12
(A) Representative data in a P12 rat depicting simultaneously recorded theta-filtered LFPs (4-7 Hz) in the hippocampus (purple trace) and RN (red trace), and forelimb and nuchal EMGs (black traces). (B) Mean (+ SE) theta power in the hippocampus (purple bars) and RN (red bars) during periods of high- and low-amplitude theta (19 pups). Asterisks denote significant difference from low-amplitude theta values, p < 0.001. (C) Same as in (B) but for twitching rate. (D) Left: Representative cross-correlogram between theta-filtered LFPs in the hippocampus and RN of a P12 rat. Dashed line denotes threshold for statistical significance, p < .01. Right: Mean (+ SE) LFP cross-correlation coefficients between hippocampus and RN for actual and shuffled data (19 pups, 19 LFP pairs). Asterisk denotes significant difference, p < 0.001. (E) Left: Averaged hippocampal spike-LFP coherence spectra during entire periods of AS (gray line) and periods of AS with high-amplitude theta (blue line; 27 spike-LFP pairs). Shaded gray area indicates theta-frequency range. Right: Mean (+ SE) spike-LFP coherence within the theta-frequency range. Asterisk denotes significant difference, p < 0.004. (F) Same as in (E) but for RN spike-LFP coherence (27 spike-LFP pairs). (G) Left: Representative example of significant phase-locked spiking activity in the hippocampus. Right: Mean phase-locking values within the theta-frequency range during entire periods of AS (gray bar) and periods of AS with high-amplitude theta (blue bar; 27 spike-LFP pairs). Asterisk denotes significant difference, p < 0.005. (H) Same as in (G) but for RN phase-locking (36 spike-LFP pairs). See also Figure S1 and Figure S4.
Figure 6
Figure 6. Pharmacological inactivation of the medial septum (MS) blocks theta oscillations in both the hippocampus and RN at P12
(A) Illustration depicting electrode placements in the hippocampus and RN and microsyringe placement in the MS. (B) Experimental timeline and representative coronal Nissl-stained brain section (left) and corresponding section showing diffusion of fluorescent muscimol in the MS (right). LV = lateral ventricle; ac = anterior commissure. (C) Representative dual LFP recordings during AS in a P12 rat from the hippocampus (purple traces) and RN (red traces) and corresponding time-frequency spectrograms. (D) Left: Averaged LFP power spectra during AS in the hippocampus (top) and RN (bottom) before (Pre) and after (Post) infusion of either muscimol (MUS; 6 pups) or saline (SAL; 6 pups) into the MS. Right: Mean (+ SE) theta ratios during AS in the hippocampus (top) and RN (bottom) before and after infusion of muscimol or saline into the MS. Asterisks indicate significant difference from Pre, p < 0.02. See also Figure S3, Figure S4, and Table S1.
Figure 7
Figure 7. Twitch-triggered theta oscillations are preserved in the hippocampus and RN after pharmacological inactivation of the medial septum (MS) at P12
(A) Left: Averaged LFP power spectra in the hippocampus (top) and RN (bottom) across periods of AS (blue lines) and periods around twitches (red lines) across P12 subjects (6 pups) before infusion of muscimol into the MS. Right: Mean twitch-triggered LFP power (4-7 Hz, root mean square) for the hippocampus (top) and RN (bottom) pooled across subjects (6 pups; 256 forelimb twitches). Horizontal dashed lines denote upper acceptance bands, p < 0.05. (B) Same as in (A) but after infusion of muscimol into the MS. Data for mean twitch-triggered LFP power are from 305 forelimb twitches pooled across six pups. See also Figure S4.

References

    1. Roffwarg HP, Muzio JN, Dement WC. Ontogenetic development of the human sleep-dream cycle. Science. 1966;152:604–619. - PubMed
    1. Jouvet-Mounier D, Astic L, Lacote D. Ontogenesis of the states of sleep in rat, cat, and guinea pig during the first postnatal month. Dev Psychobiol. 1970;2:216–239. - PubMed
    1. Blumberg MS, Seelke AMH. The form and function of infant sleep: From muscle to neocortex. In: Blumberg MS, Freeman JH, Robinson SR, editors. The Oxford Handbook of Developmental Behavioral Neuroscience. New York: Oxford University Press; 2010. pp. 391–423.
    1. Kayser MS, Biron D. Sleep and development in genetically tractable model organisms. Genetics. 2016;203:21–33. - PMC - PubMed
    1. Frank MG. Sleep and developmental plasticity: Not just for kids. Prog Brain Res. 2011;193:221–232. - PubMed

LinkOut - more resources