. 2017 Jan;1(1):0005.
doi: 10.1038/s41551-016-0005. Epub 2016 Dec 19.

Self-adjusting synthetic gene circuit for correcting insulin resistance

Affiliations

Self-adjusting synthetic gene circuit for correcting insulin resistance

Haifeng Ye et al. Nat Biomed Eng. 2017 Jan.

Abstract

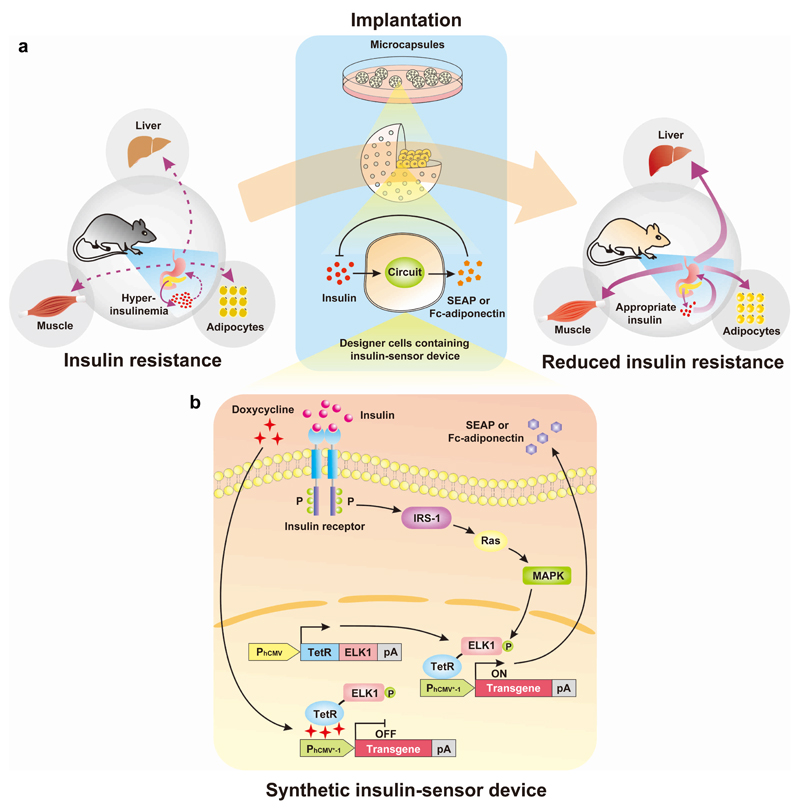
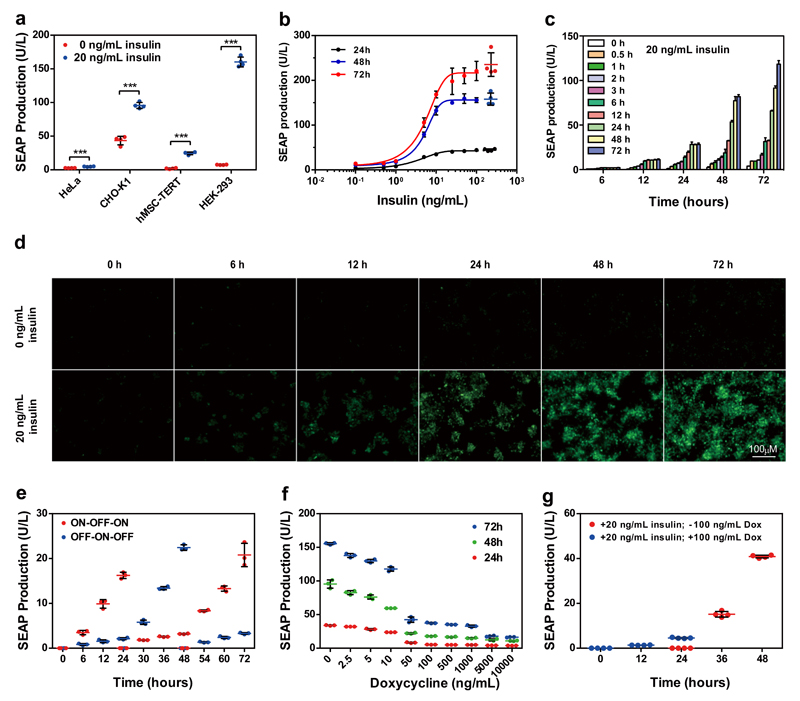
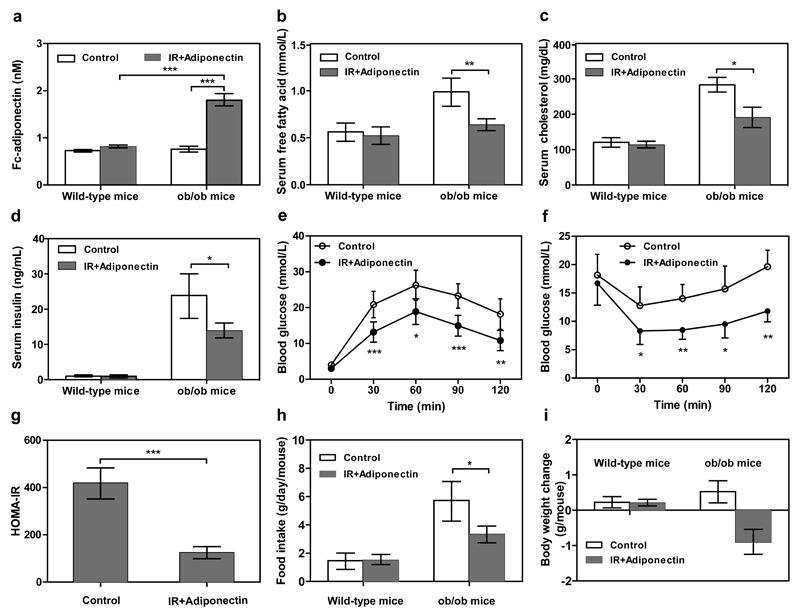
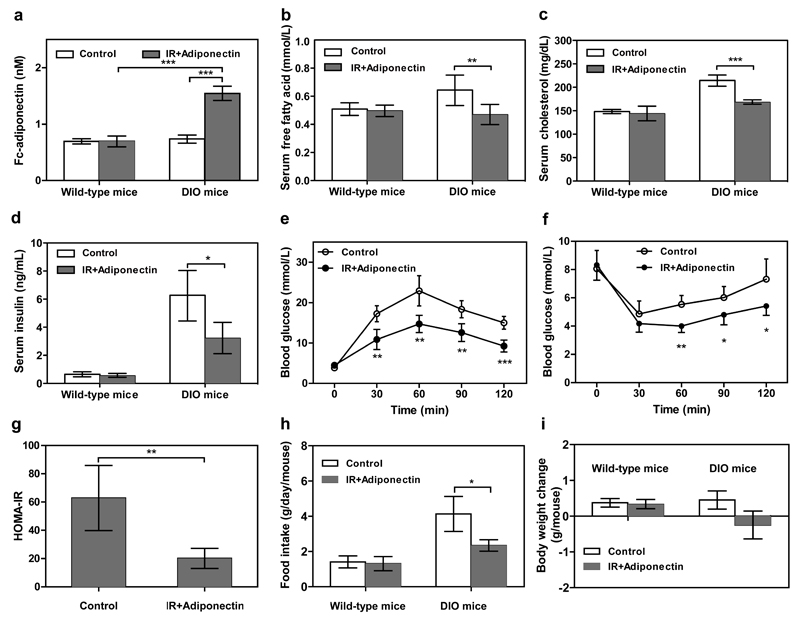
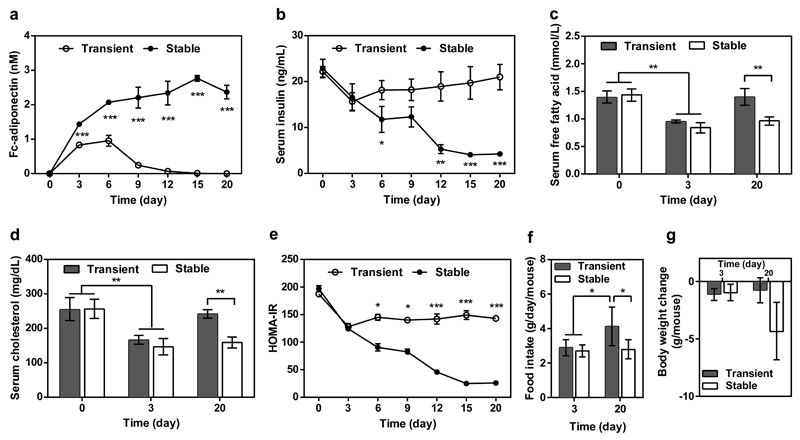
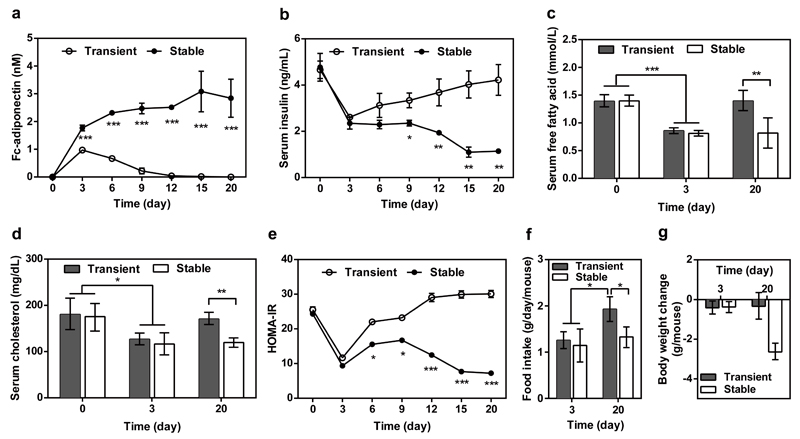
By using tools from synthetic biology, sophisticated genetic devices can be assembled to reprogram mammalian cell activities. Here, we demonstrate that a self-adjusting synthetic gene circuit can be designed to sense and reverse the insulin-resistance syndrome in different mouse models. By functionally rewiring the mitogen-activated protein kinase (MAPK) signalling pathway to produce MAPK-mediated activation of the hybrid transcription factor TetR-ELK1, we assembled a synthetic insulin-sensitive transcription-control device that self-sufficiently distinguished between physiological and increased blood insulin levels and correspondingly fine-tuned the reversible expression of therapeutic transgenes from synthetic TetR-ELK1-specific promoters. In acute experimental hyperinsulinemia, the synthetic insulin-sensing designer circuit reversed the insulin-resistance syndrome by coordinating expression of the insulin-sensitizing compound adiponectin. Engineering synthetic gene circuits to sense pathologic markers and coordinate the expression of therapeutic transgenes may provide opportunities for future gene- and cell-based treatments of multifactorial metabolic disorders.


Conflict of interest statement

Competing financial interests The authors declare no competing financial interests.

Figures

Figure 1
Figure 1. Synthetic insulin-sensitizing designer circuit for the treatment of insulin resistance.
(a) Functional and therapeutic features. Insulin resistance is characterized by the insensitivity of liver, muscle and adipocytes to blood insulin levels, which prevents cellular glucose uptake and leads to hyperinsulinaemia. The designer circuit quantifies blood insulin levels, detects hyperinsulinaemia and triggers dose-dependent adiponectin expression, which restores insulin sensitivity and attenuates the insulin-resistance syndrome. (b) Synthetic insulin-sensitizing designer cascade. The binding of insulin to the tyrosine kinase family human insulin receptor (IR) triggers autophosphorylation on multiple tyrosine residues in the IR, leading to the phosphorylation of cellular proteins such as insulin receptor substrate 1 (IRS-1). Upon tyrosine phosphorylation, these proteins interact with signaling molecules through their SH2 domains, resulting in subequent activation of Ras (a GTPase) and mitogen-activated protein kinase (MAPK). The activated MAPK enters the nucleus and phosphorylates the synthetic hybrid transcription factor, TetR-ELK1, consisting of the doxycycline-responsive DNA-binding Tet repressor (TetR) fused to the regulated activation domain of the transcription factor, ELK1, which is driven by the constitutive human cytomegalovirus immediate early promoter (PhCMV). In the basal state, TetR-ELK1, is able to bind to PhCMV*-1, a chimeric promoter containing a TetR-specific heptameric operator module (tetO7) linked to a minimal version of PhCMV (PhCMVmin), but the ELK1 domain remains inactive. Only the phosphorylation of TetR-ELK1’s ELK1 domain by upstream MAPK activity during cell signaling leads to PhCMV*-1-driven expression of the desired transgene. The addition of doxycycline disrupts the interaction between TetR-ELK1’s TetR domain and the tetO7 operator of PhCMV*-1, preventing the hybrid transcription factor from mediating the transgene expression, regardless of its phosphorylation state. When set to produce a therapeutic protein such as adiponectin that is secreted into the bloodstream the designer cascade turns into a closed-loop prosthetic network that increases the sensitivity of liver, adipose and muscle tissues to insulin which attenuates insulin release by pancreatic beta cells and reverses the insulin resistance syndrome.
Figure 2
Figure 2. Synthetic insulin-inducible mammalian sensor circuit.
(a) Insulin-inducible transgene expression in different mammalian cell lines. Insulin-triggered SEAP expression by HeLa, CHO-K1, hMSC-TERT and HEK-293 cells 72 h after cotransfection with pIR (PhCMV-IR-pA), pTetR-ELK1 (PhCMV-TetR-ELK1-pA) and pMF111 (PhCMV*-1-SEAP-pA) at a ratio of 1:1:1. The data represent the mean ± SD; n=4 independent experiments, statistical analysis using a two-tailed Student’s t-test, ***P < 0.001 vs. control. (b) The SEAP expression kinetics of HEK-293 cells cotransfected with pIR, pTetR-ELK1 and pMF111 at a ratio of 1:1:1 and cultivated for 24, 48 and 72 h in the presence or absence of different concentrations of insulin. For points with error bars comparable to the size of the symbols, only mean ± SD is displayed instead of individual points; n=4 independent experiments. (c) SEAP expression profiles of pIR-/pTetR-ELK1-/pMF111-cotransfected HEK-293 cells cultivated for different periods of time in the presence of 20 ng/mL insulin. The data represent the mean ± SD; n=3 independent experiments. (d) Fluorescence micrographs profiling EYFP expression by HEK-293 cells cotransfected with pIR, pTetR-ELK1 and pHY74 (PhCMV*-1-EYFP-pA) and cultivated for 72 h in the presence or absence of 20 ng/mL insulin. (e) Reversibility of insulin-triggered SEAP expression in HEK-293 cells. pIR-/pTetR-ELK1-/pMF111-transgenic HEK-293 cells were cultivated for 72 h while alternating the insulin status of the culture (20 ng/mL, ON; 0 ng/mL, OFF) at 24 h and 48 h. The data represent the mean ± SD; n=3 independent experiments. (f) The inhibition of insulin-triggered SEAP expression by doxycycline in HEK-293 cells. pIR-/pTetR-ELK1-/pMF111-transgenic HEK-293 cells were cultivated in the presence of 20 ng/mL insulin and different concentrations of doxycycline. The data represent the mean ± SD; n=3 independent experiments. (g) Reversibility of doxycycline-triggered SEAP expression in HEK-293 cells. pIR-/pTetR-ELK1-/pMF111-transgenic HEK-293 cells were cultivated in the presence of 20 ng/mL insulin and 100 ng/mL doxycycline for the first 24 h and in the presence of 20 ng/mL insulin and absence of 100 ng/mL doxycycline for the following 24 h. Every 24 hours, the culture medium was exchanged, and the SEAP production was profiled for up to 48 h. The data represent the mean ± SD; n=4 independent experiments.
Figure 3
Figure 3. Self-sufficient insulin-sensor-based control of adiponectin expression in insulin-resistant ob/ob mice.
Animals were intraperitoneally implanted with 2x10⁶ encapsulated pIR-/pTetR-ELK1-/pHY79-transgenic HEK-293 cells (200 cells/capsule). Control mice were intraperitoneally implanted with 2x10⁶ encapsulated pKZY73-/pTetR-ELK1-/pHY79-transgenic HEK-293 cells. After 48 hours of implantation, the serum levels of (a) transgenic Fc-adiponectin (human IgG-Fc-tagged single-chain globular adiponectin consisting of three tandem adiponectin modules fused to the IgG1-derived Fc fragment), (b) free fatty acids, (c) cholesterol and (d) insulin were profiled. (e) Glucose tolerance test and (f) insulin tolerance test were performed 24 hours after implantation (serum adiponectin levels: 1.56±0.23nM). (g) HOMA-IR levels of ob/ob mice were determined 48 h after implantation. (h) Food intake and (i) body-weight change were quantified 72h after implantation. N.D., not detectable. The data represent the mean ± SEM, statistical analysis using a two-tailed Student’s t-test, n=8 mice per group. *P < 0.05, **P<0.01, ***P < 0.001 vs. control.
Figure 4
Figure 4. Self-sufficient insulin-sensor-based control of adiponectin expression in insulin-resistant DIO mice.
Mice fed for 10 weeks with normal caloric food (10 kcal% fat) or high-fat food (60 kcal% fat) were intraperitoneally implanted with 2x10⁶ encapsulated pIR-/pTetR-ELK1-/pHY79-transgenic HEK-293 cells (200 cells/capsule). Control mice were implanted with 2x10⁶ encapsulated pKZY73-/pTetR-ELK1-/pHY79-transgenic HEK-293 cells. Serum (a) adiponectin, (b) free fatty acid, (c) cholesterol and (d) insulin levels were profiled after 48 hours of implantation. (e) Glucose tolerance test and (f) insulin tolerance test were performed 24 hours after implantation (serum adiponectin levels: 1.38±0.18nM). (g) HOMA-IR levels of DIO mice were determined 48 h after implantation. (h) Food intake and (i) body-weight change were quantified 72h after implantation. N.D., not detectable. The data represent the mean ± SEM, statistical analysis using a two-tailed Student’s t-test, n=8 mice per group. *P < 0.05, **P<0.01, ***P < 0.001 vs. control.
Figure 5
Figure 5. Long-term therapeutic efficacy of insulin-triggered adiponectin expression in insulin-resistant ob/ob mice.
Animals were intraperitoneally implanted with 2x10⁶ encapsulated HEKIR-Adipo cells (200 cells/capsule). Control animals received 2x10⁶ encapsulated pIR-/pTetR-ELK1-/pHY79-transgenic HEK-293 cells. Serum (a) adiponectin, (b) insulin (c) free fatty acid, and (d) cholesterol and (e) HOMA-IR values were determined for 20 days. (f) Food intake and (g) body-weight change were quantified on days 3 and 20. The data represent the mean ± SEM, statistical analysis using a two-tailed Student’s t-test, n=8 mice per group. *P < 0.05, **P<0.01, ***P < 0.001 vs. control.
Figure 6
Figure 6. Long-term therapeutic efficacy of insulin-triggered adiponectin expression in insulin-resistant DIO mice.
Animals were intraperitoneally implanted with 2x10⁶ encapsulated HEKIR-Adipo cells (200 cells/capsule). Control mice received 2x10⁶ encapsulated pIR-/pTetR-ELK1-/pHY79-transgenic HEK-293 cells.Serum (a) adiponectin, (b) insulin (c) free fatty acid, and (d) cholesterol and (e) HOMA-IR values were determined for 20 days. (f) Food intake and (g) body-weight change were quantified on days 3 and 20. The data represent the mean ± SEM, statistical analysis using a two-tailed Student’s t-test, n=8 mice per group. *P < 0.05, **P<0.01, ***P < 0.001 vs. control.

Comment in

References

    1. Worldwide trends in diabetes since 1980: a pooled analysis of 751 population-based studies with 4.4 million participants. Lancet. 2016;387:1513–1530. doi: 10.1016/S0140-6736(16)00618-8. - DOI - PMC - PubMed
    1. Johnson AM, Olefsky JM. The origins and drivers of insulin resistance. Cell. 2013;152:673–684. doi: 10.1016/j.cell.2013.01.041. - DOI - PubMed
    1. Samuel VT, Shulman GI. Mechanisms for insulin resistance: common threads and missing links. Cell. 2012;148:852–871. doi: 10.1016/j.cell.2012.02.017. - DOI - PMC - PubMed
    1. Prentki M, Nolan CJ. Islet beta cell failure in type 2 diabetes. The Journal of clinical investigation. 2006;116:1802–1812. doi: 10.1172/JCI29103. - DOI - PMC - PubMed
    1. Christensen R, Kristensen PK, Bartels EM, Bliddal H, Astrup A. Efficacy and safety of the weight-loss drug rimonabant: a meta-analysis of randomised trials. Lancet. 2007;370:1706–1713. doi: 10.1016/S0140-6736(07)61721-8. - DOI - PubMed