

Gag-Specific CD8 T-Cell Proliferation Is Associated With Higher Peripheral Blood Levels of Transforming Growth Factor-β and Gut-Homing T Cells in Youths Perinatally Infected With Human Immunodeficiency Virus-1: The ANRS-EP38-IMMIP Study
- PMID: 28480237
- PMCID: PMC5414023
- DOI: 10.1093/ofid/ofw239
Gag-Specific CD8 T-Cell Proliferation Is Associated With Higher Peripheral Blood Levels of Transforming Growth Factor-β and Gut-Homing T Cells in Youths Perinatally Infected With Human Immunodeficiency Virus-1: The ANRS-EP38-IMMIP Study
Abstract
Background: Gag-specific T lymphocytes play a key role in the control of human immunodeficiency virus (HIV) replication. Their restoration will be important for future reservoir targeting strategies. In this study, we aimed to identify immune correlates of Gag-specific CD8 T-cell proliferation in youths with perinatally acquired HIV-1 infection.
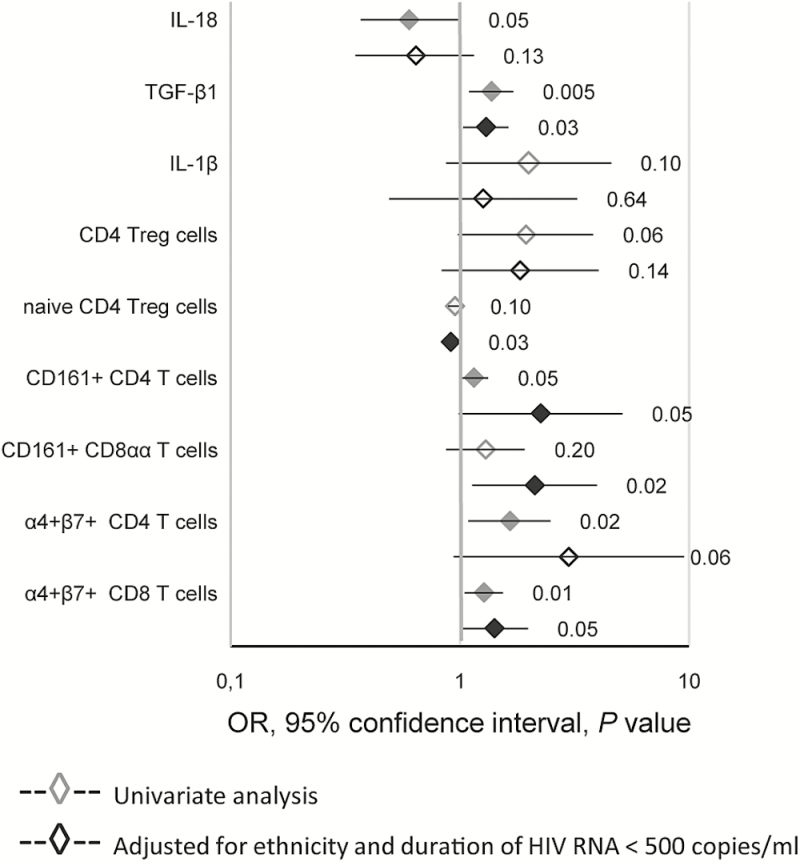
Methods: The ANRS-EP38-IMMIP study included youths of 15 to 24 years of age. Fifty-three were taking combination anti-retroviral therapy and aviremic at the time of the study and had undergone valid 5-6-carboxyfluorescein diacetate succimidyl ester-based flow cytometry T-cell proliferation assays. Plasma analytes were quantified by enzyme-linked immunosorbent assay or multiplex assays. Peripheral blood cells were phenotyped by flow cytometry. Logistic regression was used to study the association between Gag-specific T-cell proliferation and immune markers.
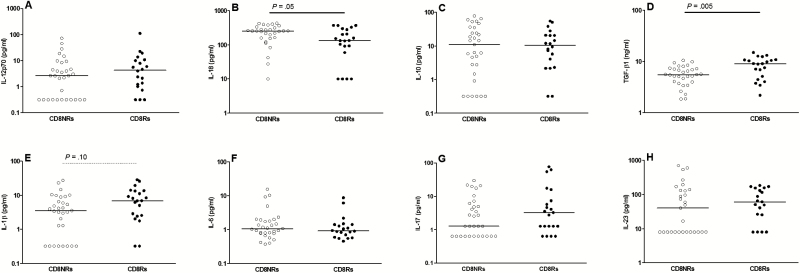
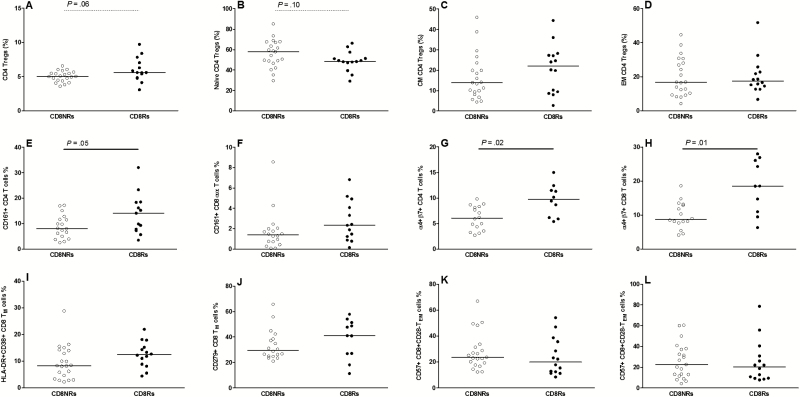
Results: Patients with Gag-specific CD8 T-cell proliferation had higher levels of plasma transforming growth factor (TGF)-β1, a lower proportion of naive cells among regulatory T cells (Tregs), and higher percentages of CD4 and CD8 T cells expressing the α4β7 integrin or CD161 molecule than those without a Gag-specific response. These associations were significant based on analyses including potential confounders.
Conclusions: Preserved Gag-specific CD8 T-cell proliferation was associated with higher TGF-β1 levels and increased percentages of T cells with a gut-homing phenotype at least 15 years after HIV infection during the perinatal period.
Keywords: CD8 T cells; HIV; mucosal immunity; perinatal infection; regulatory T cells..
© The Author 2016. Published by Oxford University Press on behalf of the Infectious Diseases Society of America.
Figures
References
-
- Shiu C, Cunningham CK, Greenough T, et al. Identification of ongoing human immunodeficiency virus type 1 (HIV-1) replication in residual viremia during recombinant HIV-1 poxvirus immunizations in patients with clinically undetectable viral loads on durable suppressive highly active antiretroviral therapy. J Virol 2009; 83:9731–42. - PMC - PubMed
LinkOut - more resources
Full Text Sources
Other Literature Sources
Research Materials
