

Spatially and Temporally Regulated NRF2 Gene Therapy Using Mcp-1 Promoter in Retinal Ganglion Cell Injury
- PMID: 28480312
- PMCID: PMC5415330
- DOI: 10.1016/j.omtm.2017.04.003
Spatially and Temporally Regulated NRF2 Gene Therapy Using Mcp-1 Promoter in Retinal Ganglion Cell Injury
Abstract
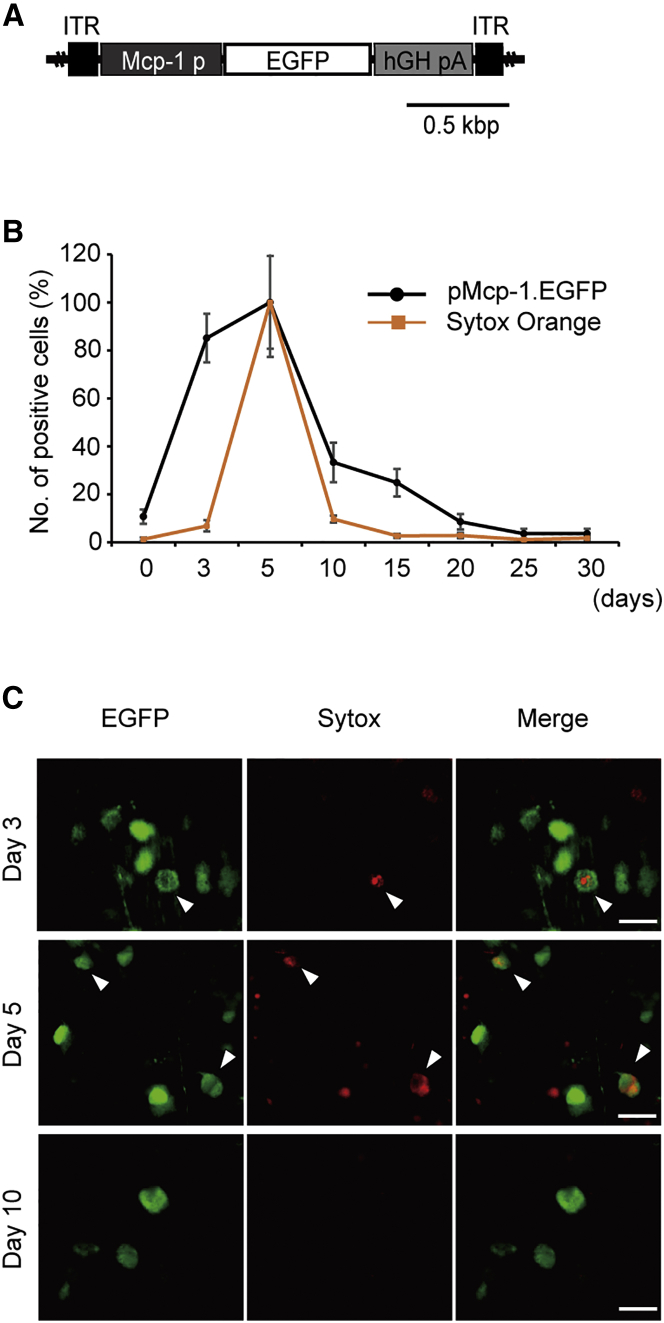
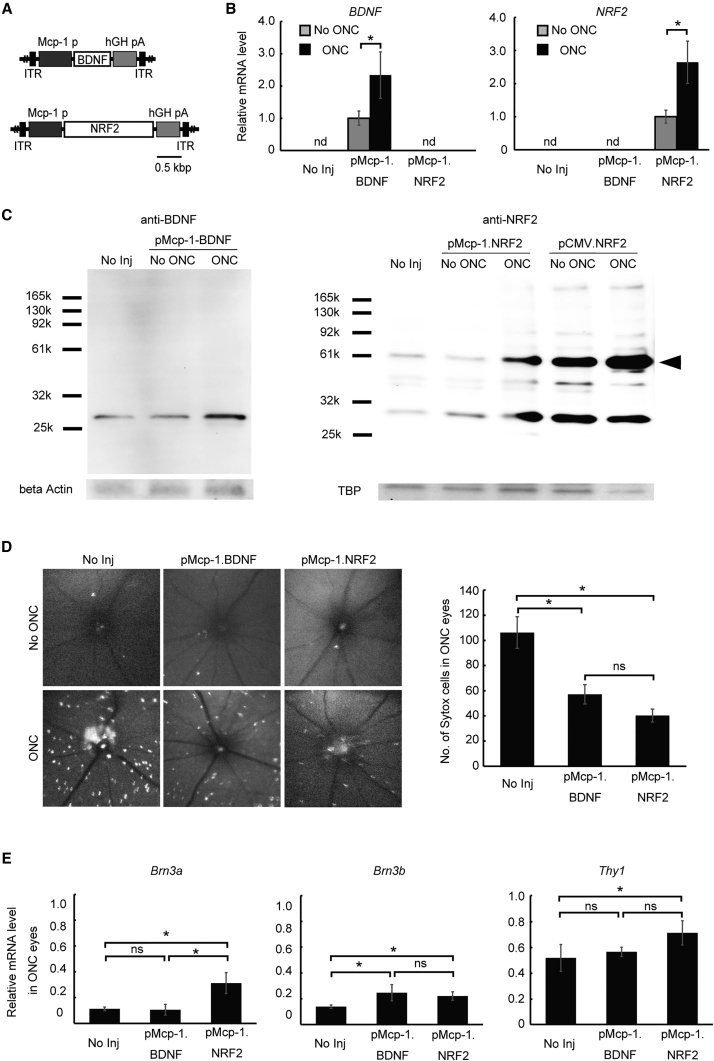
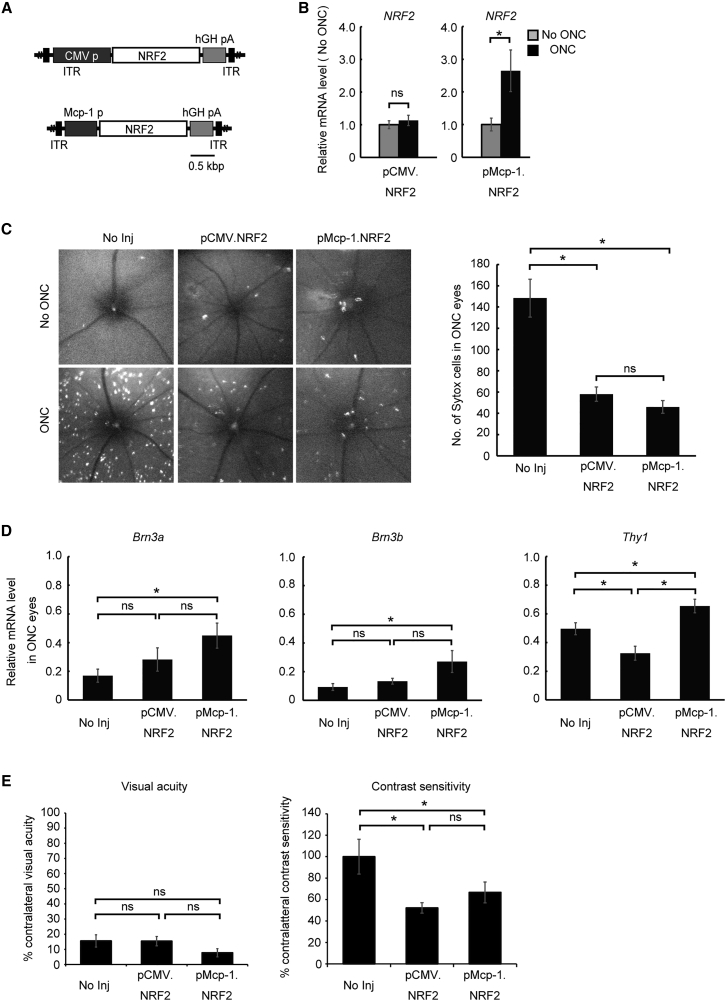
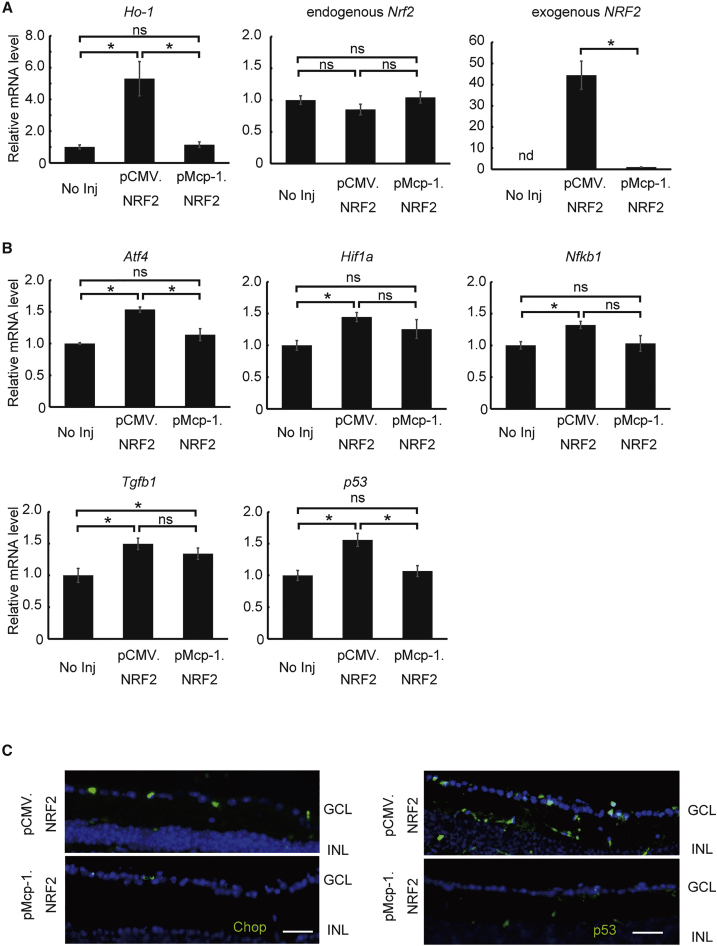
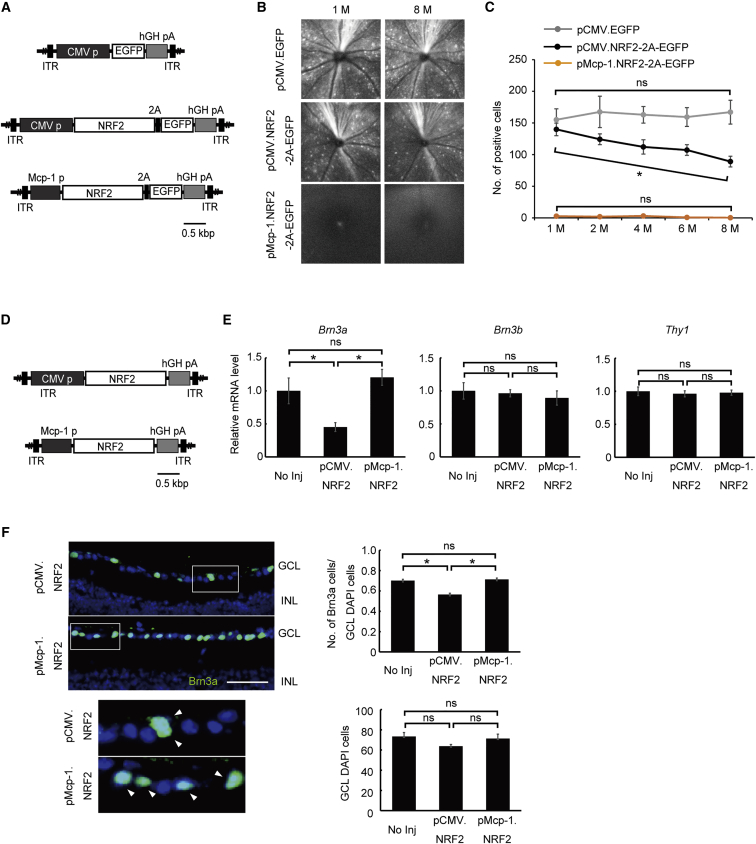
Retinal ganglion cell degeneration triggered by axonal injury is believed to underlie many ocular diseases, including glaucoma and optic neuritis. In these diseases, retinal ganglion cells are affected unevenly, both spatially and temporally, such that healthy and unhealthy cells coexist in different patterns at different time points. Herein, we describe a temporally and spatially regulated adeno-associated virus gene therapy aiming to reduce undesired off-target effects on healthy retinal neurons. The Mcp-1 promoter previously shown to be activated in stressed retinal ganglion cells following murine optic nerve injury was combined with the neuroprotective intracellular transcription factor Nrf2. In this model, Mcp-1 promoter-driven NRF2 expression targeting only stressed retinal ganglion cells showed efficacy equivalent to non-selective cytomegalovirus promoter-driven therapy for preventing cell death. However, cytomegalovirus promoter-mediated NRF2 transcription induced cellular stress responses and death of Brn3A-positive uninjured retinal ganglion cells. Such undesired effects were reduced substantially by adopting the Mcp-1 promoter. Combining a stress-responsive promoter and intracellular therapeutic gene is a versatile approach for specifically targeting cells at risk of degeneration. This strategy may be applicable to numerous chronic ocular and non-ocular conditions.
Keywords: AAV gene therapy; Mcp-1; NRF2; glaucoma; optic neuropathy; oxidative stress; retina.
Figures
Similar articles
-
SIRT1 and NRF2 Gene Transfer Mediate Distinct Neuroprotective Effects Upon Retinal Ganglion Cell Survival and Function in Experimental Optic Neuritis.Invest Ophthalmol Vis Sci. 2018 Mar 1;59(3):1212-1220. doi: 10.1167/iovs.17-22972. Invest Ophthalmol Vis Sci. 2018. PMID: 29494741 Free PMC article.
-
[Aiming for zero blindness].Nippon Ganka Gakkai Zasshi. 2015 Mar;119(3):168-93; discussion 194. Nippon Ganka Gakkai Zasshi. 2015. PMID: 25854109 Review. Japanese.
-
Neuroprotective role of Nrf2 for retinal ganglion cells in ischemia-reperfusion.J Neurochem. 2015 Apr;133(2):233-41. doi: 10.1111/jnc.13064. Epub 2015 Mar 4. J Neurochem. 2015. PMID: 25683606 Free PMC article.
-
Marine-Steroid Derivative 5α-Androst-3β, 5α, 6β-triol Protects Retinal Ganglion Cells from Ischemia⁻Reperfusion Injury by Activating Nrf2 Pathway.Mar Drugs. 2019 May 5;17(5):267. doi: 10.3390/md17050267. Mar Drugs. 2019. PMID: 31060323 Free PMC article.
-
The Nrf2 Signaling in Retinal Ganglion Cells under Oxidative Stress in Ocular Neurodegenerative Diseases.Int J Biol Sci. 2018 Jun 8;14(9):1090-1098. doi: 10.7150/ijbs.25996. eCollection 2018. Int J Biol Sci. 2018. PMID: 29989056 Free PMC article. Review.
Cited by
-
AAV-mediated gene therapies for glaucoma and uveitis: are we there yet?Expert Rev Mol Med. 2024 Apr 15;26:e9. doi: 10.1017/erm.2024.4. Expert Rev Mol Med. 2024. PMID: 38618935 Free PMC article. Review.
-
The concept of gene therapy for glaucoma: the dream that has not come true yet.Neural Regen Res. 2024 Jan;19(1):92-99. doi: 10.4103/1673-5374.375319. Neural Regen Res. 2024. PMID: 37488850 Free PMC article. Review.
-
Erythropoietin in Glaucoma: From Mechanism to Therapy.Int J Mol Sci. 2023 Feb 3;24(3):2985. doi: 10.3390/ijms24032985. Int J Mol Sci. 2023. PMID: 36769310 Free PMC article. Review.
-
GSK3 Is a Central Player in Retinal Degenerative Diseases but a Challenging Therapeutic Target.Cells. 2022 Sep 16;11(18):2898. doi: 10.3390/cells11182898. Cells. 2022. PMID: 36139472 Free PMC article. Review.
-
Retained Plasticity and Substantial Recovery of Rod-Mediated Visual Acuity at the Visual Cortex in Blind Adult Mice with Retinal Dystrophy.Mol Ther. 2018 Oct 3;26(10):2397-2406. doi: 10.1016/j.ymthe.2018.07.012. Epub 2018 Jul 17. Mol Ther. 2018. PMID: 30064895 Free PMC article.
References
-
- Quigley H.A., Addicks E.M., Green W.R. Optic nerve damage in human glaucoma. III. Quantitative correlation of nerve fiber loss and visual field defect in glaucoma, ischemic neuropathy, papilledema, and toxic neuropathy. Arch. Ophthalmol. 1982;100:135–146. - PubMed
-
- Izzotti A., Saccà S.C., Cartiglia C., De Flora S. Oxidative deoxyribonucleic acid damage in the eyes of glaucoma patients. Am. J. Med. 2003;114:638–646. - PubMed
-
- Ferreira S.M., Lerner S.F., Brunzini R., Evelson P.A., Llesuy S.F. Oxidative stress markers in aqueous humor of glaucoma patients. Am. J. Ophthalmol. 2004;137:62–69. - PubMed
-
- Himori N., Kunikata H., Shiga Y., Omodaka K., Maruyama K., Takahashi H., Nakazawa T. The association between systemic oxidative stress and ocular blood flow in patients with normal-tension glaucoma. Graefes Arch. Clin. Exp. Ophthalmol. 2016;254:333–341. - PubMed
LinkOut - more resources
Full Text Sources
Other Literature Sources
Miscellaneous
