. 2017 Mar 21:5:41-61.
doi: 10.1016/j.omto.2017.03.001. eCollection 2017 Jun 16.

Humanized Mice with Subcutaneous Human Solid Tumors for Immune Response Analysis of Vaccinia Virus-Mediated Oncolysis

Affiliations

Humanized Mice with Subcutaneous Human Solid Tumors for Immune Response Analysis of Vaccinia Virus-Mediated Oncolysis

Desislava Tsoneva et al. Mol Ther Oncolytics. .

Abstract

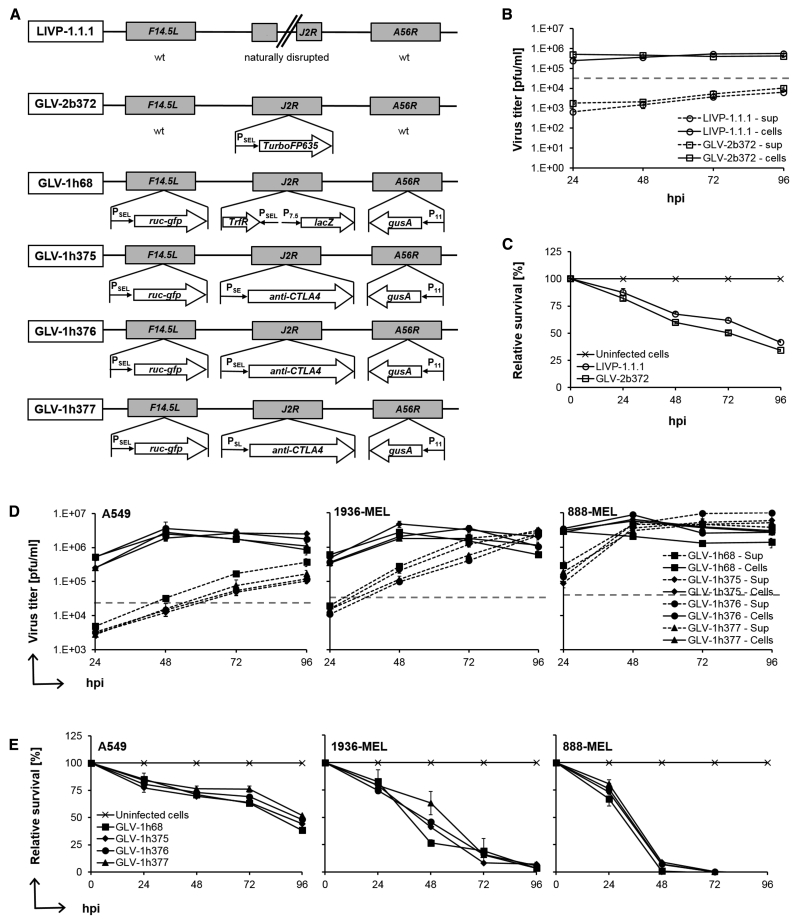
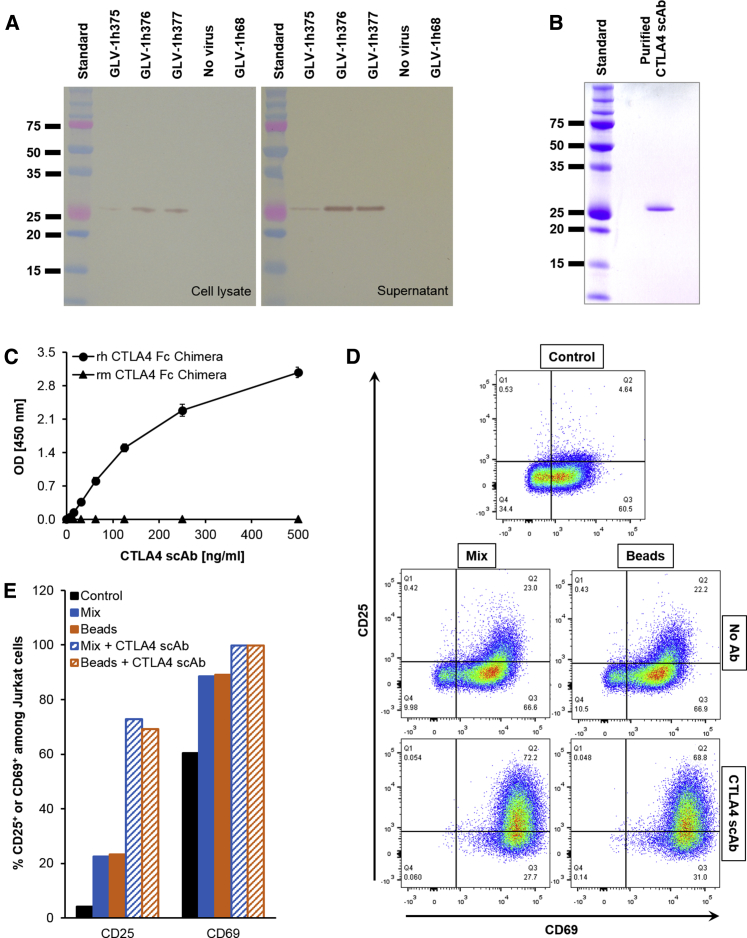
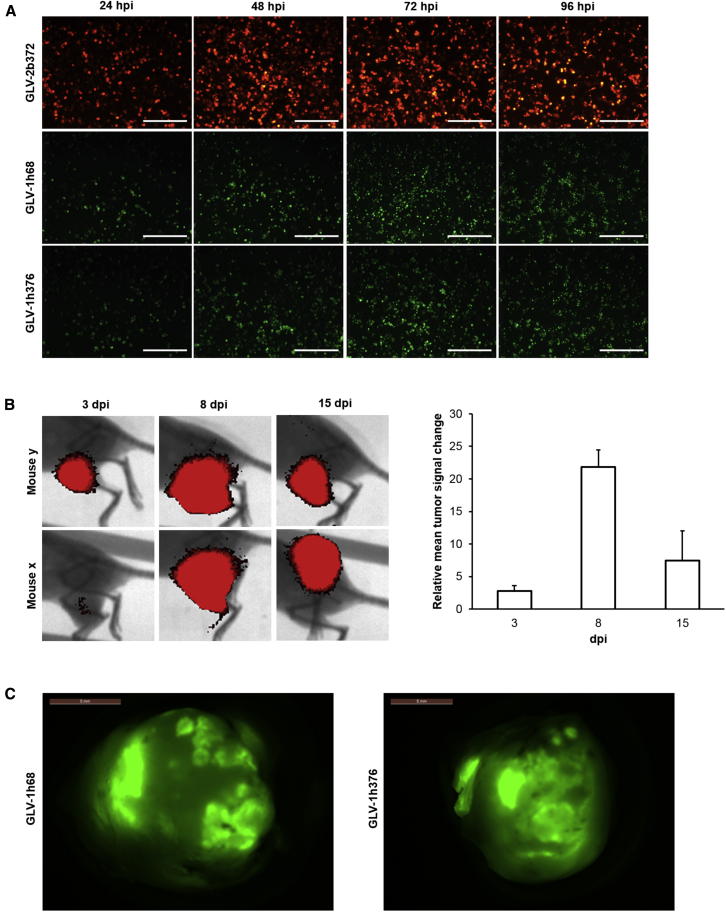
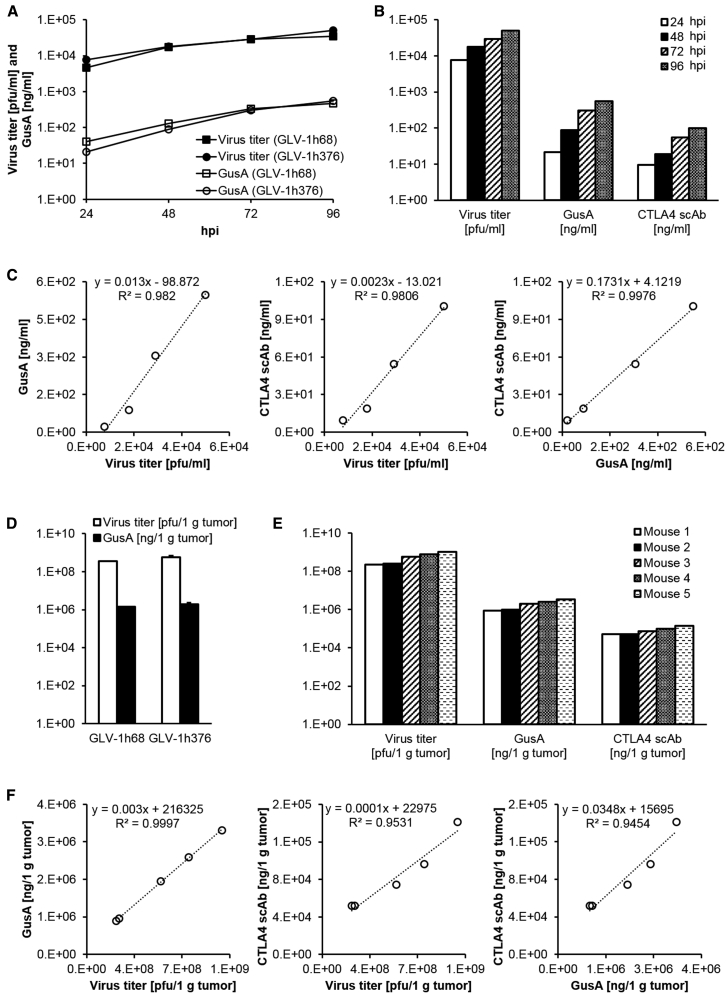
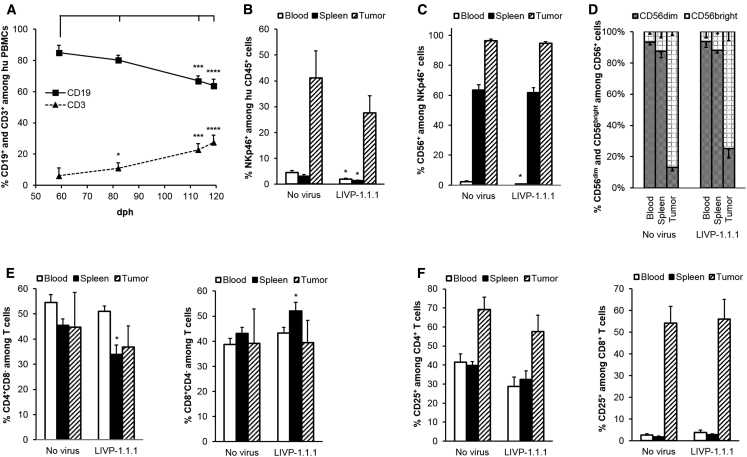
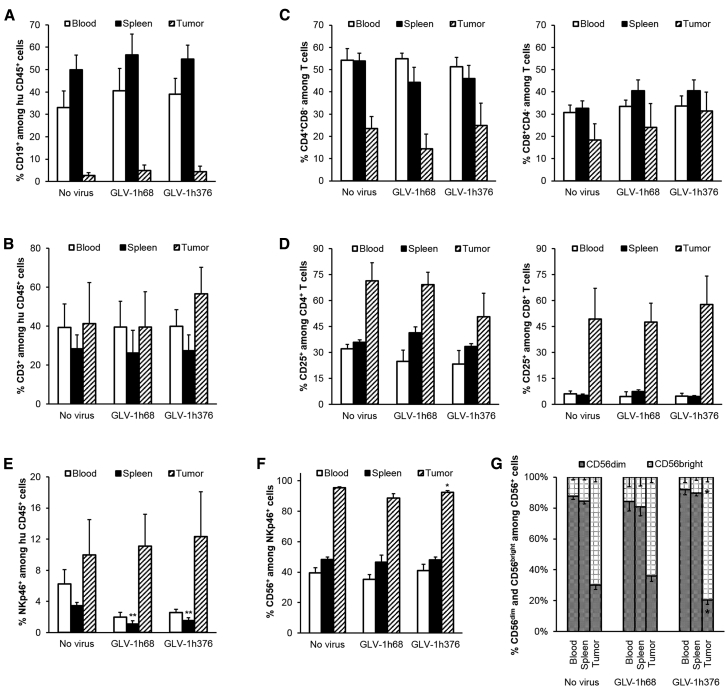
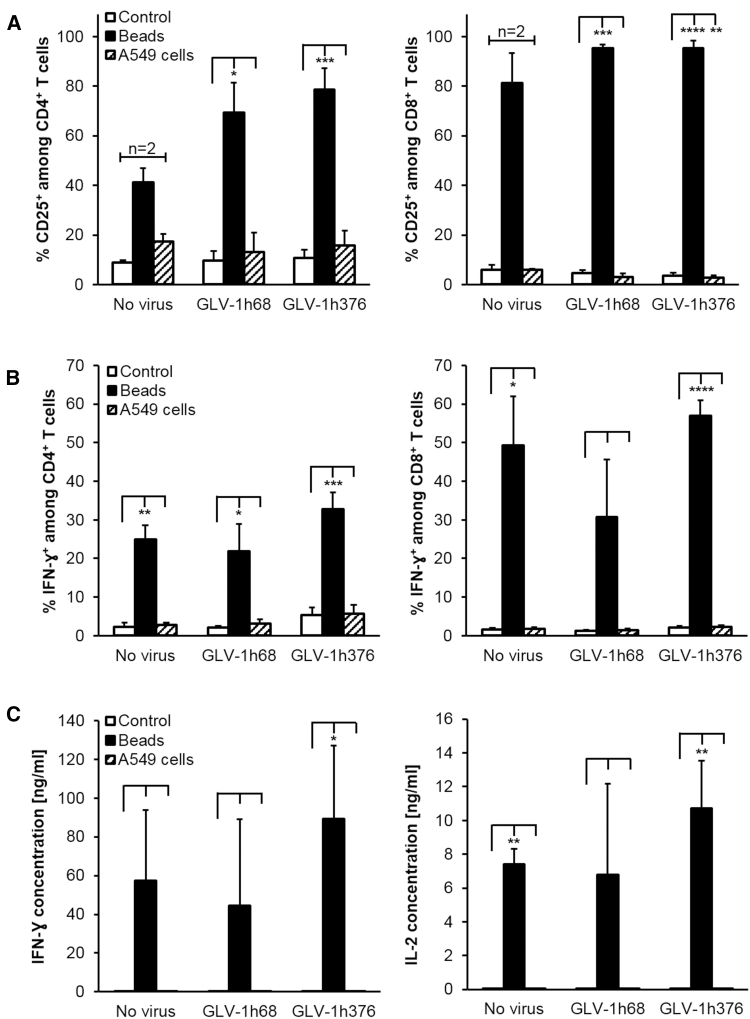
Oncolytic vaccinia virus (VACV) therapy is an alternative cancer treatment modality that mediates targeted tumor destruction through a tumor-selective replication and an induction of anti-tumor immunity. We developed a humanized tumor mouse model with subcutaneous human tumors to analyze the interactions of VACV with the developing tumors and human immune system. A successful systemic reconstitution with human immune cells including functional T cells as well as development of tumors infiltrated with human T and natural killer (NK) cells was observed. We also demonstrated successful in vivo colonization of such tumors with systemically administered VACVs. Further, a new recombinant GLV-1h376 VACV encoding for a secreted human CTLA4-blocking single-chain antibody (CTLA4 scAb) was tested. Surprisingly, although proving CTLA4 scAb's in vitro binding ability and functionality in cell culture, beside the significant increase of CD56bright NK cell subset, GLV-1h376 was not able to increase cytotoxic T or overall NK cell levels at the tumor site. Importantly, the virus-encoded β-glucuronidase as a measure of viral titer and CTLA4 scAb amount was demonstrated. Therefore, studies in our "patient-like" humanized tumor mouse model allow the exploration of newly designed therapy strategies considering the complex relationships between the developing tumor, the oncolytic virus, and the human immune system.


Figures

Figure 1
Figure 1
VACV Constructs, Replication, and Cytotoxicity Assays (A) Schematic representation of VACV constructs and marker genes. LIVP-1.1.1 is an isolate from the WT LIVP with naturally disrupted J2R locus. GLV-2b372 was delivered from LIVP-1.1.1 by inserting the far-red fluorescent protein TurboFP635 (TurboFP635) expression cassette into the J2R locus under the control of the VACV synthetic early/late promoter (PSEL). The recombinant VACV strain GLV-1h68 was constructed as specified by Zhang et al. GLV-1h375, -1h376, and -1h377 were delivered from GLV-1h68 by replacing the TrfR lacZ expression cassette at the J2R locus with the anti-human CTLA4 FLAG-tagged single-chain antibody (anti-CTLA4) expression cassette under three different VACV synthetic early (PSE), early/late (PSEL), and late (PSL) promoters, respectively. (B and D) Replication assay. Human A549 or A549, 1936-MEL, and 888-MEL cell cultures were infected with LIVP-1.1.1 (open circle) and GLV-2b372 (open squares) or GLV-1h68 (squares), -1h375 (diamonds), -1h376 (circles), and -1h377 (triangles), respectively, at an MOI of 0.1. To determine replication efficiency, supernatants and cell lysates of infected cells were collected separately and in triplicates at 24, 48, 72, and 96 hpi. Viral titers were determined as PFUs per milliliter (PFUs/mL) of medium by standard plaque assay in CV-1 cell monolayers and plotted against the course of time. Mean values (n = 3) and SEM are plotted. (C and E) Viability of infected cells was monitored in triplicates over 96 hr using an MTT assay. Viable cells were calculated as percentage from the mock-infected control cells for each time point, which were considered to be 100% viable. Mean values (n = 3) and SEM are plotted.
Figure 2
Figure 2
Overexpression, Purification, Affinity, and Functionality of Virus-Mediated CTLA4 scAb (A) A549 cells were infected with rVACV strains at an MOI of 1. Cell lysates and supernatants of infected cultures were collected 24 hr later, and 4 and 10 μg of protein, respectively, were separated by SDS-PAGE. Intracellular and secreted FLAG-tagged CTLA4 scAb with the expected size of 29.81 and 27.46 kDa, respectively, was detected in the western blots using an anti-DDDDK antibody. Lines show standard band in kilodaltons. (B) CV-1 cell cultures were infected with GLV-1h376 at an MOI of 2. Supernatant was harvested 24 hr later and concentrated. CTLA4 scAb was purified using affinity gel. To verify its purity, a sample of the eluted scAb was separated by SDS-PAGE and stained with Coomassie brilliant blue. A Coomassie-stained gel shows the purified CTLA4 scAb. (C) Affinity of VACV-encoded and purified CTLA4 scAb and its lack of cross-reactivity were demonstrated by ELISA. 96-well plates were coated with recombinant human CTLA4 (rh CTLA4) Fc chimera (circles) or recombinant mouse CTLA4 (rm CTLA4) Fc chimera (triangles). Absorbance (OD) obtained for various CTLA4 scAb concentrations against both human and mouse Fc chimeras is plotted. Mean values (n = 3) and SEM are shown. (D and E) Jurkat cells were activated with a mix of PMA, Ionomycin, B7-1, and B7-2 or with commercially available T cell activation beads, alone, or additionally supplemented with purified CTLA4 scAb. Untreated samples of Jurkat cells were left as a control. Forty-eight hours later, all samples were analyzed in duplicates for early CD69 and late CD25 activation marker expression by flow cytometry. Images of representative dot plots (D) and corresponding bar graphs (E) are shown.
Figure 3
Figure 3
VACV-Mediated Fluorescent Protein Expression in Tumor Cell Culture and in Tumors (A) A549 cell cultures were infected with GLV-2b372, GLV-1h68, or -1h376 at an MOI of 0.1 and monitored over 96 hr. TurboFP635 and GFP expression in infected cell cultures was visualized by direct fluorescent microscopy and increased in a time-dependent fashion. Scale bar, 500 μm. (B) A549-tumor-bearing humanized NSG mice were injected retro-orbitally (r.o.) with 6 × 106 viral particles of GLV-2b372. Animals were imaged for TurboFP635 expression at 3 (n = 4), 8 (n = 3), and 15 (n = 3) dpi. The images show the tumor area of two representative mice. The TurboFP635 signal from the GLV-2b372 colonized A549 tumors was measured in relative fluorescence units. Relative tumor signal change was monitored over 15 dpi. Mean values and SEM are plotted. (C) A549-tumor-bearing humanized NSG mice were injected r.o. with 6 × 106 viral particles of GLV-1h68 or -1h376. Ten-dpi tumors were excised and examined for GFP expression by direct fluorescent microscopy. Representative pictures from both virus groups are shown. Scale bar, 5 mm.
Figure 4
Figure 4
CTLA4 scAb and β-Glucuronidase Expression in GLV-1h376-Infected A549 Cell Cultures or Subcutaneous Tumors (A–C) A549 cell cultures were infected with GLV-1h376 or the control GLV-1h68 (CTLA4 scAbnegative) strain at an MOI of 0.005. Supernatants and cell lysates of infected cells were harvested separately and in triplicates at 24, 48, 72, and 96 hpi. After collecting all time points, samples were assayed for PFUs, β-glucuronidase (GusA), and CTLA4 scAb by standard plaque assay, β-glucuronidase assay, and ELISA, respectively. Shown values per milliliter are the sum of the supernatant and cell lysate values. (A) Virus replication efficiency (circles and squares) and GusA expression pattern (open circles and squares) in GLV-1h376- and -1h68-infected cells, respectively. (B) Viral titer and GusA and CTLA4 scAb levels in GLV-1h376-treated cells during the time of the infection. (C) Correlation with correlation coefficients R2 > 0.9806 were observed between virus titer, GusA, and CTLA4 scAb in GLV-1h376-infected cells. (D–F) A549-tumor-bearing humanized NSG mice were injected with GLV-1h68 (n = 5) or -1h376 (n = 5). Tumors were excised at 15 weeks post-humanization and 10 days after virus administration. Prepared single-cell suspensions were assayed for PFUs, GusA, and CTLA4 scAb by standard plaque assay, β-glucuronidase assay, and ELISA, respectively. Values are shown per 1 g of tumor tissue. (D) Virus titers (no fill) and GusA concentrations (solid fill) in GLV-1h376- and -1h68-colonized tumors. Mean values and SEM are plotted. (E) Virus titer and GusA and CTLA4 scAb concentrations in tumors from five GLV-1h376-treated mice. (F) Correlation with correlation coefficients R2 > 0.9454 were observed between virus titer, GusA, and CTLA4 scAb in GLV-1h376-colonized tumors.
Figure 5
Figure 5
Immunohistochemical Analysis of Vaccinia-Virus-Colonized Tumors A549-tumor-bearing humanized NSG mice were injected retro-orbitally with LIVP-1.1.1 or GLV-2b372 at 12 weeks post-humanization. At 3, 8, and 15 dpi, tumors from both mouse groups were excised for immunohistochemistry. Slides with tumor sections were stained for VACV and counterstained with hematoxylin. Tumor sections from representative LIVP-1.1.1- (A) or GLV-2b372- (B) injected mice obtained at 40× (scale bar, 1mm) and 100× (scale bar, 500 μm) magnification are shown.
Figure 6
Figure 6
Flow Cytometric Analysis of Human B, T, and NK Cell Populations in Untreated or LIVP-1.1.1-Virus-Treated Tumor-Bearing Humanized NSG Mice Human hematopoietic cells were stained with mouse anti-human monoclonal antibodies (mAbs) and gated first on human CD45 and then the respective lineage-specific marker. Flow cytometric analysis was performed, and percentages were calculated. Mean values and SEM are plotted. (A) Peripheral human CD19+ B (squares) and CD3+ T (triangles) cell reconstitution. Blood from humanized A549-tumor-bearing NSG mice (n = 17) was collected at 59, 82, 113, and 119 days post-humanization (dph). Gating strategy was as follows: CD45+ → CD19+ or CD3+. Differences between first and each consecutive measurement for B or T cells were tested using a two-tailed paired t test (*p < 0.05, **p < 0.01, ***p < 0.001, ****p < 0.0001). (B–F) Blood (no fill), spleen (solid fill), and tumor (diagonal) samples from untreated (n = 5) or LIVP-1.1.1-virus-injected (n = 9) A549-tumor-bearing humanized NSG mice were analyzed for presence of human immune cell reconstitution at 18 weeks post-humanization and 8 days after virus administration. Differences between corresponding samples of untreated and virus-treated groups were tested using a two-tailed t test for two samples with unequal variance (*p < 0.05, **p < 0.01, ***p < 0.001, ****p < 0.0001). (B) NK cells were gated on the NKp46 marker. (C) CD3NKp46+ subset was additionally examined for CD56 expression. (D) Percentage of CD56dim (gray pattern) and CD56bright (dotted grid) among CD3NKp46+CD56+ NK cells from (C). Gating strategy was as follows: CD45+ → CD3NKp46+ → CD56+ → (CD56dim or CD56bright). (E) T cells were gated on CD3 and then the respective CD4 (left panel) or CD8 (right panel) lineage-specific marker. One mouse from each group did not show tumor infiltration with T cells and was therefore excluded from the analysis of the tumor data. (F) CD4 (left panel) and CD8 (right panel) single-positive cells were additionally examined for CD25 expression. Gating strategy was as follows: CD45+ → CD3+ → (CD4+CD8 or CD8+CD4) → CD25+.
Figure 7
Figure 7
Presence of Human B, T, and NK Cells in Untreated and GLV-1h68- or -1h376-Injected Humanized A549-Tumor-Bearing NSG Mice Blood (no fill), spleen (solid fill), and tumor (diagonal) samples from untreated (n = 4) or GLV-1h68- (n = 5) or -1h376- (n = 5) injected A549-tumor-bearing humanized NSG mice were analyzed by flow cytometry for presence of human immune cell reconstitution. Analysis was performed 15 weeks post-humanization and 10 days after virus administration. Human hematopoietic cells were stained with mAbs. B (A), T (B), and NK (E) cells were first gated on human CD45 and then the respective lineage-specific marker: CD19, CD3, and NKp46, respectively. (C) CD4 (left panel) or CD8 (right panel) expression was determined following gating on CD3+ T cells. (D) CD4 (left panel) and CD8 (right panel) single-positive cells were additionally examined for CD25 expression. Gating strategy was as follows: CD45+ → CD3+ → (CD4+CD8 or CD8+CD4) → CD25+. (F) CD3NKp46+ subset was further examined for CD56 expression. (G) Percentage of CD56dim (gray pattern) and CD56bright (dotted grid) among CD3NKp46+CD56+ NK cells from (F). Gating strategy was as follows: CD45+ → CD3NKp46+ → CD56+ → (CD56dim or CD56bright). Mean values and SEM are plotted. Differences between corresponding samples of untreated and virus-treated groups were tested using a two-tailed t test for two samples with unequal variance (*p < 0.05, **p < 0.01, ***p < 0.001, ****p < 0.0001).
Figure 8
Figure 8
Splenocytes Activation Assay Spleens from untreated, GLV-1h68-, or -1h376-injected A549-tumor-bearing humanized NSG mice were collected at 15 weeks post-humanization and 10 days after VACV administration. Single-cell suspension from each spleen was separated into three groups (equal number of cells per well) and treated with PBS (no fill), human T cell activation beads (solid fill), or irradiated A549 cells (pattern fill) for 48 hr. Differences between bead-activated or A549 cells-treated and corresponding control samples were tested using a one- or two-tailed paired t test, respectively (*p < 0.05, **p < 0.01, ***p < 0.001, ****p < 0.0001). (A) Cells were stained with mAbs against surface markers and subjected to flow cytometric analysis. CD25-expressing CD4+ (left panel) and CD8+ (right panel) subpopulations were first gated on human CD45 and then the respective lineage-specific marker. Gating strategy was as follows: CD45+ → CD3+ → (CD4+ or CD8+) → CD25+. Mean values in percentage and SEM of untreated (n = 2), GLV-1h68 (n = 3), and GLV-1h376 (n = 4) groups are plotted. (B) IFN-ɣ expression in CD4+ (left panel) and CD8+ (right panel) T cells was determined by intracellular staining using a mouse anti-human IFN-ɣ mAb. Gating strategy was as follows: CD45+ → CD3+ → (CD4+ or CD8+) → IFN-ɣ+. Mean values in percentage and SEM for untreated (n = 3), GLV-1h68 (n = 4), and GLV-1h376 (n = 5) groups are plotted. (C) Human IFN-ɣ (left panel) and interleukin-2 (IL-2, right panel) levels in splenocytes' culture supernatant samples were assayed by ELISA. Mean values are in nanograms per milliliter, and SEM for untreated (n = 3), GLV-1h68 (n = 4), and GLV-1h376 (n = 5) groups are plotted.

Similar articles

Cited by

References

    1. International Agency for Research on Cancer of World Health Organisation . World Cancer Report 2014. In: Stewart B.W., Wild C., editors. IARC; 2014.
    1. Woo Y., Adusumilli P.S., Fong Y. Advances in oncolytic viral therapy. Curr. Opin. Investig. Drugs. 2006;7:549–559. - PubMed
    1. Mullen J.T., Tanabe K.K. Viral oncolysis for malignant liver tumors. Ann. Surg. Oncol. 2003;10:596–605. - PubMed
    1. Chen N.G., Szalay A.A. Oncolytic vaccinia virus: A theranostic agent for cancer. Future Virol. 2010;5:763–784.
    1. Kaufman H.L., Kohlhapp F.J., Zloza A. Oncolytic viruses: A new class of immunotherapy drugs. Nat. Rev. Drug Discov. 2015;14:642–662. - PMC - PubMed