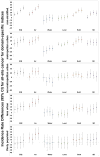
County-level cumulative environmental quality associated with cancer incidence
- PMID: 28480506
- PMCID: PMC6121813
- DOI: 10.1002/cncr.30709
County-level cumulative environmental quality associated with cancer incidence
Erratum in
-
Errata.Cancer. 2019 May 15;125(10):1756. doi: 10.1002/cncr.31992. Epub 2019 Feb 1. Cancer. 2019. PMID: 31026077 No abstract available.
Abstract
Background: Individual environmental exposures are associated with cancer development; however, environmental exposures occur simultaneously. The Environmental Quality Index (EQI) is a county-level measure of cumulative environmental exposures that occur in 5 domains.
Methods: The EQI was linked to county-level annual age-adjusted cancer incidence rates from the Surveillance, Epidemiology, and End Results (SEER) Program state cancer profiles. All-site cancer and the top 3 site-specific cancers for male and female subjects were considered. Incident rate differences (IRDs; annual rate difference per 100,000 persons) and 95% confidence intervals (CIs) were estimated using fixed-slope, random intercept multilevel linear regression models. Associations were assessed with domain-specific indices and analyses were stratified by rural/urban status.
Results: Comparing the highest quintile/poorest environmental quality with the lowest quintile/best environmental quality for overall EQI, all-site county-level cancer incidence rate was positively associated with poor environmental quality overall (IRD, 38.55; 95% CI, 29.57-47.53) and for male (IRD, 32.60; 95% CI, 16.28-48.91) and female (IRD, 30.34; 95% CI, 20.47-40.21) subjects, indicating a potential increase in cancer incidence with decreasing environmental quality. Rural/urban stratified models demonstrated positive associations comparing the highest with the lowest quintiles for all strata, except the thinly populated/rural stratum and in the metropolitan/urbanized stratum. Prostate and breast cancer demonstrated the strongest positive associations with poor environmental quality.
Conclusion: We observed strong positive associations between the EQI and all-site cancer incidence rates, and associations differed by rural/urban status and environmental domain. Research focusing on single environmental exposures in cancer development may not address the broader environmental context in which cancers develop, and future research should address cumulative environmental exposures. Cancer 2017;123:2901-8. © 2017 American Cancer Society.
Keywords: air; all-site cancer; built; cumulative environmental exposures; land; sociodemographic; water.
© 2017 American Cancer Society.
Conflict of interest statement
Figures


Comment in
-
Impact of the environment on cancer: Seeing the forest for the trees.Cancer. 2017 Aug 1;123(15):2796-2797. doi: 10.1002/cncr.30711. Epub 2017 May 8. Cancer. 2017. PMID: 28480560 No abstract available.
References
-
- Siegel R, Naishadham D, Jemal A. Cancer statistics, 2013. CA Cancer J Clin. 2014 Jan;63(1):11–30. - PubMed
-
- National Heart L, and Blood Institute. Fact book: fiscal year 2008. National Institues of Health; 2009.
MeSH terms
Grants and funding
LinkOut - more resources
Full Text Sources
Other Literature Sources
Medical

