

Integrated continuous bioprocessing: Economic, operational, and environmental feasibility for clinical and commercial antibody manufacture
- PMID: 28480535
- PMCID: PMC5575510
- DOI: 10.1002/btpr.2492
Integrated continuous bioprocessing: Economic, operational, and environmental feasibility for clinical and commercial antibody manufacture
Abstract
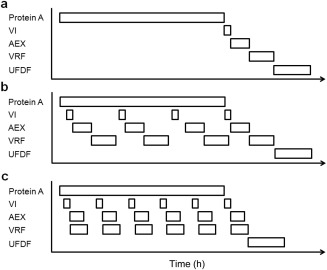
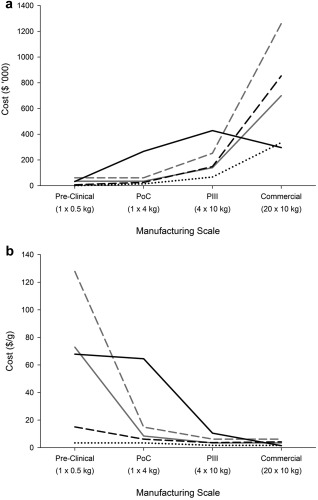
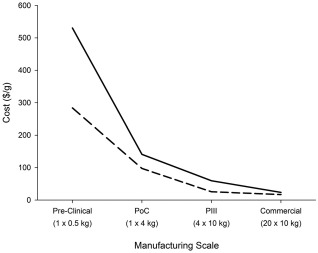
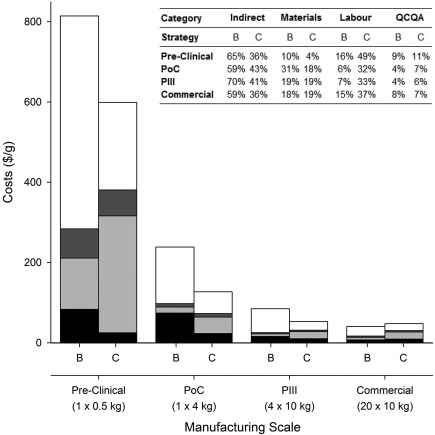
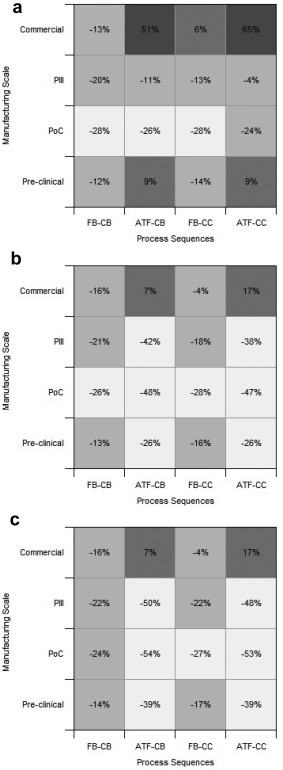
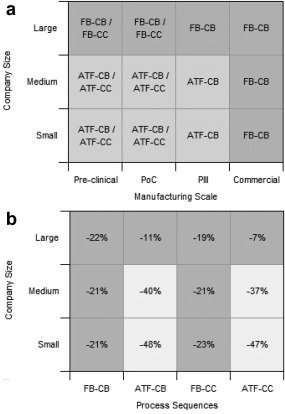
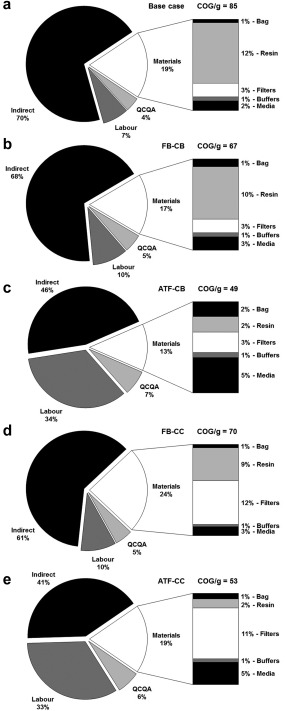
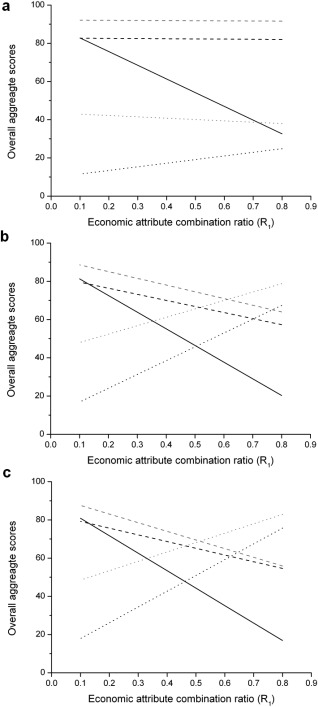
This paper presents a systems approach to evaluating the potential of integrated continuous bioprocessing for monoclonal antibody (mAb) manufacture across a product's lifecycle from preclinical to commercial manufacture. The economic, operational, and environmental feasibility of alternative continuous manufacturing strategies were evaluated holistically using a prototype UCL decisional tool that integrated process economics, discrete-event simulation, environmental impact analysis, operational risk analysis, and multiattribute decision-making. The case study focused on comparing whole bioprocesses that used either batch, continuous or a hybrid combination of batch and continuous technologies for cell culture, capture chromatography, and polishing chromatography steps. The cost of goods per gram (COG/g), E-factor, and operational risk scores of each strategy were established across a matrix of scenarios with differing combinations of clinical development phase and company portfolio size. The tool outputs predict that the optimal strategy for early phase production and small/medium-sized companies is the integrated continuous strategy (alternating tangential flow filtration (ATF) perfusion, continuous capture, continuous polishing). However, the top ranking strategy changes for commercial production and companies with large portfolios to the hybrid strategy with fed-batch culture, continuous capture and batch polishing from a COG/g perspective. The multiattribute decision-making analysis highlighted that if the operational feasibility was considered more important than the economic benefits, the hybrid strategy would be preferred for all company scales. Further considerations outside the scope of this work include the process development costs required to adopt continuous processing. © 2017 The Authors Biotechnology Progress published by Wiley Periodicals, Inc. on behalf of American Institute of Chemical Engineers Biotechnol. Prog., 33:854-866, 2017.
Keywords: antibody manufacture; continuous chromatography; fed-batch; perfusion culture; process economics.
© 2017 The Authors Biotechnology Progress published by Wiley Periodicals, Inc. on behalf of American Institute of Chemical Engineers.
Figures
Similar articles
-
Fed-batch and perfusion culture processes: economic, environmental, and operational feasibility under uncertainty.Biotechnol Bioeng. 2013 Jan;110(1):206-19. doi: 10.1002/bit.24608. Epub 2012 Aug 6. Biotechnol Bioeng. 2013. PMID: 22806692
-
End-to-end continuous bioprocessing: Impact on facility design, cost of goods, and cost of development for monoclonal antibodies.Biotechnol Bioeng. 2021 Sep;118(9):3468-3485. doi: 10.1002/bit.27774. Epub 2021 May 5. Biotechnol Bioeng. 2021. PMID: 33792918
-
Optimising the design and operation of semi-continuous affinity chromatography for clinical and commercial manufacture.J Chromatogr A. 2013 Apr 5;1284:17-27. doi: 10.1016/j.chroma.2013.01.082. Epub 2013 Jan 25. J Chromatogr A. 2013. PMID: 23453463
-
Continuous counter-current chromatography for capture and polishing steps in biopharmaceutical production.Biotechnol J. 2016 Sep;11(9):1126-41. doi: 10.1002/biot.201500354. Epub 2016 Jul 4. Biotechnol J. 2016. PMID: 27376629 Review.
-
Process economics of industrial monoclonal antibody manufacture.J Chromatogr B Analyt Technol Biomed Life Sci. 2007 Mar 15;848(1):8-18. doi: 10.1016/j.jchromb.2006.07.037. Epub 2006 Aug 8. J Chromatogr B Analyt Technol Biomed Life Sci. 2007. PMID: 16899415 Review.
Cited by
-
Purification of plant-derived anti-virus mAb through optimized pH conditions for coupling between protein A and epoxy-activated beads.PeerJ. 2019 May 21;7:e6828. doi: 10.7717/peerj.6828. eCollection 2019. PeerJ. 2019. PMID: 31149395 Free PMC article.
-
Surrogate-based Optimization of Capture Chromatography Platforms for the Improvement of Computational Efficiency.Comput Chem Eng. 2023 May;173:108225. doi: 10.1016/j.compchemeng.2023.108225. Epub 2023 Mar 16. Comput Chem Eng. 2023. PMID: 37064815 Free PMC article.
-
Process Analytical Technologies and Data Analytics for the Manufacture of Monoclonal Antibodies.Trends Biotechnol. 2020 Oct;38(10):1169-1186. doi: 10.1016/j.tibtech.2020.07.004. Epub 2020 Aug 21. Trends Biotechnol. 2020. PMID: 32839030 Free PMC article. Review.
-
Streamlined Clarification and Capture Process for Monoclonal Antibodies Using Fluidized Bed Centrifugation and Multi-Column Chromatography With Membrane Adsorbers.Biotechnol Bioeng. 2025 Feb;122(2):382-394. doi: 10.1002/bit.28884. Epub 2024 Nov 18. Biotechnol Bioeng. 2025. PMID: 39558619 Free PMC article.
-
Adaptation of Aglycosylated Monoclonal Antibodies for Improved Production in Komagataella phaffii.Biotechnol Bioeng. 2025 Feb;122(2):361-372. doi: 10.1002/bit.28878. Epub 2024 Nov 14. Biotechnol Bioeng. 2025. PMID: 39543843 Free PMC article.
References
-
- DiMasi JA, Feldman L, Seckler A, Wilson A. Trends in risks associated with new drug development: success rates for investigational drugs. Clin Pharmacol Therap. 2010;87:272–277. - PubMed
-
- Farid SS. Process economics drivers in industrial monoclonal antibody manufacture In: Gottschalk U, editor. Process Scale Purification of Antibodies: Hoboken, NJ, USA: John Wiley & Sons, Inc; 2009;239–262.
-
- Morgan S, Grootendorst P, Lexchin J, Cunningham C, Greyson D. The cost of drug development: a systematic review. Health Policy. 2011;100:4–17. - PubMed
-
- Paul SM, Mytelka DS, Dunwiddie CT, Persinger CC, Munos BH, Lindborg SR, Schacht AL. How to improve R&D productivity: the pharmaceutical industry's grand challenge. Nat Rev Drug Discov. 2010;9:203–214. - PubMed
-
- Bogdan B, Villiger R. 2010. Valuation in Life Sciences. Valuation in Life Sciences: A Practical Guide, Third Edition:67–303.
MeSH terms
Substances
LinkOut - more resources
Full Text Sources
Other Literature Sources
