

Selective Photomechanical Detachment and Retrieval of Divided Sister Cells from Enclosed Microfluidics for Downstream Analyses
- PMID: 28480715
- PMCID: PMC9558424
- DOI: 10.1021/acsnano.7b00413
Selective Photomechanical Detachment and Retrieval of Divided Sister Cells from Enclosed Microfluidics for Downstream Analyses
Abstract
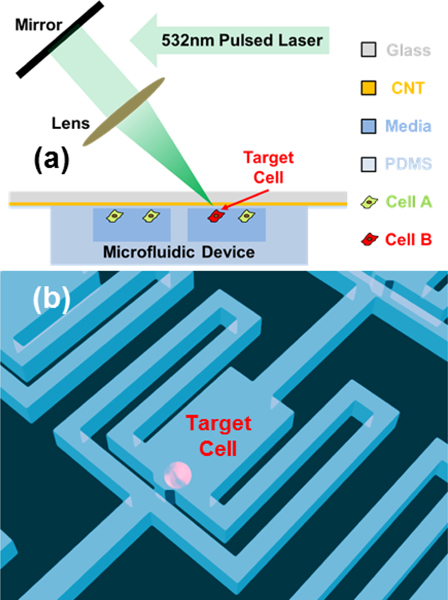
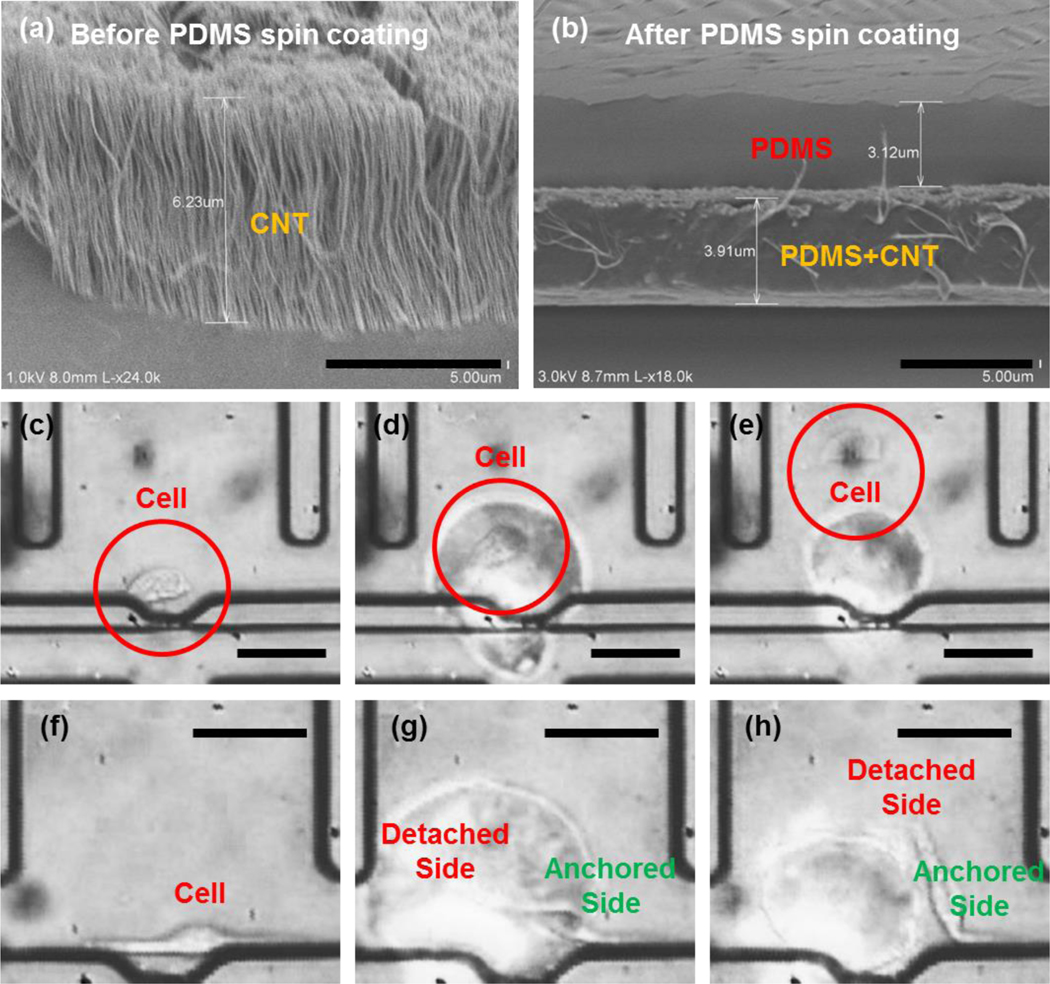
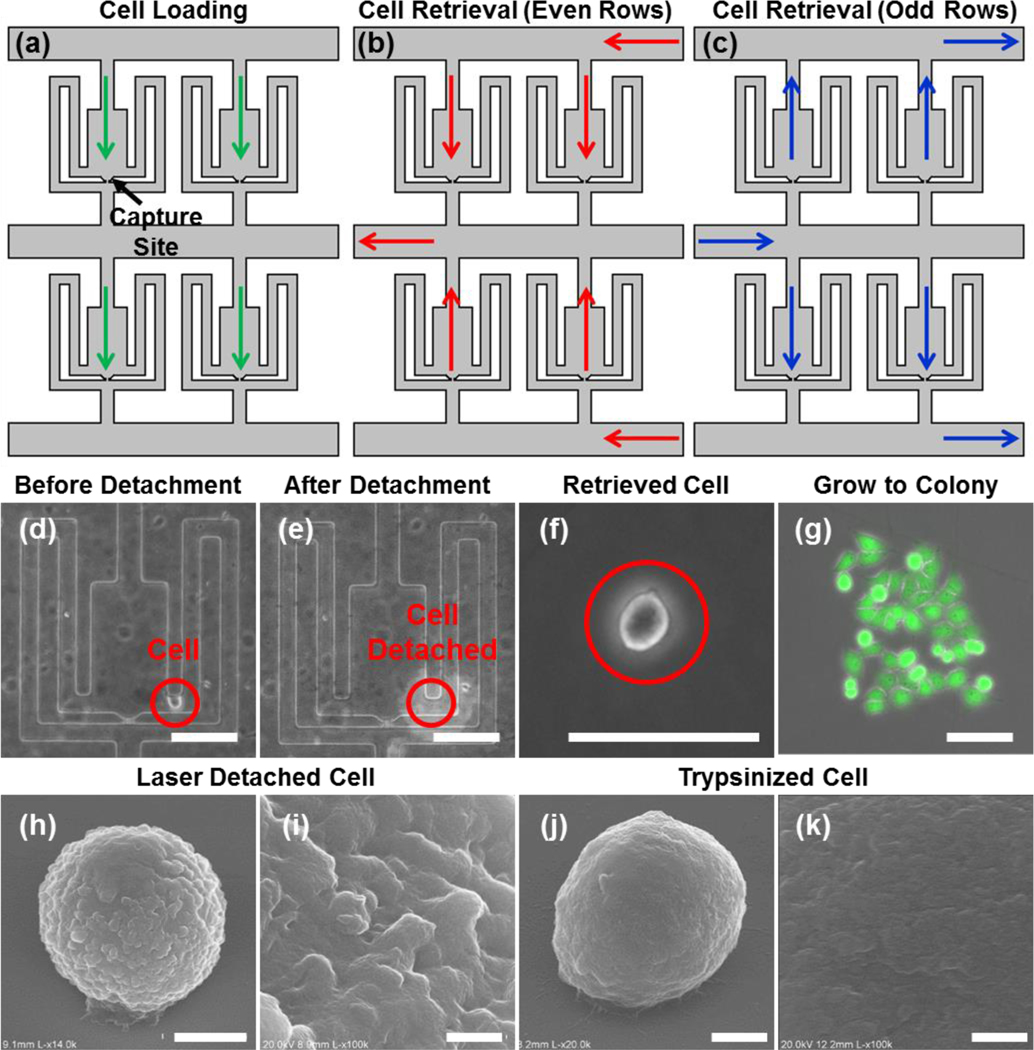
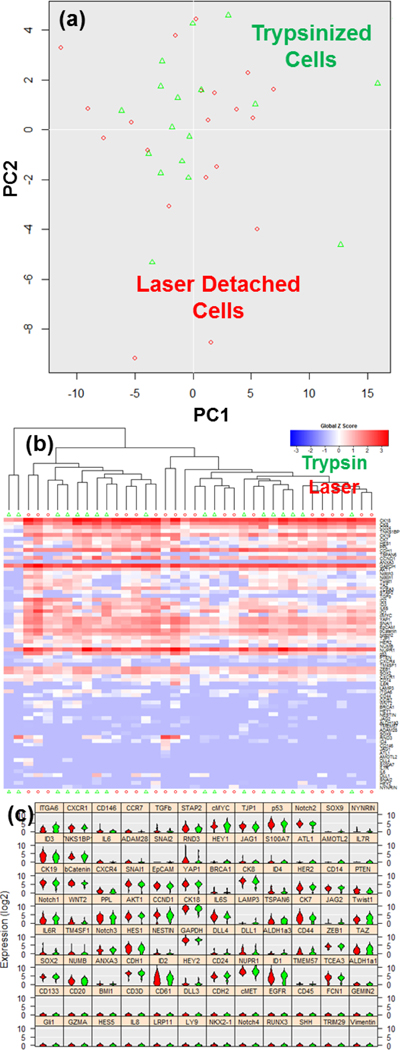
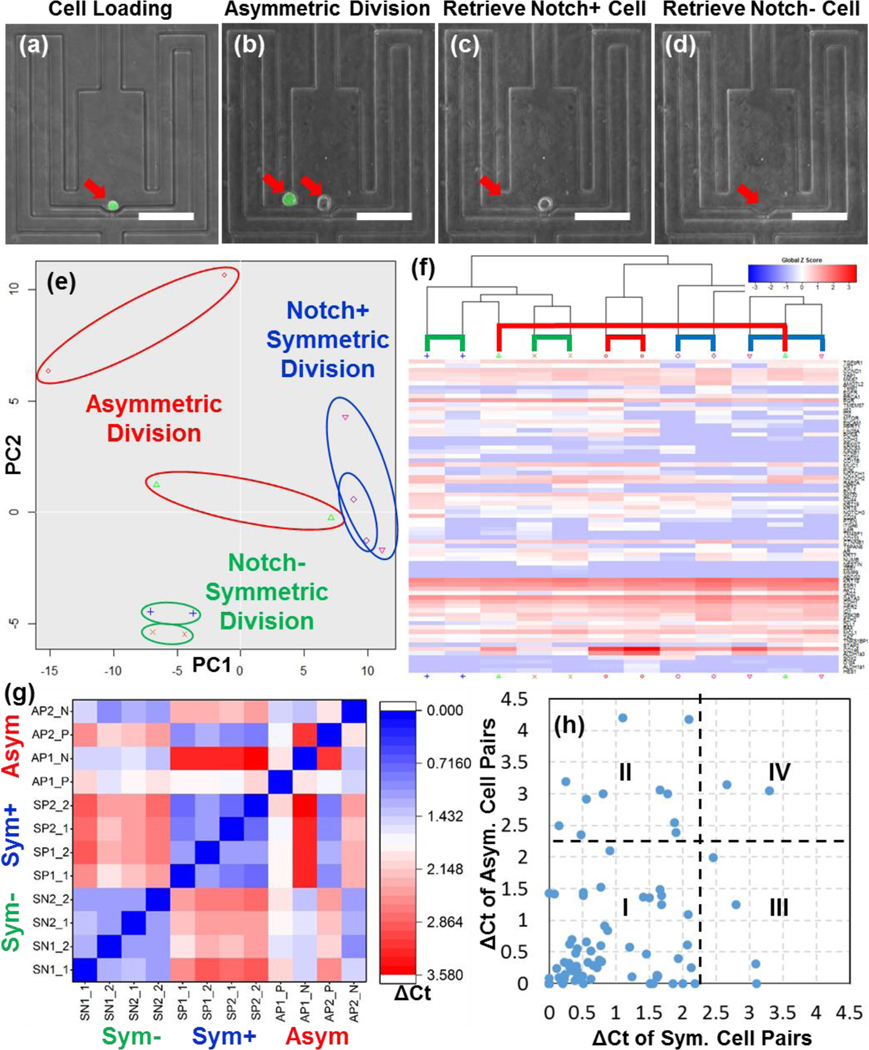
Considerable evidence suggests that self-renewal and differentiation of cancer stem-like cells, a key cell population in tumorgenesis, can determine the outcome of disease. Though the development of microfluidics has enhanced the study of cellular lineage, it remains challenging to retrieve sister cells separately inside enclosed microfluidics for further analyses. In this work, we developed a photomechanical method to selectively detach and reliably retrieve target cells from enclosed microfluidic chambers. Cells cultured on carbon nanotube-polydimethylsiloxane composite surfaces can be detached using shear force induced through irradiation of a nanosecond-pulsed laser. This retrieval process has been verified to preserve cell viability, membrane proteins, and mRNA expression levels. Using the presented method, we have successfully performed 96-plex single-cell transcriptome analysis on sister cells in order to identify the genes altered during self-renewal and differentiation, demonstrating phenomenal resolution in the study of cellular lineage.
Keywords: carbon nanotube; cell detachment; cell retrieval; microfluidics; photoacoustics; single-cell transcriptome analysis.
Figures
Similar articles
-
Microfluidic Platform for Parallel Single Cell Analysis for Diagnostic Applications.Methods Mol Biol. 2017;1547:187-209. doi: 10.1007/978-1-4939-6734-6_15. Methods Mol Biol. 2017. PMID: 28044297
-
Advancing Point-of-Care Applications with Droplet Microfluidics: From Single-Cell to Multicellular Analysis.Annu Rev Biomed Eng. 2024 Jul;26(1):119-139. doi: 10.1146/annurev-bioeng-110222-102142. Epub 2024 Jun 20. Annu Rev Biomed Eng. 2024. PMID: 38316063 Review.
-
Recent developments in microfluidics for cell studies.Adv Mater. 2014 Aug 20;26(31):5525-32. doi: 10.1002/adma.201305348. Epub 2014 Feb 17. Adv Mater. 2014. PMID: 24536032 Review.
-
Microfluidic Sample Preparation for Multiplexed Single-Cell Proteomics Using a Nested Nanowell Chip.Methods Mol Biol. 2024;2823:141-154. doi: 10.1007/978-1-0716-3922-1_10. Methods Mol Biol. 2024. PMID: 39052219
-
Cell-Based Assays on Microfluidics for Drug Screening.ACS Sens. 2019 Jun 28;4(6):1465-1475. doi: 10.1021/acssensors.9b00479. Epub 2019 May 17. ACS Sens. 2019. PMID: 31074263
Cited by
-
Advances in Single-Cell Techniques for Linking Phenotypes to Genotypes.Cancer Heterog Plast. 2024;1(1):0004. doi: 10.47248/chp2401010004. Epub 2024 Jul 25. Cancer Heterog Plast. 2024. PMID: 39156821 Free PMC article.
-
Nanopipettes as Monitoring Probes for the Single Living Cell: State of the Art and Future Directions in Molecular Biology.Cells. 2018 Jun 6;7(6):55. doi: 10.3390/cells7060055. Cells. 2018. PMID: 29882813 Free PMC article. Review.
-
Differential detachment of intact and viable cells of different sizes using laser-induced microbubbles.Biomed Opt Express. 2019 Sep 4;10(10):4919-4930. doi: 10.1364/BOE.10.004919. eCollection 2019 Oct 1. Biomed Opt Express. 2019. PMID: 31646019 Free PMC article.
-
Recent Advancements in Ultrasound Transducer: From Material Strategies to Biomedical Applications.BME Front. 2022 May 11;2022:9764501. doi: 10.34133/2022/9764501. eCollection 2022. BME Front. 2022. PMID: 37850168 Free PMC article. Review.
-
Modeling heterogeneous signaling dynamics of macrophages reveals principles of information transmission in stimulus responses.Nat Commun. 2025 Jul 1;16(1):5986. doi: 10.1038/s41467-025-60901-3. Nat Commun. 2025. PMID: 40593748 Free PMC article.
References
-
- Reya T, Morrison SJ, Clarke MF & Weissman IL Stem Cells, Cancer, and Cancer Stem Cells. Nature. 2001, 414, 105–111. - PubMed
-
- Maitland NJ & Collins AT Prostate Cancer Stem Cells: a New Target for Therapy. J Clin Oncol. 2008, 26, 2862–2870. - PubMed
-
- O’Brien CA, Kreso A. & Jamieson CH Cancer Stem Cells and Self-Renewal. Clin Cancer Res. 2010, 16, 3113–3120. - PubMed
Publication types
MeSH terms
Grants and funding
LinkOut - more resources
Full Text Sources
Other Literature Sources
