. 2017 May 8:8:15134.
doi: 10.1038/ncomms15134.

Intron retention is regulated by altered MeCP2-mediated splicing factor recruitment

Affiliations

Intron retention is regulated by altered MeCP2-mediated splicing factor recruitment

Justin J-L Wong et al. Nat Commun. .

Abstract

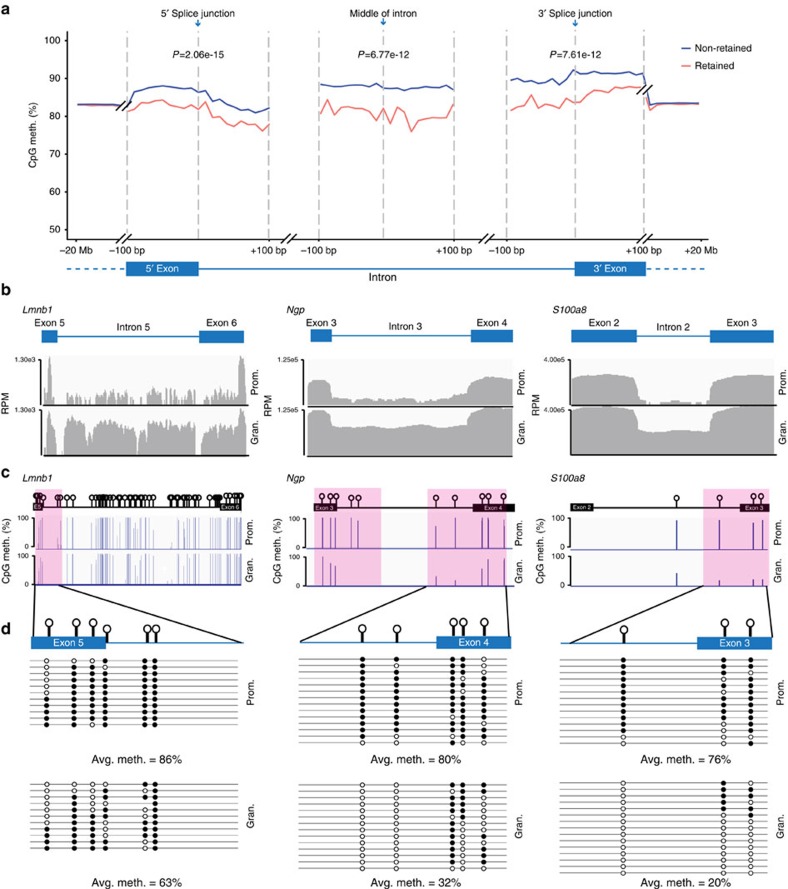
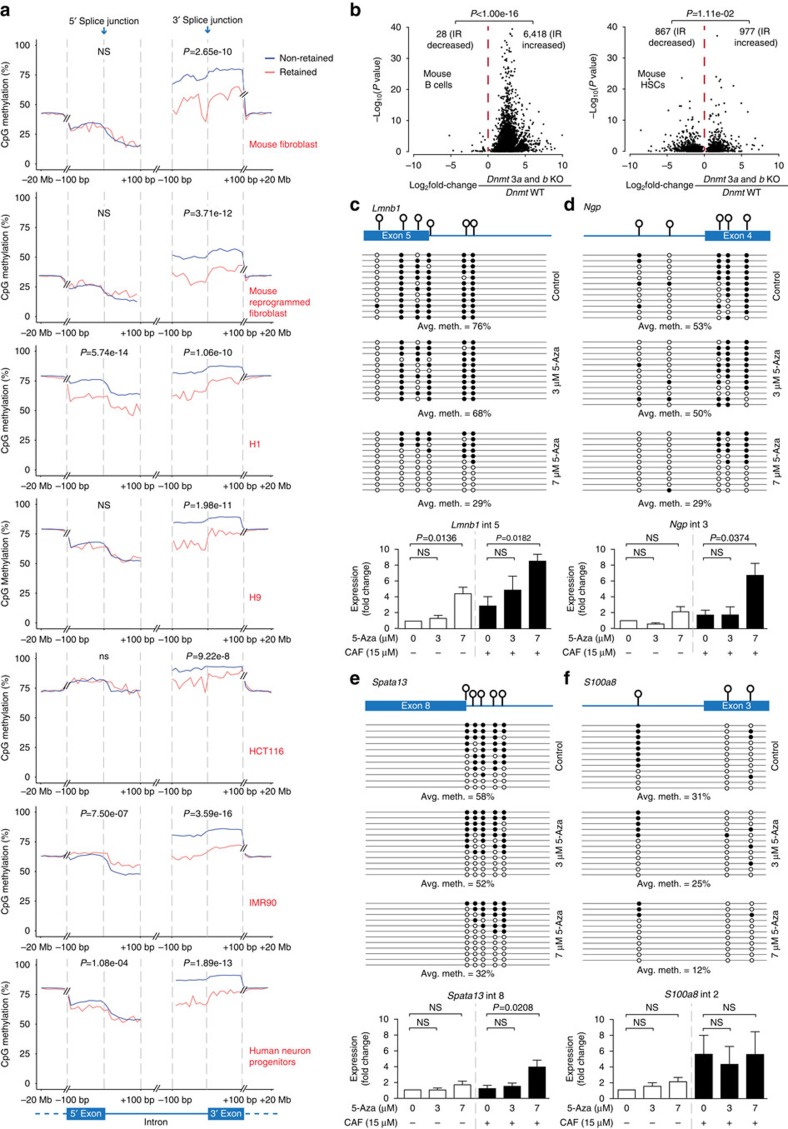
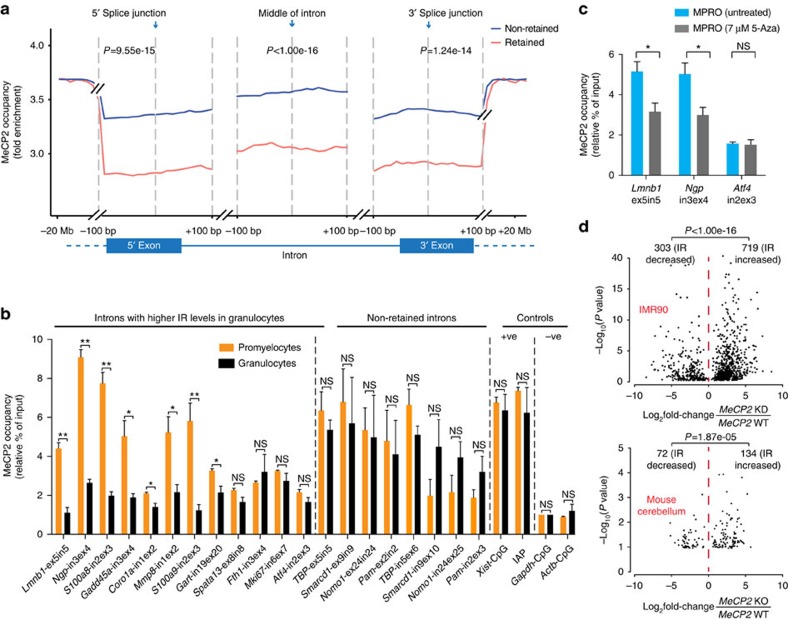
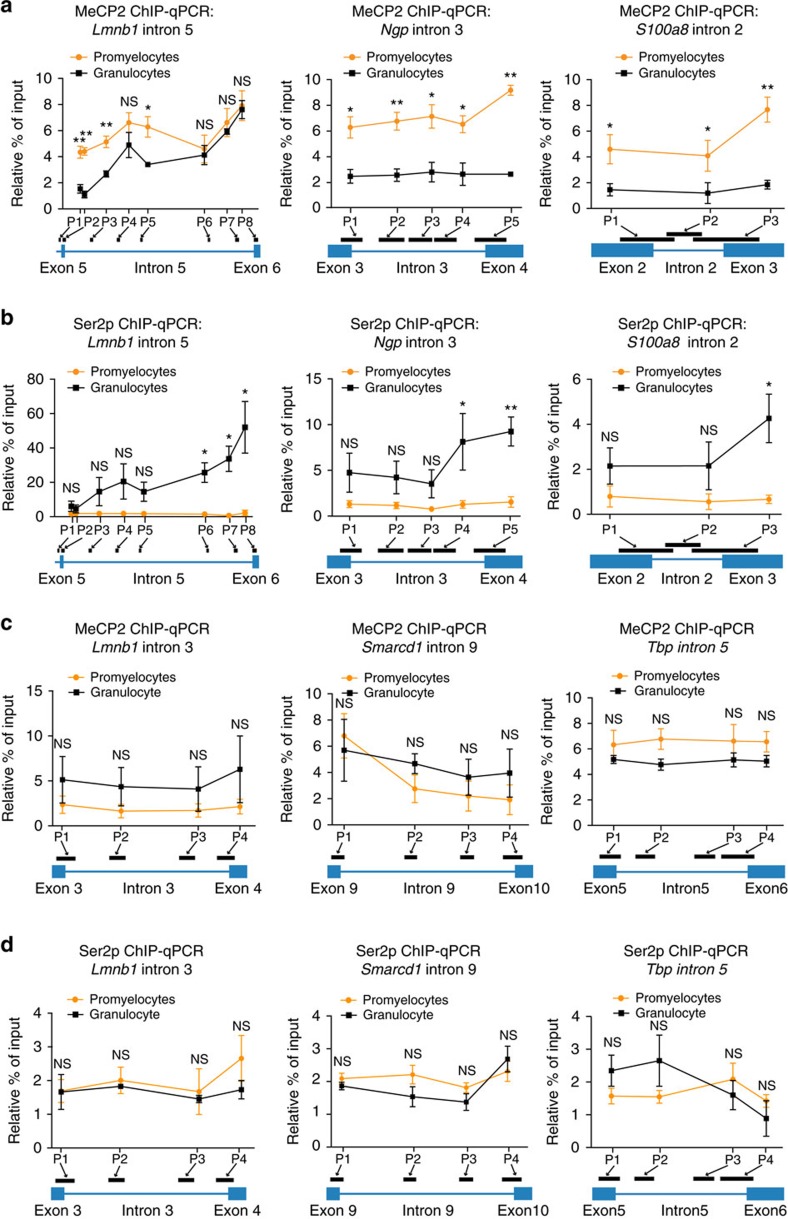
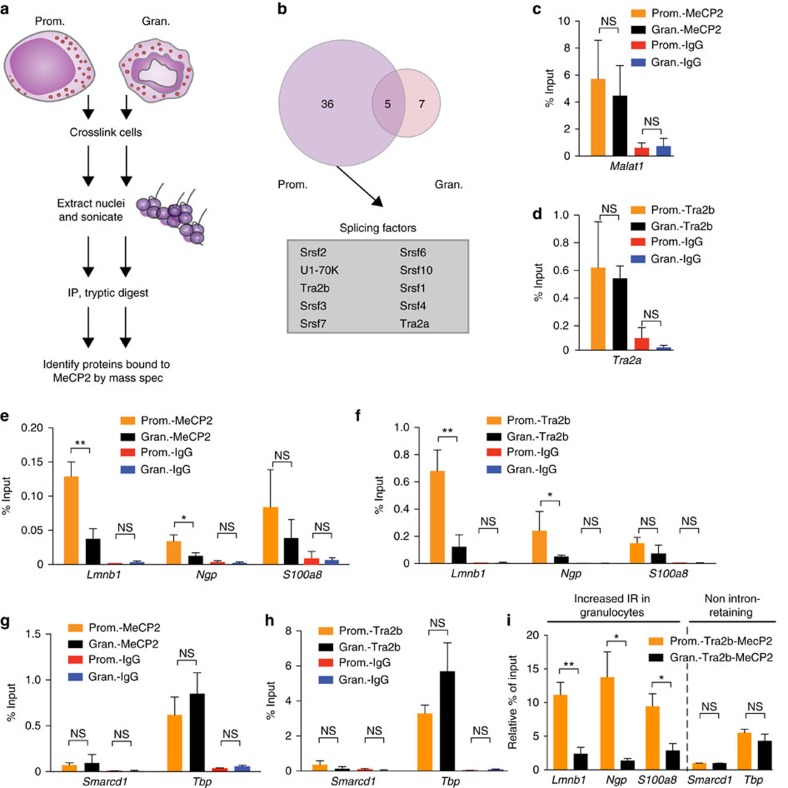
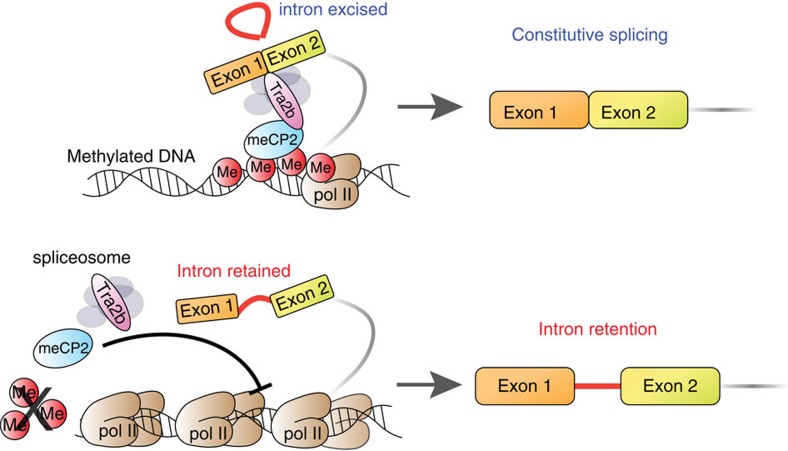
While intron retention (IR) is considered a widely conserved and distinct mechanism of gene expression control, its regulation is poorly understood. Here we show that DNA methylation directly regulates IR. We also find reduced occupancy of MeCP2 near the splice junctions of retained introns, mirroring the reduced DNA methylation at these sites. Accordingly, MeCP2 depletion in tissues and cells enhances IR. By analysing the MeCP2 interactome using mass spectrometry and RNA co-precipitation, we demonstrate that decreased MeCP2 binding near splice junctions facilitates IR via reduced recruitment of splicing factors, including Tra2b, and increased RNA polymerase II stalling. These results suggest an association between IR and a slower rate of transcription elongation, which reflects inefficient splicing factor recruitment. In summary, our results reinforce the interdependency between alternative splicing involving IR and epigenetic controls of gene expression.


Conflict of interest statement

The authors declare no competing financial interests.

Figures

Figure 1
Figure 1. IR in myeloid cells is associated with lower DNA methylation levels near splice junctions and within retained introns.
(a) Average CpG methylation (CpG meth.) levels spanning ±100 bp from the 5′ and 3′ splice junctions, and from the middle of introns, in the DNA encoding non-retained (blue) and retained (red) introns in promyelocytes and granulocytes combined. Data were extended to −20 Mb and +20 Mb from the 5′ and 3′ splice junction respectively. t-test was used to determine significance at P<0.05. (b) Examples from the IGV genome browser comparing IR levels in Lmnb1 intron 5, Ngp intron 3 and S100a8 intron 2 in promyelocytes (Prom.) and granulocytes (Gran.). (c) Average DNA methylation level at each CpG across Lmnb1 intron 5, Ngp intron 3 and S100a8 intron 2 and their flanking exons in promyelocytes and granulocytes as assessed using whole-genome bisulfite sequencing. A ±100 bp region from each splice junction, with reduced DNA methylation in granulocytes, is shaded in pink. (d) Confirmation of the results in c using clonal bisulfite sequencing. Each row represents a single-cloned PCR amplicon aligned to the exon–intron map shown above. Lollipops on exon–intron map indicate positions of CpG sites. Circles denote methylated (black) and unmethylated (white) CpGs. NS, not significant; Avg. meth., average DNA methylation levels.
Figure 2
Figure 2. IR increases with reduced DNA methylation and increases following DNA methylation inhibition.
(a) Average CpG methylation levels spanning ±100 bp from the 5′ and 3′ splice junctions in the DNA encoding non-retained (blue) and retained (red) introns in primary mouse fibroblasts, mouse reprogrammed fibroblasts, human cell lines (H1, H9, HCT116 and IMR90) and primary human neuron progenitors. Data were extended to −20 Mb and +20 Mb from the 5′ and 3′ splice junctions, respectively. Paired t-tests were used to determine significance at P<0.05. (b) Association between the IR ratio fold changes and their significance following double knockout of Dnmt3a and 3b in primary mouse B cells and HSCs. Binomial test was used to determine the significance of bias between increased and decreased IR at P<0.05. (cf) Upper panel: clonal bisulfite sequencing displaying DNA methylation changes near splice junctions of Lmnb1 intron 5, Ngp intron 3, Spata13 intron 8 and S100a8 intron 2 in MPRO cells following treatment with 3 or 7 μM 5-aza-2′deoxycytidine (5-Aza). Each row represents a single-cloned PCR amplicon aligned to the exon–intron map shown. Each lollipop on the map represents a CpG site. Black and white circles denote methylated and unmethylated CpGs respectively. Lower panel: IR levels determined by qRT-PCR for specific introns indicated in MPRO cells, with and without exposure to 5-Aza at 3 or 7 μM, and in the absence (–) or presence (+) of NMD inhibition via caffeine (CAF) treatment. Two-tailed t-test was used to determine significance at P<0.05. Bars display mean±s.e.m. Independent qRT-PCR experiments were performed three times in triplicate (n=3). NS, not significant; Avg. meth., average DNA methylation levels.
Figure 3
Figure 3. IR is associated with reduced MeCP2 binding near splice junctions.
(a) Average MeCP2 occupancy normalized against input as measured by ChIP-seq in promyelocytes and granulocytes combined. MeCP2 occupancy is displayed for regions spanning ±100 bp from the 5′ and 3′ splice junctions, and the middle of introns, in the DNA encoding non-retained (blue) and retained introns (red). Data were extended to −20 Mb and +20 Mb from the 5′ and 3′ splice junction respectively. t-tests were used to determine significance at P<0.05. (b) Occupancy of MeCP2 near splice junctions of the DNA encoding introns with increased IR in granulocytes and controls measured by ChIP-qPCR. (c) ChIP-qPCR-measured occupancy of MeCP2 near splice junctions of the DNA encoding differentially retained introns of Lmnb1 and Ngp pre- and post- 5-Aza-2′deoxycytidine treatment (5-Aza) in MPRO cells. Atf4 intron 2 is included as a negative control. (d) Association between IR ratio fold changes and their significance following Mecp2 knockdown in IMR90 cells or Mecp2- knockout in primary mouse cerebellum. Binomial test was used to determine the significance of bias between increased and decreased IR at P<0.05. For each ChIP-qPCR experiment, a two-tailed Student's t-test was used to determine significance, denoted by *P<0.05, **P<0.001 and ns, not significant. Bars display mean±s.e.m. Independent ChIP-qPCR experiments were performed three to five times in triplicate.
Figure 4
Figure 4. IR is associated with increased RNA Pol II occupancy that anti-correlates with MeCP2 density.
(a) Occupancies of MeCP2 and (b) Pol II Ser2p measured by ChIP-qPCR for retained introns and their flanking exons of Lmnb1, Ngp and S100a8 in promyelocytes and granulocytes. (c) ChIP-qPCR analyses of MeCP2 and (d) Pol II Ser2p occupancies measured for non-retained introns: Lmnb1 intron 3, Smarcd1 intron 9, Tbp intron 5 and their flanking exons. P1–P8 indicate positions of PCR amplicons within each region. For each ChIP-qPCR experiment, a two-tailed Student's t-test was used to determine significance, denoted by *P<0.05, **P<0.001 and NS, not significant. Dots and bars display mean±s.e.m. Independent ChIP-qPCR experiments were performed three to five times in triplicate.
Figure 5
Figure 5. Reduced MeCP2-mediated recruitment of the splicing factor Tra2b promotes IR.
(a) Schematic of the RIME assay to identify MeCP2 binding partners in normal promyelocytes (Prom.) and granulocytes (Gran.). (b) Venn diagram showing proteins that bind to MeCP2 in promyelocytes and/or granulocytes. MeCP2 bound splicing factors enriched in promyelocytes are listed. (c) Occupancies of MeCP2 and (d) Tra2b in the coding region of Malat1 and Tra2a in promyelocytes and granulocytes measured by RNA-IP followed by qRT-PCR. (e) Occupancies of MeCP2 and (f) Tra2b near splice junctions of Lmnb1 intron 5, Ngp intron 3 and S100a8 intron 2 in normal promyelocytes compared to granulocytes by RNA-IP. (g) Occupancies of MeCP2 and (h) Tra2b near splice junctions of constitutively spliced Smarcd1 intron 9 and TBP intron 5 in normal promyelocytes compared to granulocytes by RNA-IP. (i) Occupancies of MeCP2 and Tra2b near splice junctions of Lmnb1 intron 5, Ngp intron 3 and S100a8 intron 2, Smarcd1 intron 9 and TBP intron 5 in normal promyelocytes compared to granulocytes by RNA-IP-reIP. Levels of occupancies are shown relative to background inferred by sequential Tra2b-IgG RNA-IP controls. A two-tailed t-test was used to determine significance, denoted by *P<0.05, **P<0.001 and NS, not significant. Dots and bars display mean±s.e.m. Independent qRT-PCR experiments were performed three to five times in triplicate.
Figure 6
Figure 6. Proposed model of IR regulation.
IR occurs via less efficient splicing factor (e.g. Tra2b) recruitment consequent to reduced DNA-methylation-mediated MeCP2 binding.

Similar articles

Cited by

References

    1. Yap K., Lim Z. Q., Khandelia P., Friedman B. & Makeyev E. V. Coordinated regulation of neuronal mRNA steady-state levels through developmentally controlled intron retention. Genes Dev. 26, 1209–1223 (2012). - PMC - PubMed
    1. Wong J.J.-L. et al.. Orchestrated intron retention regulates normal granulocyte differentiation. Cell 154, 583–595 (2013). - PubMed
    1. Moore M. J., Wang Q., Kennedy C. J. & Silver P. A. An alternative splicing network links cell-cycle control to apoptosis. Cell 142, 625–636 (2010). - PMC - PubMed
    1. Ergun A. et al.. Differential splicing across immune system lineages. Proc. Natl Acad. Sci. USA 110, 14324–14329 (2013). - PMC - PubMed
    1. Shaked I., Zimmerman G. & Soreq H. Stress-induced alternative splicing modulations in brain and periphery. Ann. N. Y. Acad. Sci. 1148, 269–281 (2008). - PubMed

Publication types