. 2017 May 8:8:14743.
doi: 10.1038/ncomms14743.

Preserved cognitive functions with age are determined by domain-dependent shifts in network responsivity

Collaborators, Affiliations

Preserved cognitive functions with age are determined by domain-dependent shifts in network responsivity

Dávid Samu et al. Nat Commun. .

Abstract

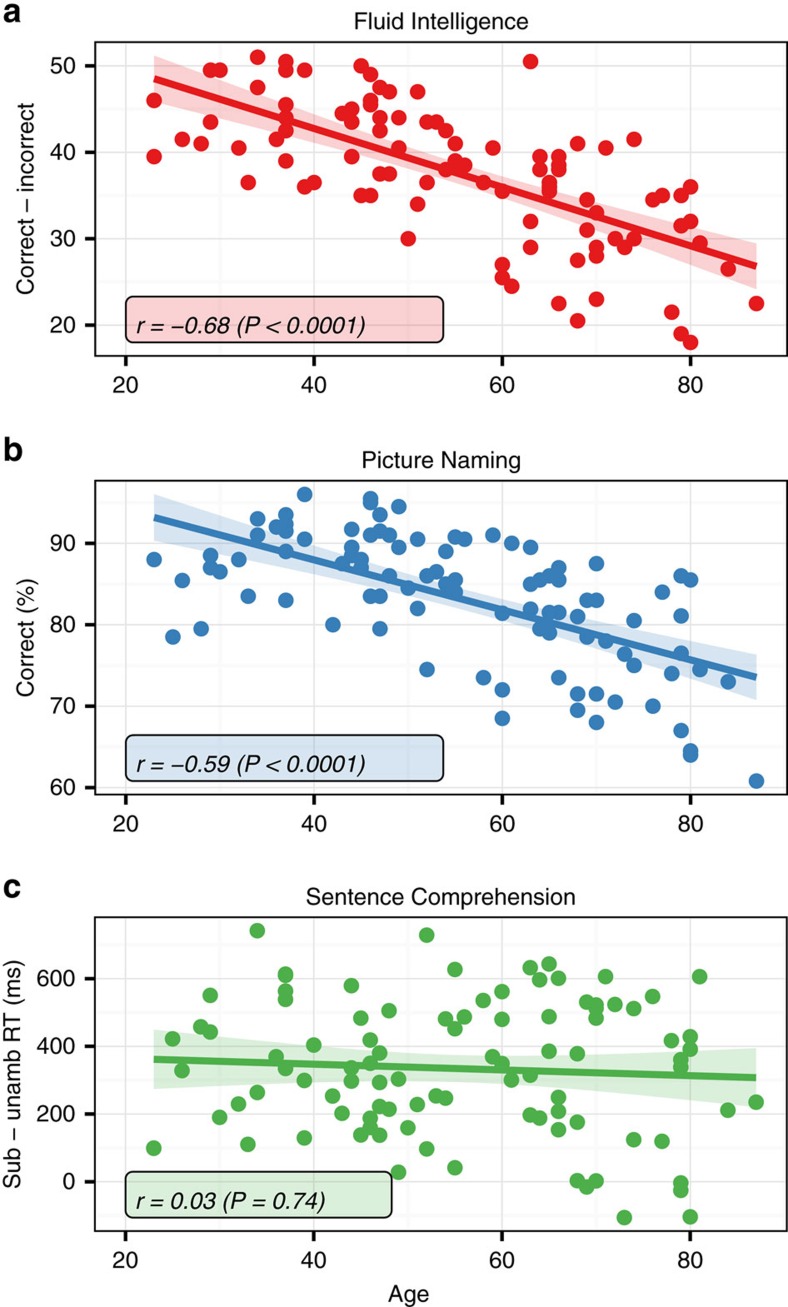
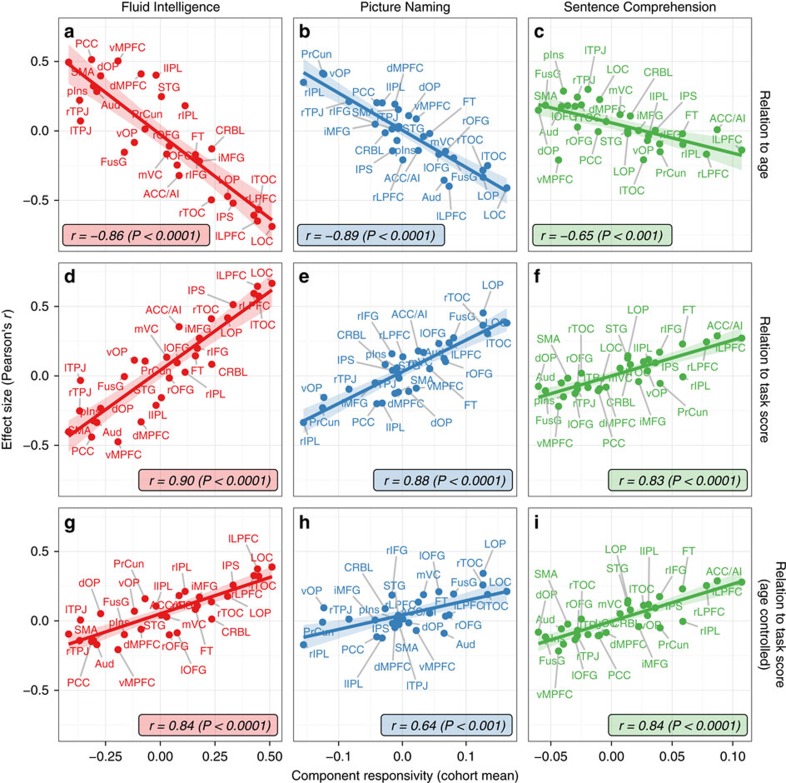
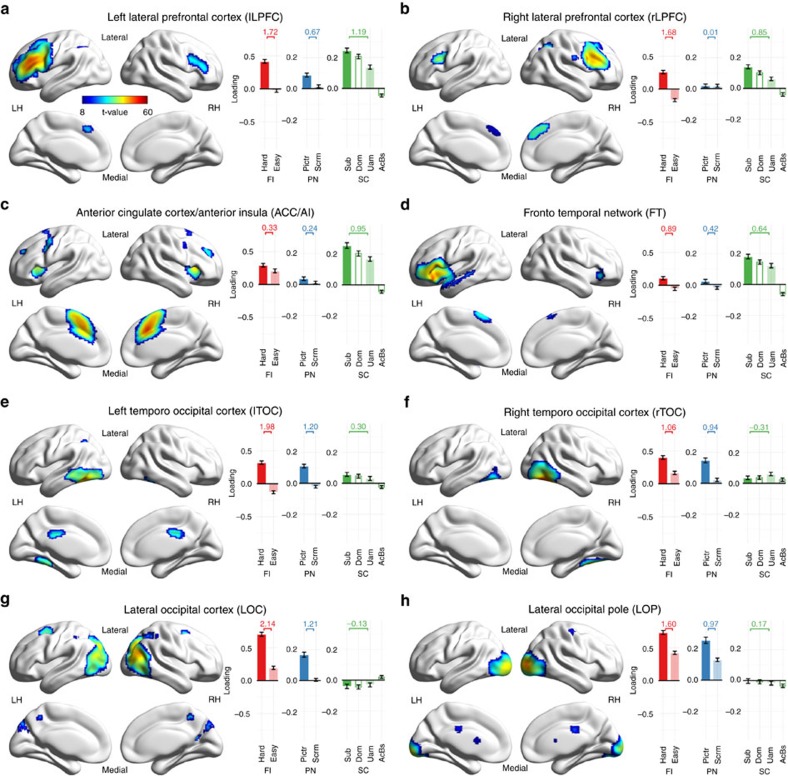
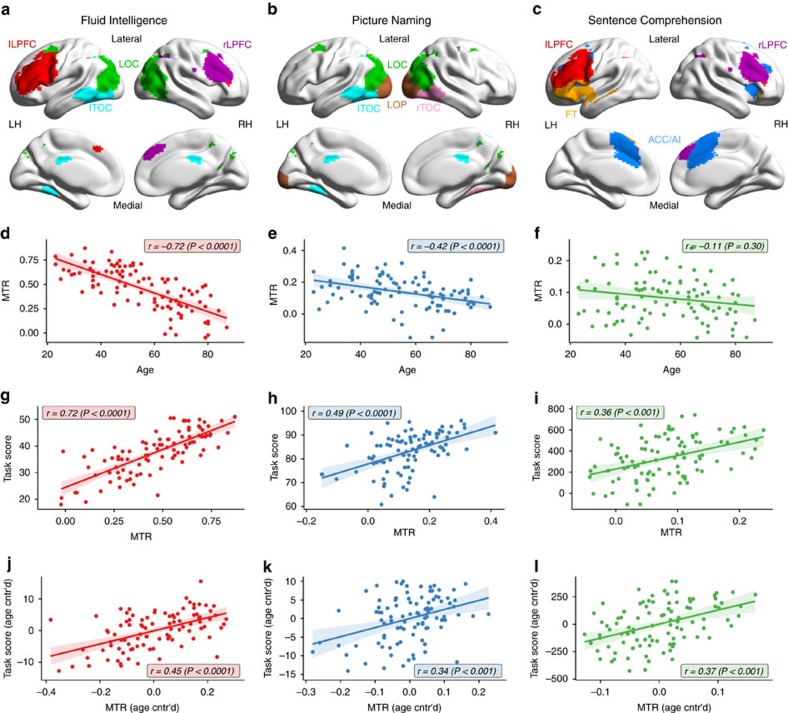
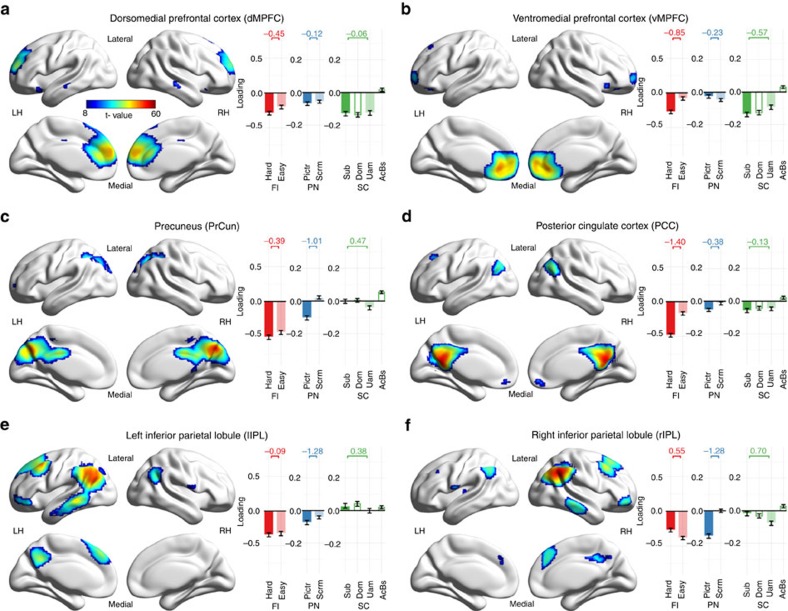
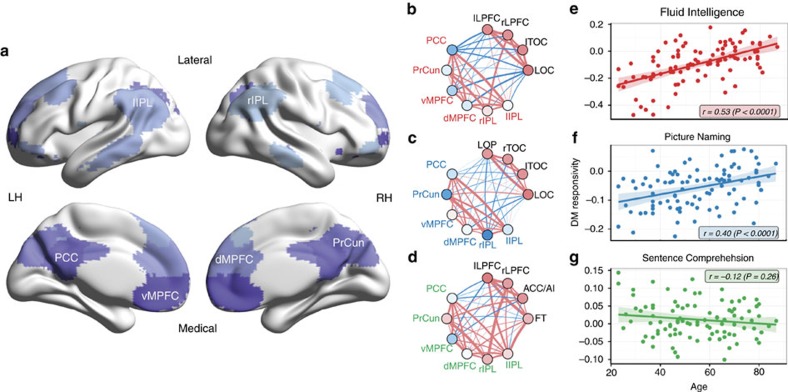
Healthy ageing has disparate effects on different cognitive domains. The neural basis of these differences, however, is largely unknown. We investigated this question by using Independent Components Analysis to obtain functional brain components from 98 healthy participants aged 23-87 years from the population-based Cam-CAN cohort. Participants performed two cognitive tasks that show age-related decrease (fluid intelligence and object naming) and a syntactic comprehension task that shows age-related preservation. We report that activation of task-positive neural components predicts inter-individual differences in performance in each task across the adult lifespan. Furthermore, only the two tasks that show performance declines with age show age-related decreases in task-positive activation of neural components and decreasing default mode (DM) suppression. Our results suggest that distributed, multi-component brain responsivity supports cognition across the adult lifespan, and the maintenance of this, along with maintained DM deactivation, characterizes successful ageing and may explain differential ageing trajectories across cognitive domains.


Conflict of interest statement

The authors declare no competing financial interests.

Figures

Figure 1
Figure 1. Behavioural scores.
Fluid Intelligence (a) and Picture Naming (b) show decline (negative age-related difference) in performance, while Sentence Comprehension score (c) is preserved across the lifespan.
Figure 2
Figure 2. Relation of component responsivity to age and performance.
Cohort-mean component responsivities (x axis) are correlated against three effects on subject-specific responsivity values (y axis, see labels on the right side): relation (correlation) to age (ac), task score (df) and task score when controlling for age (gi). (ac) More responsive components (to the right along x axis) show more age-related decrease in responsivity (more negative values along y axis) especially in the declining tasks. (di) More responsive components are more related to task score in all tasks (second row), largely independently of age-related difference in both responsivity and behaviour (third row). Component labels are given in each panel (see Supplementary Table 2).
Figure 3
Figure 3. Task performance and multiple component responsivity across varying number of components.
For accessibility, correlation between multiple component responsivity (MCR) and task score is shown only up to the n=15 most responsive components in figure (after which correlation continues to decline until the end at n=30 components). Component, from left to right, are in the order of their addition to MCR, denoted by the ‘+' signs (for example, the MCR of Fluid Intelligence at n=4 is the mean responsivity across LOC, lTOC, lLPFC and rLPFC). In each task, MCR optimally predicts task performance at n=4 of the most responsive components. In order to isolate the effect of age and find a canonical (age-independent) set of task-positive components, the figure shows results after controlling for age. The same test without controlling for age, however, yields qualitatively the same results.
Figure 4
Figure 4. Spatial maps and loading values of task-positive components.
(ah) All task positive components combined across the three tasks. Task-positive components of Fluid Intelligence: lLPFC, rLPFC, lTOC and LOC (a,b,e,g); Picture Naming: lTOC, rTOC, LOC and LOP (eh); Syntactic Comprehension: lLPFC, rLPFC, ACC/AI and FT (ad). Spatial maps (on the left) are group-level thresholded t-maps. Bars (and whiskers) on the right denote cohort-mean loading values (±s.e.m.), sorted by task (FI: Fluid Intelligence, PN: Picture Naming, SC: Sentence Comprehension), and higher (dark colour) versus lower (light colour) cognitive load (Hard: hard puzzle, Easy: easy puzzle, Pictr: picture naming, Scrm: scrambled image, Sub: subordinate sentences, Dom: dominant sentences, Uam: unambiguous sentences, AcBs: acoustic baseline). Across-condition effect sizes (mean over SD of condition contrast) are given above the bars. LH/RH: left/right hemisphere.
Figure 5
Figure 5. Relation of task-positive responsivity to age and performance.
Mean task-positive responsivity (MTR) predicts task performance across tasks, but shows age-related decreases only for the cognitively declining tasks. Results are grouped column-wise by task (see task labels on top). (ac) Spatial maps of task-positive components of each task. Voxels are colour coded by corresponding component, see colours of inserted component labels. (dl) Subject-level results per task. Dots correspond to results of individual participants, colour-coded by task (see labels on top). (df) Age-related difference of MTR. (gi) Correlation between MTR and task score. (jl) Correlation between MTR and task score, when controlling for age. LH/RH: left/right hemisphere.
Figure 6
Figure 6. Spatial maps and loading values of default mode components.
(af) The six identified default mode components. Spatial maps (on the left) are group-level thresholded t-maps. Bars (and whiskers) on the right denote cohort-mean loading values (±s.e.m.), sorted by task and higher (dark colour) versus lower (light colour) cognitive load (see Fig. 4 for abbreviations). Across-condition effect sizes (mean over s.d. of condition contrast) are given above the bars. LH/RH: left/right hemisphere.
Figure 7
Figure 7. Responsivity and functional connectivity of default mode components.
Declining tasks involve default mode (DM) suppression, which shows age-related reduction. (a) Spatial maps of DM components. Colour shades represent different components (see inserted component labels). (bd) Mean responsivity and functional connectivity (FC) of task-positive and DM components for each task. Disks represent components, coloured by their mean responsivity in the corresponding task (red: positive, blue: negative). Links represent FC between component pairs, coloured by sign of connectivity (red: positive, blue: negative), and with width proportional to the magnitude (absolute value) of correlation. In every task, both task-positive and DM components are strongly and positively connected among themselves (within group FC), whereas their interconnectivity (between groups FC) is dominantly negative for the declining tasks, but highly mixed for Sentence Comprehension. (eg) Mean DM responsivity in each task as a function of age.

References

    1. Park D. C. et al.. Models of visuospatial and verbal memory across the adult life span. Psychol. Aging 17, 299–320 (2002). - PubMed
    1. Salthouse T. A. Selective review of cognitive aging. J. Int. Neuropsychol. Soc. 16, 754–760 (2010). - PMC - PubMed
    1. Good C. D. et al.. A voxel-based morphometric study of ageing in 465 normal adult human brains. NeuroImage 14, 21–36 (2001). - PubMed
    1. Gunning-Dixon F. M. & Raz N. The cognitive correlates of white matter abnormalities in normal aging: a quantitative review. Neuropsychology 14, 224–232 (2000). - PubMed
    1. Tsvetanov K. A. et al.. The effect of ageing on fMRI: correction for the confounding effects of vascular reactivity evaluated by joint fMRI and MEG in 335 adults: vascular Influences on BOLD signal with ageing. Hum. Brain Mapp. 36, 2248–2269 (2015). - PMC - PubMed

Publication types