. 2017 Aug;38(8):3757-3770.
doi: 10.1002/hbm.23612. Epub 2017 May 8.

Inferring pathobiology from structural MRI in schizophrenia and bipolar disorder: Modeling head motion and neuroanatomical specificity

Affiliations

Inferring pathobiology from structural MRI in schizophrenia and bipolar disorder: Modeling head motion and neuroanatomical specificity

Nailin Yao et al. Hum Brain Mapp. 2017 Aug.

Abstract

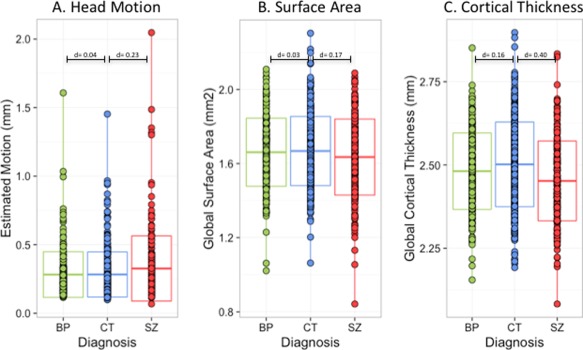
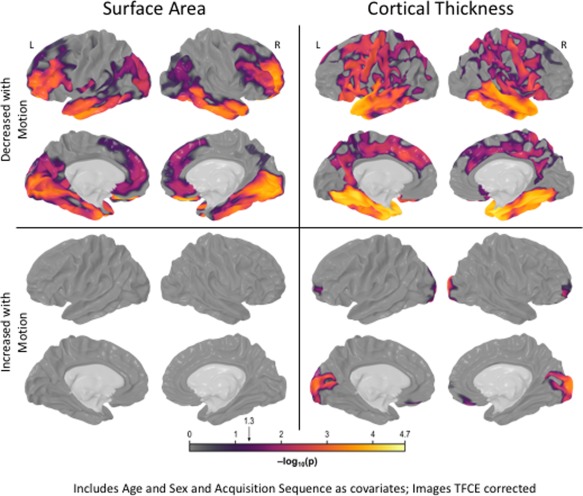
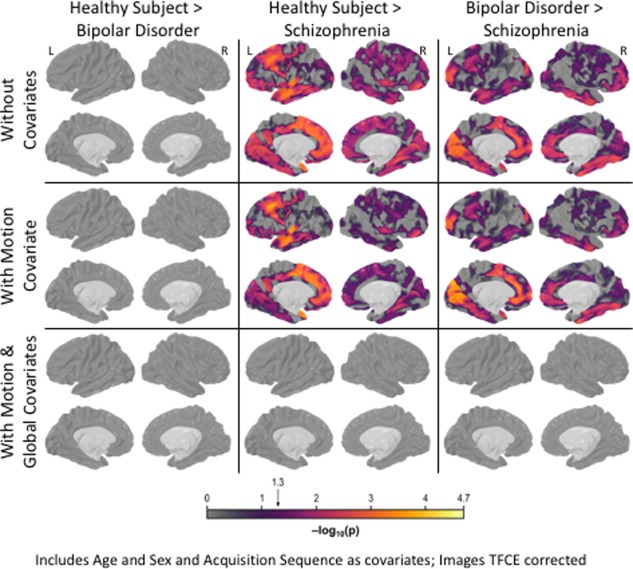
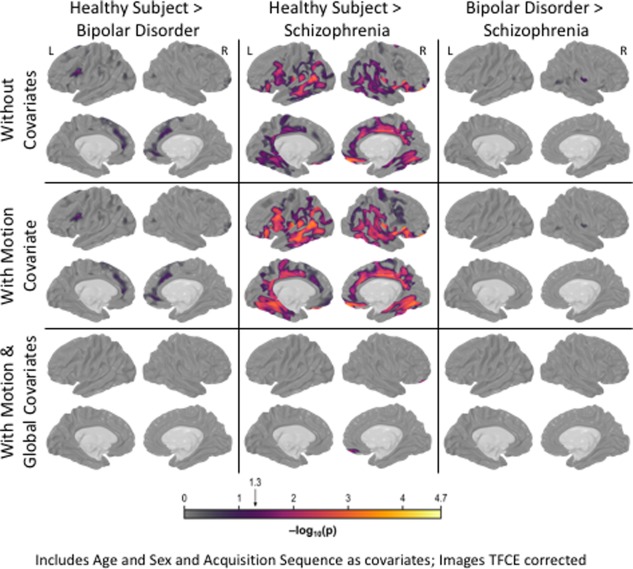
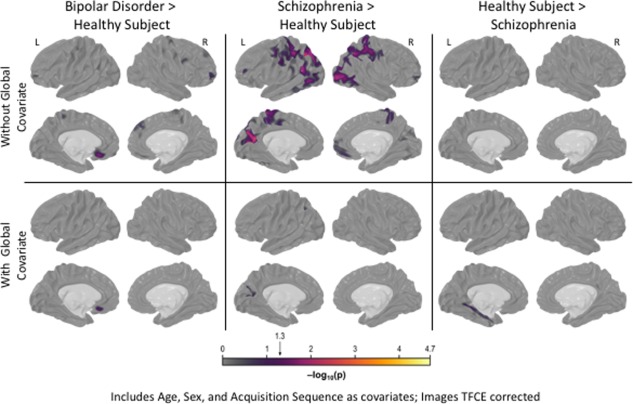
Despite over 400 peer-reviewed structural MRI publications documenting neuroanatomic abnormalities in bipolar disorder and schizophrenia, the confounding effects of head motion and the regional specificity of these defects are unclear. Using a large cohort of individuals scanned on the same research dedicated MRI with broadly similar protocols, we observe reduced cortical thickness indices in both illnesses, though less pronounced in bipolar disorder. While schizophrenia (n = 226) was associated with wide-spread surface area reductions, bipolar disorder (n = 227) and healthy comparison subjects (n = 370) did not differ. We replicate earlier reports that head motion (estimated from time-series data) influences surface area and cortical thickness measurements and demonstrate that motion influences a portion, but not all, of the observed between-group structural differences. Although the effect sizes for these differences were small to medium, when global indices were covaried during vertex-level analyses, between-group effects became nonsignificant. This analysis raises doubts about the regional specificity of structural brain changes, possible in contrast to functional changes, in affective and psychotic illnesses as measured with current imaging technology. Given that both schizophrenia and bipolar disorder showed cortical thickness reductions, but only schizophrenia showed surface area changes, and assuming these measures are influenced by at least partially unique sets of biological factors, then our results could indicate some degree of specificity between bipolar disorder and schizophrenia. Hum Brain Mapp 38:3757-3770, 2017. © 2017 Wiley Periodicals, Inc.

Keywords: bipolar disorder; head motion; neuroanatomic specificity; neuroanatomy; neuroimaging; schizophrenia; structural MRI.


Conflict of interest statement

The authors do not have financial arrangements or conflicts of interest to disclose.

Figures

Figure 1
Figure 1
Head Motion, Global Surface Area and Global Cortical Thickness Distributions by Diagnostic Group. Panel A depicts the distribution of head motion, estimated with a frame‐displacement technique during resting state functional MRI, to be used as a proxy for motion during structural scanning. Individuals with schizophrenia (n = 226) had higher levels of head movement when compared with either individuals with bipolar disorder (n = 227) or healthy volunteers (n = 370). Panel B shows the distribution of the average or global surface area across cortex for the three diagnostic groups. Panel C portrays the distribution of global cortical thickness across cortex for the three diagnostic groups. Individuals with schizophrenia had reduced surface area and cortical thickness compared with other groups. [Color figure can be viewed at http://wileyonlinelibrary.com]
Figure 2
Figure 2
Main Effect of Head Motion on Surface Area and Cortical Thickness Measurments. Across all subjects (n = 823), increased head motion was associated with diffuse decreases in vertex‐level surface area measurements in frontal, temporal, and occipital cortex. Similarly, increased head motion was associated with reduced cortical thickness measurements in frontal, temporal, and parietal cortex, and larger estimated thickness in occipital and anterior prefrontal cortex. Results are strikingly consistent with previously findings. [Color figure can be viewed at http://wileyonlinelibrary.com]
Figure 3
Figure 3
Between‐Group Surface Area Differences. The figure portrays statistically significant between‐group surface area differences for bipolar, schizophrenia and healthy groups. No significant differences were observed when contrasting bipolar disorder and healthy comparison groups, regardless of covariates included. When age, sex and MR sequence were included as covariates, individuals with schizophrenia showed pervasive surface area deficits relative to healthy comparison subjects, particularly in medial and lateral frontal lobes, medial and lateral temporal lobes and superior parietal cortex (top row). These group level differences remained, thought became more concentrated, when estimated head motion was included with other covariates (middle row). However, schizophrenia‐healthy differences were no longer significate when global surface area was included with all prior covariates (bottom row). Differences between bipolar disorder and schizophrenia largely resemble the schizophrenia vs. healthy volunteer contrast, though were somewhat attenuated. [Color figure can be viewed at http://wileyonlinelibrary.com]
Figure 4
Figure 4
Between‐Group Cortical Thickness Differences. The figure portrays statistically significant between‐group cortical thickness differences for bipolar, schizophrenia and healthy groups. Individuals with bipolar disorder exhibited localized cortical thinning in anterior cingulate and lateral inferior frontal gyrus while covering for age, sex, and MR sequence (top row). Although results did not fundamentally change when motion correction was included with other covariates (middle row), including a global cortical thickness estimate ablated group differences (bottom row). When age, sex, and MR sequence were included as covariates, individuals with schizophrenia showed pervasive cortical thickness deficits relative to healthy comparison subjects, particularly in limbic, lateral temporal and frontal regions (top row). These group‐differences remained, thought became more concentrated, when estimated head motion was included with other covariates (middle row). Including a global cortical thickness covariate (with prior covariates) as small portion of medial orbitofrontal gyrus differed between groups (bottom row). Relative to individuals with bipolar disorder, schizophrenia subjects had reduced cortical thickness in a focal region of the most inferior portion of right sensory cortex (top row). This pattern of results was not fundamentally altered when incorporating the motion correction covariate (middle row), but was ablated when a global index was covaried (bottom row). [Color figure can be viewed at http://wileyonlinelibrary.com]
Figure 5
Figure 5
Diagnosis by Head Motion Interaction on Cortical Thickness. The figure depicts statistically significant vertex‐level diagnosis by head motion interactions on cortical thickness measures. An interaction was observed for the most posterior portion of the left medial orbitofrontal gyrus such that increased motion is associated with increased cortical thickness in this region for bipolar subjects, the opposite relationship is observed for healthy subjects (left panel). This interaction remained significant after conditioning on global cortical thickness. A significant diagnosis by head motion interaction was observed for schizophrenia (vs. healthy subjects) surrounding the cuneus and a focal region of the superior parietal gyrus, where increased head motion among schizophrenia subjects was associated with increased thickness in these regions while healthy subjects showed thinner cortex with motion (middle panel). Finally, a significant diagnosis by head motion interaction was observed in left entorhinal cortex and left parahippocampal gyrus for individuals with schizophrenia versus healthy subject (right panel). [Color figure can be viewed at http://wileyonlinelibrary.com]

Similar articles

Cited by

  • What we learn about bipolar disorder from large-scale neuroimaging: Findings and future directions from the ENIGMA Bipolar Disorder Working Group.
    Ching CRK, Hibar DP, Gurholt TP, Nunes A, Thomopoulos SI, Abé C, Agartz I, Brouwer RM, Cannon DM, de Zwarte SMC, Eyler LT, Favre P, Hajek T, Haukvik UK, Houenou J, Landén M, Lett TA, McDonald C, Nabulsi L, Patel Y, Pauling ME, Paus T, Radua J, Soeiro-de-Souza MG, Tronchin G, van Haren NEM, Vieta E, Walter H, Zeng LL, Alda M, Almeida J, Alnaes D, Alonso-Lana S, Altimus C, Bauer M, Baune BT, Bearden CE, Bellani M, Benedetti F, Berk M, Bilderbeck AC, Blumberg HP, Bøen E, Bollettini I, Del Mar Bonnin C, Brambilla P, Canales-Rodríguez EJ, Caseras X, Dandash O, Dannlowski U, Delvecchio G, Díaz-Zuluaga AM, Dima D, Duchesnay É, Elvsåshagen T, Fears SC, Frangou S, Fullerton JM, Glahn DC, Goikolea JM, Green MJ, Grotegerd D, Gruber O, Haarman BCM, Henry C, Howells FM, Ives-Deliperi V, Jansen A, Kircher TTJ, Knöchel C, Kramer B, Lafer B, López-Jaramillo C, Machado-Vieira R, MacIntosh BJ, Melloni EMT, Mitchell PB, Nenadic I, Nery F, Nugent AC, Oertel V, Ophoff RA, Ota M, Overs BJ, Pham DL, Phillips ML, Pineda-Zapata JA, Poletti S, Polosan M, Pomarol-Clotet E, Pouchon A, Quidé Y, Rive MM, Roberts G, Ruhe HG, Salvador R, Sarró S, Satterthwaite TD, Schene AH, Sim K, Soares JC, Stäblein M, Stein D… See abstract for full author list ➔ Ching CRK, et al. Hum Brain Mapp. 2022 Jan;43(1):56-82. doi: 10.1002/hbm.25098. Epub 2020 Jul 29. Hum Brain Mapp. 2022. PMID: 32725849 Free PMC article. Review.
  • Clinical and cortical similarities identified between bipolar disorder I and schizophrenia: A multivariate approach.
    Rootes-Murdy K, Edmond JT, Jiang W, Rahaman MA, Chen J, Perrone-Bizzozero NI, Calhoun VD, van Erp TGM, Ehrlich S, Agartz I, Jönsson EG, Andreassen OA, Westlye LT, Wang L, Pearlson GD, Glahn DC, Hong E, Buchanan RW, Kochunov P, Voineskos A, Malhotra A, Tamminga CA, Liu J, Turner JA. Rootes-Murdy K, et al. Front Hum Neurosci. 2022 Nov 10;16:1001692. doi: 10.3389/fnhum.2022.1001692. eCollection 2022. Front Hum Neurosci. 2022. PMID: 36438633 Free PMC article.
  • Comparing reliability-based measures of functional connectivity between movie and rest: An ROI-based approach.
    Shearer H, Eilbott J, Vila-Rodriguez F, Noble S, Xu T, Vanderwal T. Shearer H, et al. Imaging Neurosci (Camb). 2025 Jan 2;3:imag_a_00411. doi: 10.1162/imag_a_00411. eCollection 2025. Imaging Neurosci (Camb). 2025. PMID: 40800749 Free PMC article.
  • Large-Scale Neuroimaging of Mental Illness.
    Ching CRK, Kang MJY, Thompson PM. Ching CRK, et al. Curr Top Behav Neurosci. 2024;68:371-397. doi: 10.1007/7854_2024_462. Curr Top Behav Neurosci. 2024. PMID: 38554248 Review.
  • Detecting Abnormal Brain Regions in Schizophrenia Using Structural MRI via Machine Learning.
    Chen Z, Yan T, Wang E, Jiang H, Tang Y, Yu X, Zhang J, Liu C. Chen Z, et al. Comput Intell Neurosci. 2020 Apr 5;2020:6405930. doi: 10.1155/2020/6405930. eCollection 2020. Comput Intell Neurosci. 2020. PMID: 32300361 Free PMC article.

References

    1. Alexander‐Bloch A, Clasen L, Stockman M, Ronan L, Lalonde F, Giedd J, Raznahan A (2016): Subtle in‐scanner motion biases automated measurement of brain anatomy from in vivo MRI. Hum Brain Mapp 37:2385–2397. - PMC - PubMed
    1. Altshuler LL, Bartzokis G, Grieder T, Curran J, Mintz J (1998): Amygdala enlargement in bipolar disorder and hippocampal reduction in schizophrenia: An MRI study demonstrating neuroanatomic specificity. Arch Gen Psychiatry 55:663–664. - PubMed
    1. Arndt S, Cohen G, Alliger RJ, Swayze VW II, Andreasen NC (1991): Problems with ratio and proportion measures of imaged cerebral structures. Psychiatry Res 40:79–89. - PubMed
    1. Arnone D, Cavanagh J, Gerber D, Lawrie S, Ebmeier K, McIntosh A (2009): Magnetic resonance imaging studies in bipolar disorder and schizophrenia: meta‐analysis. Br J Psychiatry 195:194–201. - PubMed
    1. Asami T, Bouix S, Whitford TJ, Shenton ME, Salisbury DF, McCarley RW (2012): Longitudinal loss of gray matter volume in patients with first‐episode schizophrenia: DARTEL automated analysis and ROI validation. Neuroimage 59:986–996. - PMC - PubMed

Publication types