

Review
doi: 10.1088/1361-648X/aa7185.
Epub 2017 May 8.
Super-resolution optical microscopy for studying membrane structure and dynamics
Affiliations
- PMID: 28481213
- PMCID: PMC5952331
- DOI: 10.1088/1361-648X/aa7185
Item in Clipboard
Review
Super-resolution optical microscopy for studying membrane structure and dynamics
J Phys Condens Matter.
.
Abstract
Investigation of cell membrane structure and dynamics requires high spatial and temporal resolution. The spatial resolution of conventional light microscopy is limited due to the diffraction of light. However, recent developments in microscopy enabled us to access the nano-scale regime spatially, thus to elucidate the nanoscopic structures in the cellular membranes. In this review, we will explain the resolution limit, address the working principles of the most commonly used super-resolution microscopy techniques and summarise their recent applications in the biomembrane field.
Figures
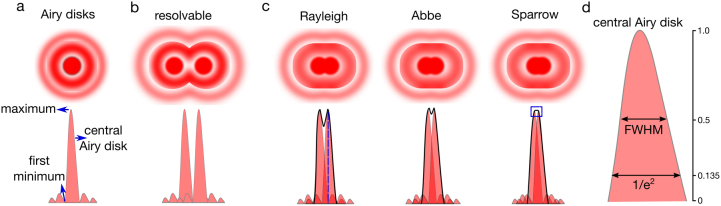
Diffraction limit. (a) When light interacts with fringes of intricate objects (such as small structures in biological samples), it broadens to a diffraction pattern as it propagates (Airy disks). This diffraction pattern becomes larger than the object masking the subtle details of it. The diffraction pattern of the light emitted by an infinitely small object forms the PSF of the object; it has a central maximum, local maxima and minima. PSF is crucial for resolution. (b) This diffraction of the light prevents the separation of two close-by objects with the standard illumination; only if the distance between two objects is larger than the resolution limit, they are seen as two separate objects. (c) If the distance between two objects is smaller than the resolution limit, they are seen as a single object instead of two separate objects. The resolution limit is defined by Rayleigh, Abbe and Sparrow differently (refer to the text for details). (d) Resolution can also be expressed by the width of the PSF such as full width at half maximum (FWHM) or the width at 1/e2.
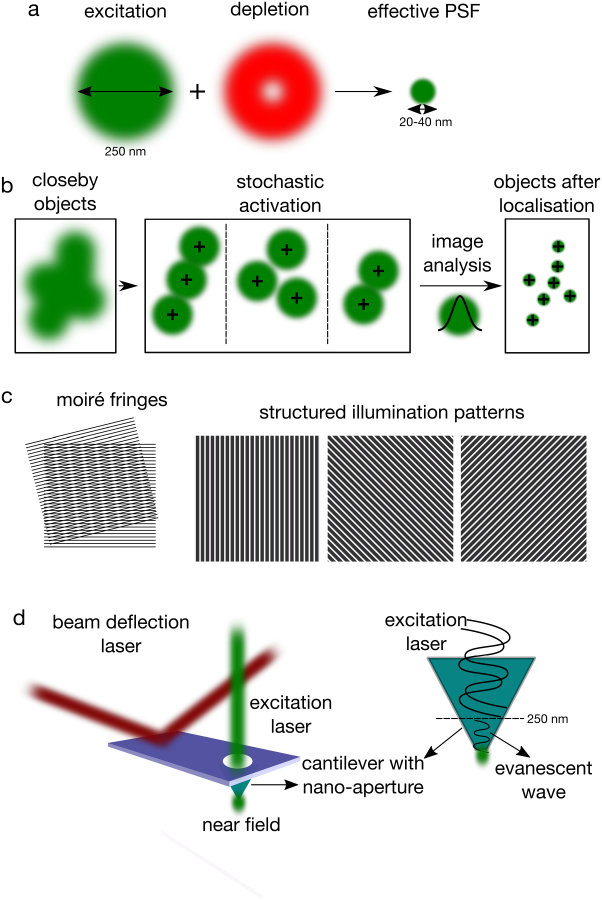
Super-resolution techniques. (a) STED is based on the depletion of PSF peripheral signal by a donut-shaped depletion beam. (b) PALM/STORM uses the photo-controllable fluorophores to observe single fluorophores at a time whose emission is then fit by a Gaussian to obtain a super-resolved image. (c) SIM is based on the predetermined illumination by a high frequency periodic light pattern, which creates interference with the high frequency variations in the fluorescence caused by small structures in the sample, resulting lower frequency Moiré interference pattern (left) which could be used to obtain information on the structures in the sample. Multiple patterns (right) are applied to obtain a single image. (d) In NSOM, size of the illumination spot is mechanically reduced by shielding of the illuminating light by an opaque screen, leaving a nanometric hole. Through this hole, an evanescent field is created which is not diffraction-limited.
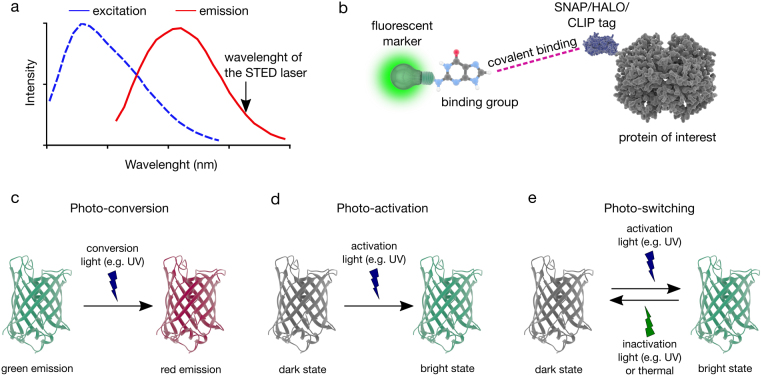
Fluorescent labelling for super-resolution techniques. (a) Spectral requirement for STED-capable dyes (b) SNAP/HALO/CLIP tag labelling strategies where a fluorescent marker that is linked to a small binding group (O6-benzylguanine derivatives for the SNAP-tag, O2-benzylcytosine derivatives for the CLIP-tag, and primary alkylhalides for the Halo-tag) can covalently be attached to the proteins that carry the SNAP, HALO or CLIP tags (c) photo-conversion is where the emission bandwidth of the fluorophore changes upon illumination with light, (d) photo-activation is triggering the bright state of the fluorophore with illumination, (e) photo-switching is reversible triggering between the dark and bright state of the fluorophore upon illumination.
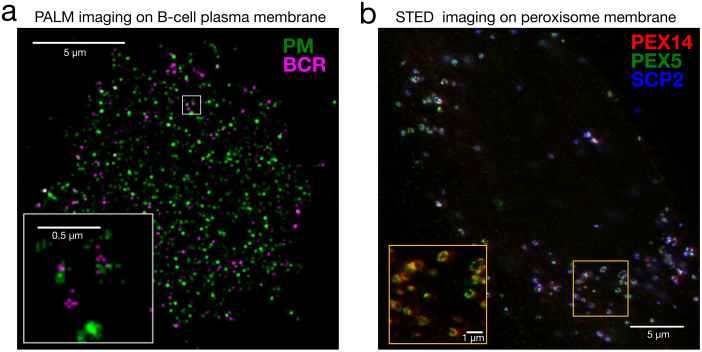
Imaging membrane structures with super-resolution microscopy. (a) Dual-colour PALM image of a B cell chemically fixed 1 min after B cell receptor (BCR) clustering. Clustered BCR is shown in magenta and a transiently expressed palmitoylated and myristoylated minimal peptide (PM) is shown in green. A weak co-localisation is observed between these two probes. Scale bars are 5 µm in the large image and 0.5 µm in the inset (Image courtesy of Dr Sarah Veatch, University of Michigan, Reproduced from [82]. CC BY 4.0 .) (b) Dual-colour STED image of human fibroblasts fixed and immune-labelled for the peroxisome proteins PEX5 (green), PEX14 (red) and SCP2 (blue); showing the ring-like patterns. Scale bars are 5 µm in the large image and 1 µm in the inset (Image courtesy of Dr Silvia Galiani, University of Oxford, Reproduced from [115]. CC BY 4.0 .).
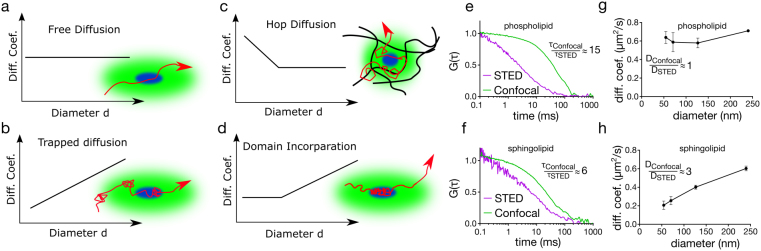
Diffusion dynamics in the plasma membrane. (a) In free diffusion, the diffusion coefficient of the molecule stays constant with varying spot diameter, (b) in transient immobilisation, the diffusion coefficient decreases with decreasing spot size, (c) in hop diffusion, the diffusion coefficient increases as observation spot gets smaller (d) in domain diffusion, the diffusion coefficient drops down but unlike transient immobilisation it levels out as the spot size gets closer to the domain size as the molecule still moves within the domain, (e) and (f) exemplary autocorrelation curves for (e) phospholipids (e.g. DPPE) and (f) sphingolipids (e.g. sphingomyelin) with confocal and STED illumination. While phospholipid transit time changes significantly (≈15 times) from confocal to STED illumination, sphingolipid diffusion time changes only marginally (≈6 times). Accordingly diffusion law of (g) the phospholipids and (h) the sphingolipids show free (where ratio of diffusion coefficient between confocal and STED is ≈1) and transient immobilisation (where ratio of diffusion coefficient between confocal and STED is greater than 1), respectively.
References
-
- Sezgin E, Levental I, Mayor S, Eggeling C. The mystery of membrane organisation: composition, regulation and physiological relevance of lipid rafts. Nat. Rev. Mol. Cell Biol. 2017 at press ( https://doi.org/10.1038/nrm.2017.16) - DOI - PMC - PubMed
Publication types
MeSH terms
Grants and funding
LinkOut - more resources
Full Text Sources
Other Literature Sources