Randomized Controlled Trial
. 2017 May 6;9(5):464.
doi: 10.3390/nu9050464.

The Effect of Isomaltulose Together with Green Tea on Glycemic Response and Antioxidant Capacity: A Single-Blind, Crossover Study in Healthy Subjects

Affiliations
Randomized Controlled Trial

The Effect of Isomaltulose Together with Green Tea on Glycemic Response and Antioxidant Capacity: A Single-Blind, Crossover Study in Healthy Subjects

Passakorn Suraphad et al. Nutrients. .

Abstract

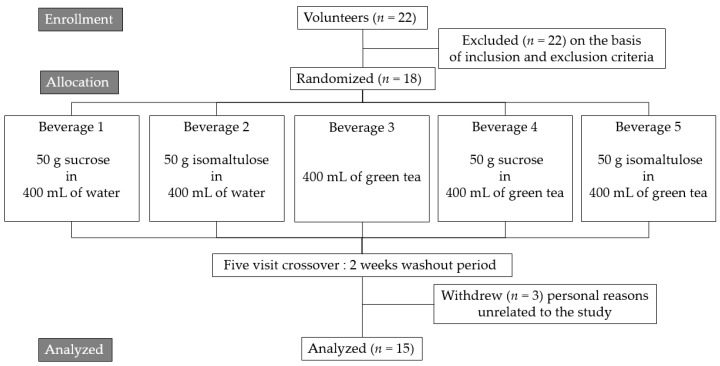
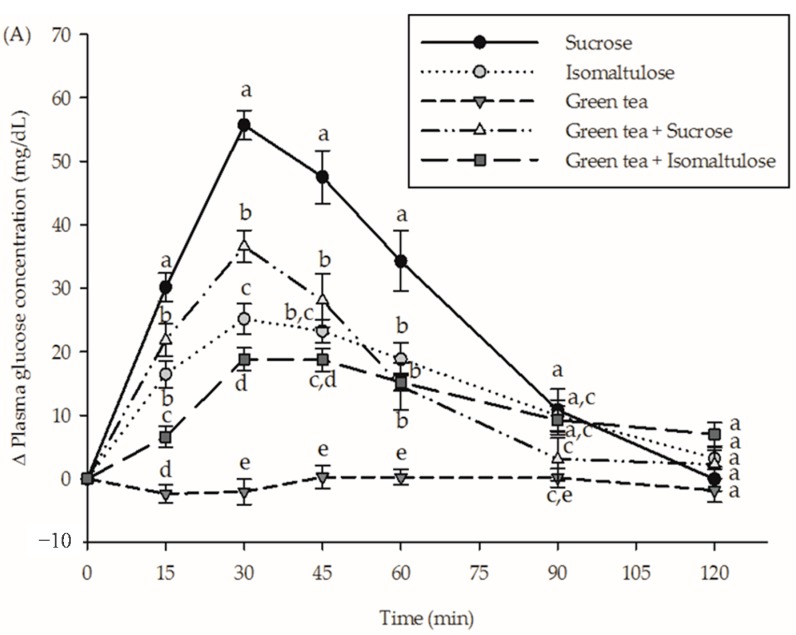
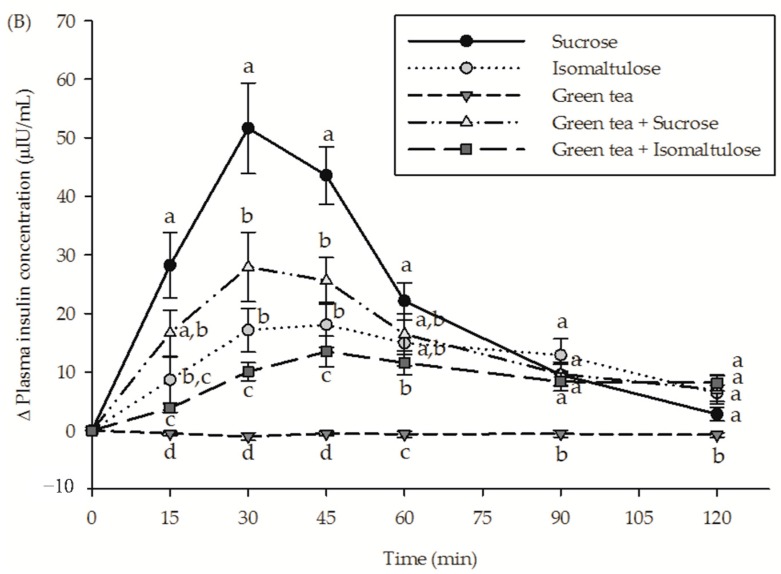
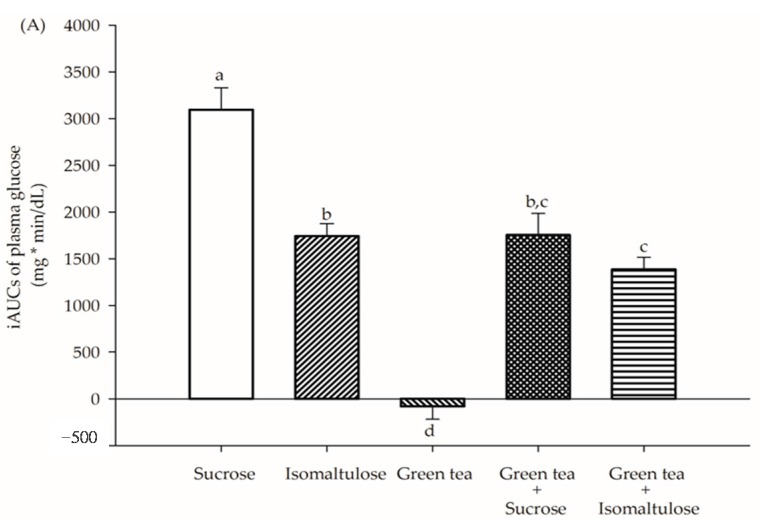
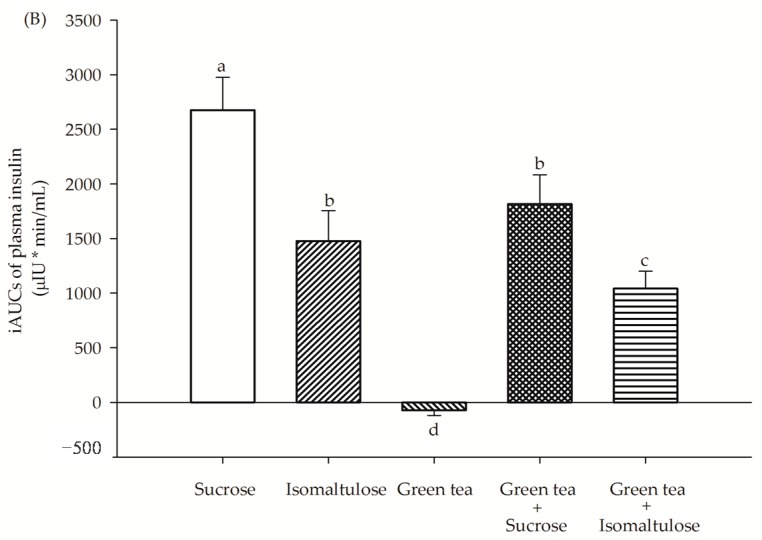
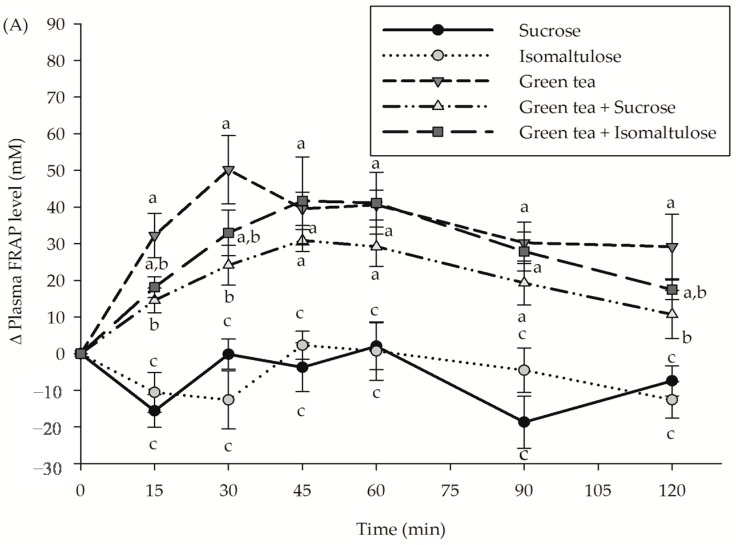
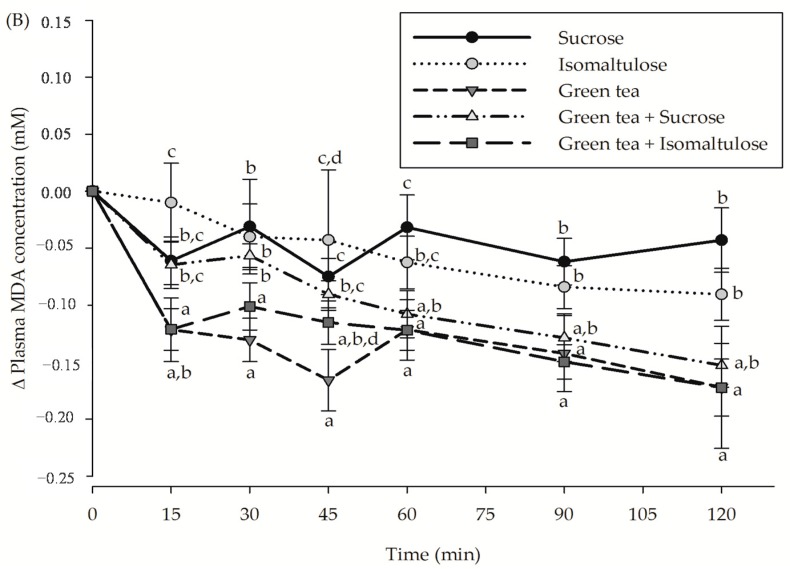
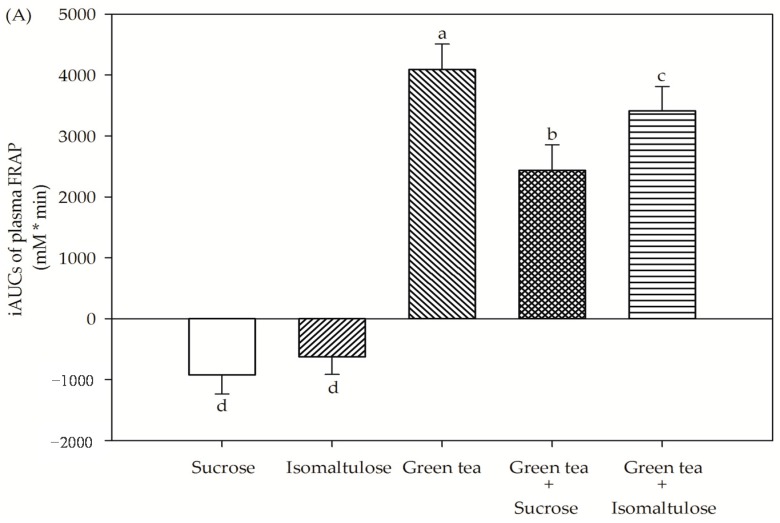
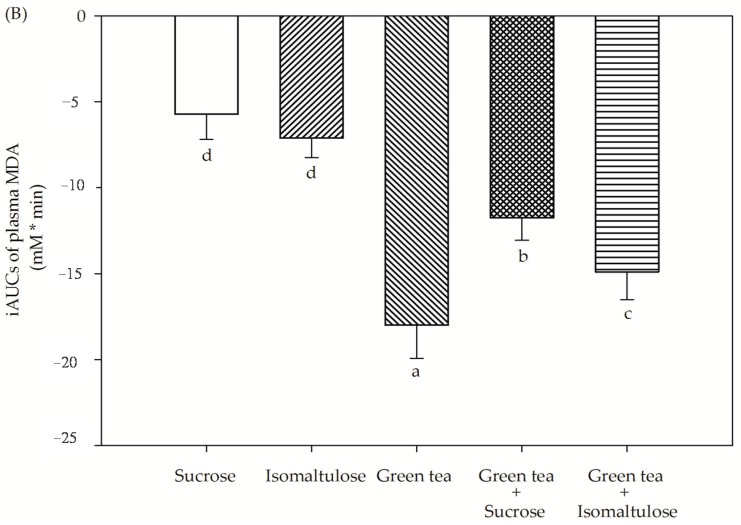
Isomaltulose, a naturally-occurring isomer of sucrose, is commonly used as an alternative sweetener in foods and beverages. The goal of this study was to determine the effect of isomaltulose together with green tea on postprandial plasma glucose and insulin concentration, as well as antioxidant capacity in healthy subjects. In a randomized, single-blind, crossover study, 15 healthy subjects (eight women and seven men; ages 23.5 ± 0.7 years; with body mass index of 22.6 ± 0.4 kg/m²) consumed five beverages: (1) 50 g sucrose in 400 mL water; (2) 50 g isomaltulose in 400 mL of water; (3) 400 mL of green tea; (4) 50 g sucrose in 400 mL of green tea; and (5) 50 g isomaltulose in 400 mL of green tea. Incremental area under postprandial plasma glucose, insulin, ferric reducing ability of plasma (FRAP) and malondialdehyde (MDA) concentration were determined during 120 min of administration. Following the consumption of isomaltulose, the incremental 2-h area under the curve (AUC0-2 h) indicated a higher reduction of postprandial glucose (43.4%) and insulin concentration (42.0%) than the consumption of sucrose. The addition of green tea to isomaltulose produced a greater suppression of postprandial plasma glucose (20.9%) and insulin concentration (37.7%). In accordance with antioxidant capacity, consumption of sucrose (40.0%) and isomaltulose (28.7%) caused the reduction of green tea-induced postprandial increases in FRAP. A reduction in postprandial MDA after drinking green tea was attenuated when consumed with sucrose (34.7%) and isomaltulose (17.2%). In conclusion, green tea could enhance the reduction of postprandial glucose and insulin concentration when consumed with isomaltulose. In comparison with sucrose, isomaltulose demonstrated less alteration of plasma antioxidant capacity after being consumed with green tea.

Keywords: antioxidant capacity; glycemic response; green tea; isomaltulose; sucrose.


Conflict of interest statement

The authors declare no conflict of interest.

Figures

Figure 1
Figure 1
Flowchart for a randomized, single-blinded, five-visit crossover study.
Figure 2
Figure 2
The incremental postprandial plasma (A) glucose concentration and (B) insulin concentration in healthy subjects after consumption of sucrose, isomaltulose, green tea, green tea plus sucrose and green tea plus isomaltulose (n = 15). Data are expressed as means ± SEM. Values not sharing the same superscript were significantly different between test groups in each time point (p < 0.05).
Figure 2
Figure 2
The incremental postprandial plasma (A) glucose concentration and (B) insulin concentration in healthy subjects after consumption of sucrose, isomaltulose, green tea, green tea plus sucrose and green tea plus isomaltulose (n = 15). Data are expressed as means ± SEM. Values not sharing the same superscript were significantly different between test groups in each time point (p < 0.05).
Figure 3
Figure 3
The incremental area under the curves (iAUCs) of plasma (A) glucose and (B) insulin concentration in healthy subjects after consumption of sucrose, isomaltulose, green tea, green tea plus sucrose and green tea plus isomaltulose (n = 15). Data are expressed as means ± SEM. Values not sharing the same superscript were significantly different between test groups (p < 0.05).
Figure 3
Figure 3
The incremental area under the curves (iAUCs) of plasma (A) glucose and (B) insulin concentration in healthy subjects after consumption of sucrose, isomaltulose, green tea, green tea plus sucrose and green tea plus isomaltulose (n = 15). Data are expressed as means ± SEM. Values not sharing the same superscript were significantly different between test groups (p < 0.05).
Figure 4
Figure 4
The incremental postprandial plasma (A) FRAP level and (B) malondialdehyde (MDA) concentration in healthy subjects after consumption of sucrose, isomaltulose, green tea, green tea plus sucrose and green tea plus isomaltulose (n = 15). Data are expressed as means ± SEM. Values not sharing the same superscript were significantly different between test groups in each time point (p < 0.05).
Figure 4
Figure 4
The incremental postprandial plasma (A) FRAP level and (B) malondialdehyde (MDA) concentration in healthy subjects after consumption of sucrose, isomaltulose, green tea, green tea plus sucrose and green tea plus isomaltulose (n = 15). Data are expressed as means ± SEM. Values not sharing the same superscript were significantly different between test groups in each time point (p < 0.05).
Figure 5
Figure 5
The incremental area under the curves (iAUCs) of plasma (A) FRAP and (B) MDA concentration in healthy subjects after consumption of sucrose, isomaltulose, green tea, green tea plus sucrose and green tea plus isomaltulose (n = 15). Data are expressed as means ± SEM. Values not sharing the same superscript were significantly different between test groups (p < 0.05).
Figure 5
Figure 5
The incremental area under the curves (iAUCs) of plasma (A) FRAP and (B) MDA concentration in healthy subjects after consumption of sucrose, isomaltulose, green tea, green tea plus sucrose and green tea plus isomaltulose (n = 15). Data are expressed as means ± SEM. Values not sharing the same superscript were significantly different between test groups (p < 0.05).

References

    1. Ng S.W., Ni Mhurchu C., Jebb S.A., Popkin B.M. Patterns and trends of beverage consumption among children and adults in Great Britain, 1986–2009. Br. J. Nutr. 2012;108:536–551. doi: 10.1017/S0007114511006465. - DOI - PMC - PubMed
    1. Kumar G.S., Pan L., Park S., Lee-Kwan S.H., Onufrak S., Blanck H.M. Sugar-sweetened beverage consumption among adults 18 states, 2012. Morb. Mortal. Wkly. Rep. 2014;63:686–690. - PMC - PubMed
    1. Hu F.B., Malik V.S. Sugar-sweetened beverages and risk of obesity and type 2 diabetes: Epidemiologic evidence. Physiol. Behav. 2010;100:47–54. doi: 10.1016/j.physbeh.2010.01.036. - DOI - PMC - PubMed
    1. Raben A., Vasilaras T.H., Moller A.C., Astrup A. Sucrose compared with artificial sweeteners: Different effects on ad libitum food intake and body weight after 10 week of supplementation in overweight subjects. Am. J. Clin. Nutr. 2002;76:721–729. - PubMed
    1. Moraes P.C.B.T., Bolini H.M.A. Different sweeteners in beverages prepared with instant and roasted ground coffee: Ideal and equivalent sweetness. J. Sens. Stud. 2010;25:215–225. doi: 10.1111/j.1745-459X.2010.00275. - DOI

Publication types

LinkOut - more resources