. 2017 May 8:2:17063.
doi: 10.1038/nmicrobiol.2017.63.

LUBAC-synthesized linear ubiquitin chains restrict cytosol-invading bacteria by activating autophagy and NF-κB

Affiliations

LUBAC-synthesized linear ubiquitin chains restrict cytosol-invading bacteria by activating autophagy and NF-κB

Jessica Noad et al. Nat Microbiol. .

Abstract

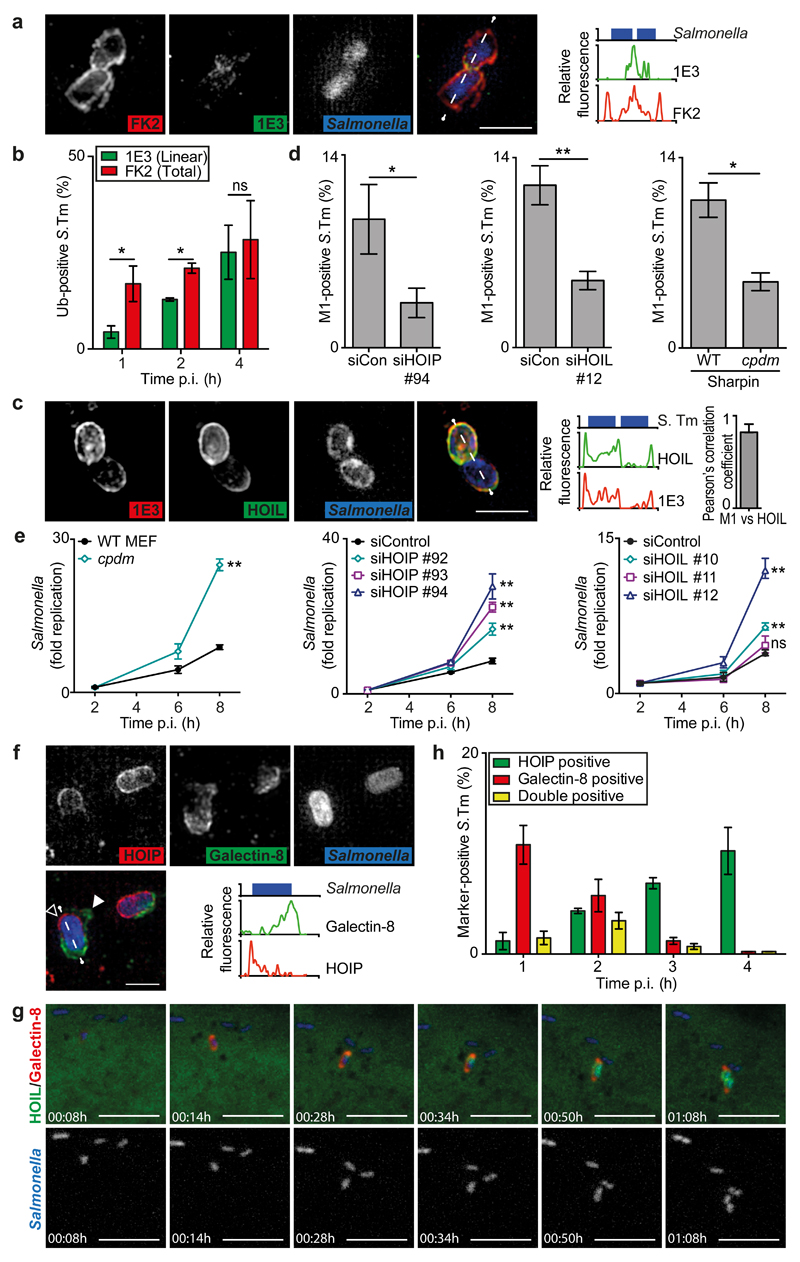
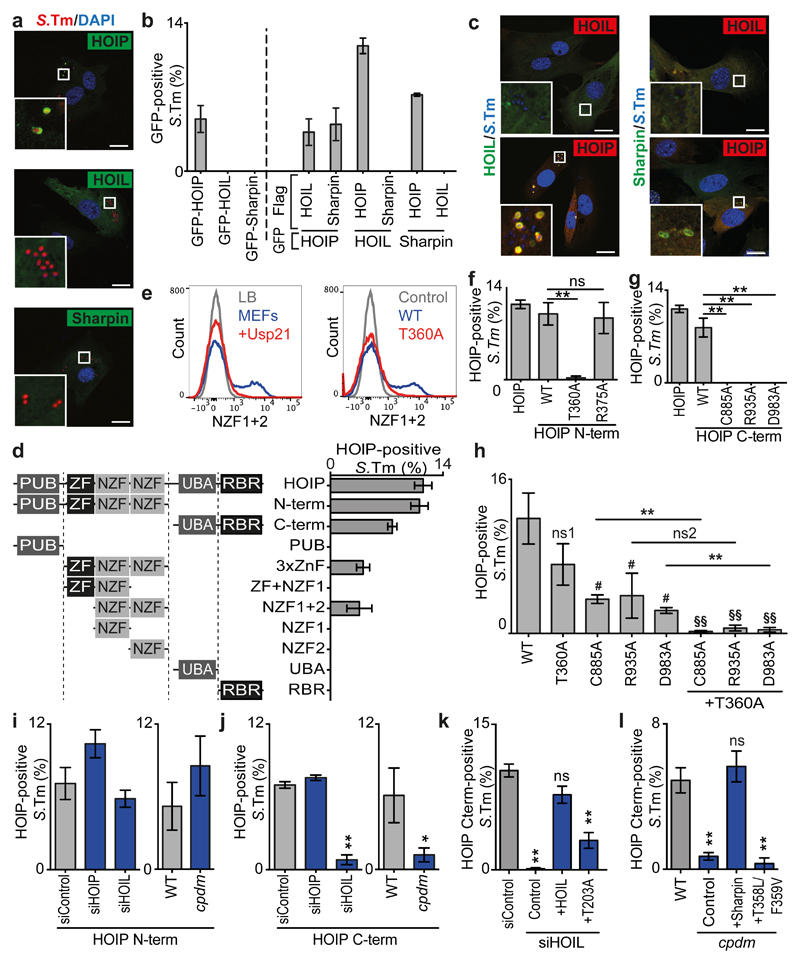
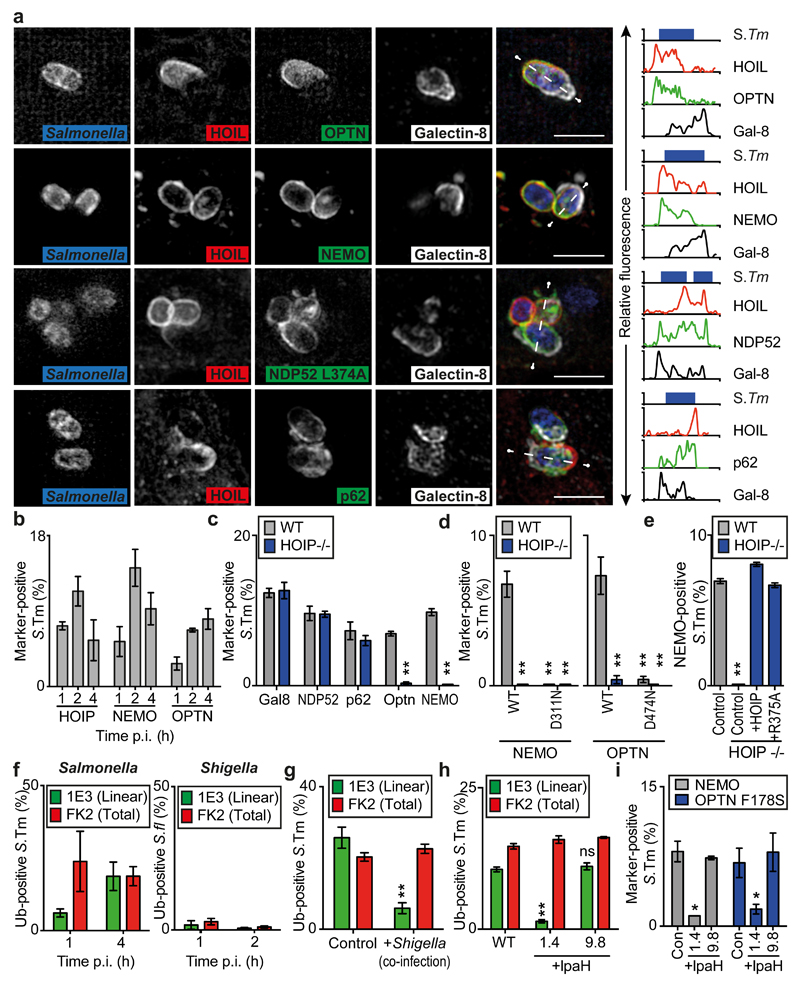
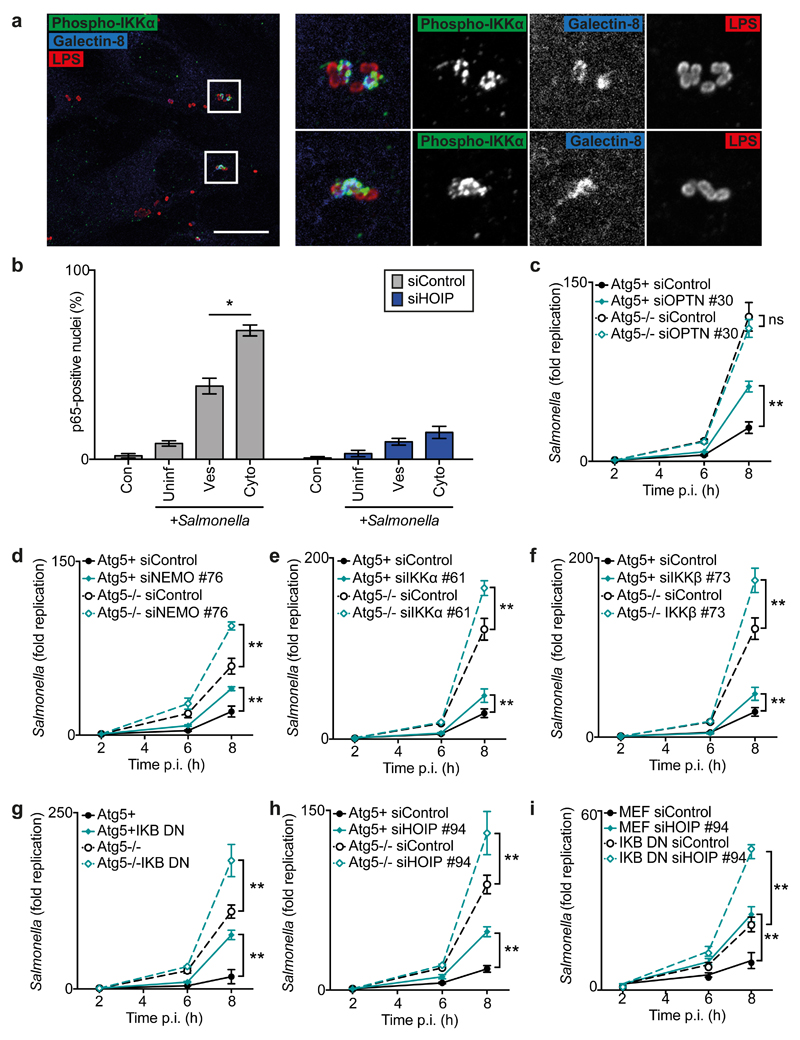
Cell-autonomous immunity relies on the ubiquitin coat surrounding cytosol-invading bacteria functioning as an 'eat-me' signal for xenophagy. The origin, composition and precise mode of action of the ubiquitin coat remain incompletely understood. Here, by studying Salmonella Typhimurium, we show that the E3 ligase LUBAC generates linear (M1-linked) polyubiquitin patches in the ubiquitin coat, which serve as antibacterial and pro-inflammatory signalling platforms. LUBAC is recruited via its subunit HOIP to bacterial surfaces that are no longer shielded by host membranes and are already displaying ubiquitin, suggesting that LUBAC amplifies and refashions the ubiquitin coat. LUBAC-synthesized polyubiquitin recruits Optineurin and Nemo for xenophagy and local activation of NF-κB, respectively, which independently restrict bacterial proliferation. In contrast, the professional cytosol-dwelling Shigella flexneri escapes from LUBAC-mediated restriction through the antagonizing effects of the effector E3 ligase IpaH1.4 on deposition of M1-linked polyubiquitin and subsequent recruitment of Nemo and Optineurin. We conclude that LUBAC-synthesized M1-linked ubiquitin transforms bacterial surfaces into signalling platforms for antibacterial immunity reminiscent of antiviral assemblies on mitochondria.


Figures

Fig.1
Fig.1. LUBAC synthesizes M1-linked ubiquitin chains on cytosolic S.Typhimurium and restricts its proliferation
(a,c,f) Structured illumination micrographs. MEFs infected with BFP-expressing S.Typhimurium, PFA-fixed at (a,c) 90min or (f) 1h post infection (p.i.) and stained for (a) total (FK2, red) and M1-linked (1E3, green) polyubiquitin, (c) co-expressing GFP:HOIL-1, Flag:HOIP and Flag:Sharpin and stained for M1-linked (1E3, red) polyubiquitin, or (f) expressing mCherry:HOIP and stained for Galectin-8 (false-coloured green); empty arrowhead indicates region with no galectin-8 and filled arrowhead indicates retracting Galectin-8+ve membrane. Line graphs show fluorescence plots along indicated lines. Data are representative of n>5 images from at least three independent experiments. Scale bar 2μm. (c) Far right graph Pearsons’s correlation coefficient of M1-linked polyubiquitin and HOIL. Mean±SD of n=5 images (b,d,h) Percentage of marker-positive S. Typhimurium as counted by eye using widefield microscopy at 90 min p.i. or at the indicated time points in PFA-fixed MEFs (b,d) stained with antibodies 1E3 for M1-linked and FK2 for total polyubiquitin or (h) expressing GFP:HOIP and mCherry:galectin-8. Mean±SEM of triplicate coverslips from three independent repeats, n>100 bacteria per coverslip. *p<0.05, **p<0.01, Student’s t-test. (e) Fold replication of S.Typhimurium in siRNA-treated or Sharpincpdm MEFs. Bacteria were counted based on their ability to grow on agar plates. Mean±SD of triplicate MEF cultures and duplicate colony counts, representing three independent repeats. ns=non-significant, **p<0.01, one-way ANOVA with Dunnett’s multiple comparisons test (siRNA-treated MEFs) or Student’s t-test (cpdm MEFs). (g) Selected frames from live imaging on a confocal spinning disk microscope (see Supplementary Video 1) of MEFs co-expressing mCherry:Galectin-8, GFP:HOIL-1, Flag:HOIP and Flag:Sharpin, infected with BFP-expressing S.Typhimurium and imaged every 2 min. The shown event is representative of >9 videos from three independent experiments. Scale bar 10μm.
Fig.2
Fig.2. HOIP senses and amplifies the ubiquitin coat of S.Typhimurium
(a,c) Confocal micrographs of PFA-fixed MEFs infected with (a) mCherry-expressing or (c) DAPI-stained S.Typhimurium (blue) and expressing (a) GFP-tagged LUBAC subunits only or (c) co-expressing Flag-tagged LUBAC subunits (red) at 1h p.i.. Data are representative of three independent experiments. Scale bar 20μM. Split channels displayed in Fig.S2A,C. (b,d,f-l) Percentage of marker-positive S. Typhimurium as counted by eye using widefield microscopy at 1h p.i. in PFA-fixed MEFs expressing (b) the indicated GFP- and FLAG-tagged LUBAC subunits or (d,f-l) GFP-tagged HOIP alleles. (i-l) MEFs from wild type or Sharpincpdm mice were treated with control siRNA or siRNA against the indicated murine LUBAC components and complemented with Flag-tagged human HOIP, HOIL-1 or Sharpin alleles as indicated. (b) Mean±SD of triplicate coverslips, representing two independent repeats. (d,f-l) Mean±SEM of triplicate coverslips from three independent repeats, n>100 bacteria per coverslip. *p<0.05, **p<0.01, (f,g,h,l) one-way ANOVA with Dunnett’s multiple comparisons test or (h,j) Student’s t-test. (h) # or ns1; compared to WT, §§; compared to T360A. (e) Flow cytometry of S.Typhimurium grown in LB as indicated or extracted from MEFs (all other samples), treated with Usp21 as indicated, and stained with recombinant HOIP NZF1+2 (WT, blue), mutant allele (T360A, red) or secondary reagent only (Control, grey).
Fig.3
Fig.3. LUBAC recruits Optineurin and Nemo to S.Typhimurium
(a) Structured illumination micrographs. MEFs infected with BFP-expressing S.Typhimurium co-expressing the indicated GFP-tagged proteins and mCherry:HOIL-1, Flag:HOIP and Flag:Sharpin were PFA-fixed at 1h p.i. and stained for Galectin-8 (white). NDP52 constructs lack SKICH domain to prevent aggregation. Graphs show fluorescence plots along indicated line. Data are representative of n>5 images from three independent experiments. Scale bar, 2μM (b-e) Percentage of marker-positive S. Typhimurium as counted by eye using widefield microscopy at 1h p.i. in PFA-fixed (b) MEFs or (c-e) wild type or HOIP−/− HCT116 cells expressing GFP-tagged alleles of HOIP, Nemo, Optn or antibody-stained for Galectin-8, NDP52 or p62. (e) HOIP expression was complemented with Flag-tagged HOIP alleles as indicated. Mean±SEM of triplicate coverslips from three independent repeats, n>100 bacteria per coverslip. *p<0.05, Student’s t-test. (f-i) Percentage of marker-positive S.flexneri or S.Typhimurium as counted by eye using widefield microscopy at 1h p.i. in PFA-fixed MEFs (f-h) stained with antibodies 1E3 for M1-linked and FK2 for total polyubiquitin or (i) expressing the indicated GFP-tagged genes.. Stable expression of Flag-tagged IpaH genes as indicated. In co-infections S.Typhimurium were identified by expression of mCherry. Mean±SEM of triplicate coverslips from three independent repeats, n>100 bacteria per coverslip. *p<0.05, **p<0.01, Student’s t-test.
Fig.4
Fig.4. LUBAC activates autophagy and NF-κB, which independently restrict cytosolic S.Typhimurium
(a) Confocal micrographs of methanol-fixed MEF cells at 1h p.i. with S.Typhimurium, stained with antibodies against LPS (red), phosphorylated IKKα (green) and Galectin-8 (blue). Data are representative of three independent experiments. Scale bar, 20μM. (b) Percentage of p65-positive nuclei as counted by eye using widefield microscopy at 1h p.i. in siRNA-treated PFA-fixed MEFs infected with GFP-expressing S.Typhimurium and stained for p65 and Galectin-8. Cells in infected sample (+Salmonella) were classified by bacterial status: no bacteria (Uninfected, ‘Uninf’), Galectin-8-ve bacteria only (Vesicular, ‘Ves’) or ≥1 Galectin-8+ve bacteria (Cytosolic, ‘Cyto’). Mean±SEM of triplicate coverslips from three independent repeats. n>100 bacteria counted per coverslip. (c-i) Fold replication of S.Typhimurium in MEFs treated with indicated siRNAs against (c) Optn, (d) Nemo, (e) IKKα, (f) IKKβ, (h-i) HOIP or (g,i) expressing I-κBαSS32,36AA (I-κBα DN). Bacteria were counted based on their ability to form colonies on agar plates. Mean±S.D. of triplicate MEF cultures and duplicate colony counts, representing two (e) or three (c-d,f-i) independent repeats. **p<0.01, Student’s t-test, (c-i) calculated for 8h timepoint.

References

    1. Deretic V, Saitoh T, Akira S. Autophagy in infection, inflammation and immunity. Nat Rev Immunol. 2013;13:722–737. - PMC - PubMed
    1. Cadwell K, et al. A key role for autophagy and the autophagy gene Atg16l1 in mouse and human intestinal Paneth cells. Nature. 2008;456:259–263. - PMC - PubMed
    1. Heath RJ, et al. RNF166 Determines Recruitment of Adaptor Proteins during Antibacterial Autophagy. CellReports. 2016;17:2183–2194. - PMC - PubMed
    1. Manzanillo PS, et al. The ubiquitin ligase parkin mediates resistance to intracellular pathogens. Nature. 2013;501:512–516. - PMC - PubMed
    1. Franco LH, et al. The Ubiquitin Ligase Smurf1 Functions in Selective Autophagy of Mycobacterium tuberculosis and Anti-tuberculous Host Defense. Cell Host and Microbe. 2017;21:59–72. - PMC - PubMed

MeSH terms

LinkOut - more resources