. 2017 May 8;7(5):e265.
doi: 10.1038/nutd.2017.17.

Liraglutide reduces body weight by upregulation of adenylate cyclase 3

Affiliations

Liraglutide reduces body weight by upregulation of adenylate cyclase 3

Z Li et al. Nutr Diabetes. .

Abstract

Objective: According to recent studies, adenylate cyclase 3 (AC3) is associated with obesity. Liraglutide reduces blood glucose levels and body weight (BW). We performed a 2 × 2 factorial experiment to study the relationships among AC3, liraglutide and obesity and to obtain a more comprehensive understanding of the mechanisms underlying the physiological effects of liraglutide on obesity.

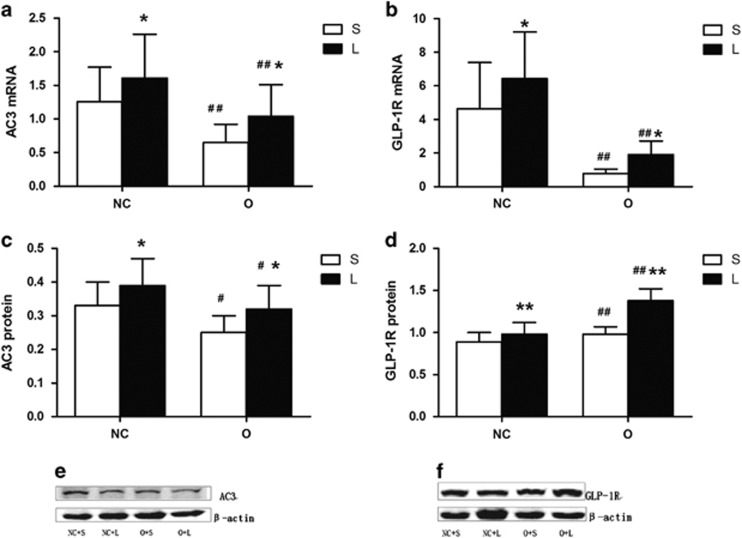
Methods: A high-fat diet was used to induce obesity in C57BL/6J mice. Both the normal and obese mice were treated with liraglutide (1 mg kg-1) or saline twice daily for 8 weeks. The hepatic levels of the AC3 and glucagon-like peptide receptor (GLP-1R) mRNAs and proteins were measured by quantitative real-time PCR and western blotting, respectively. The serum AC3 levels were detected using a rat/mouse AC3 enzyme-linked immunosorbent assay kit.

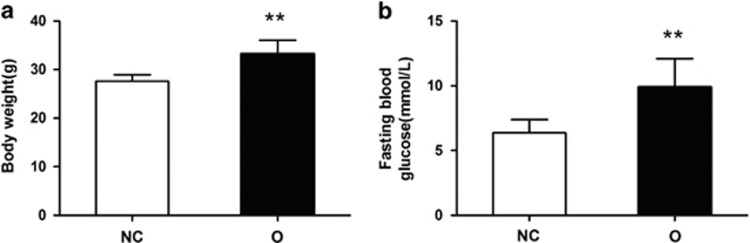
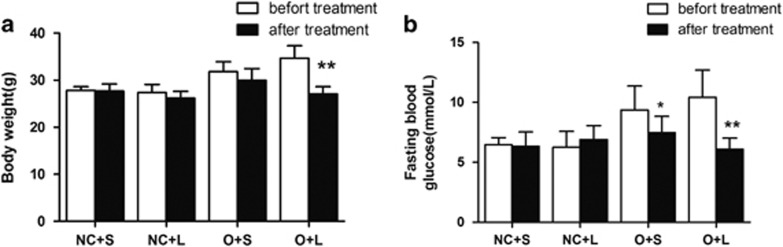
Results: The administration of liraglutide significantly decreased the BW in obese mice and normal control mice. The BW of obese mice exhibited a more obvious decrease. Hepatic AC3 mRNA and protein levels and serum AC3 levels were significantly reduced in obese mice compared with those in normal control mice. The administration of liraglutide significantly increased the hepatic expression of the AC3 and GLP-1R mRNAs and proteins and serum AC3 levels. The hepatic expression of the AC3 mRNA and protein and serum AC3 levels were negatively correlated with BW loss in the liraglutide-treated group. Pearson's correlation coefficients for these comparisons are r=-0.448, P=0.048; r=-0.478, P=0.046; and r=-0.909, P=0.000, respectively.

Conclusions: Based on our research, liraglutide reduces BW, possibly by increasing the expression of AC3.


Conflict of interest statement

The authors declare no conflict of interest.

Figures

Figure 1
Figure 1
BWs and FBG levels in mice before liraglutide treatment. The BWs and FBG levels in the normal control group and obese group are shown in (a) and (b), respectively. Values are presented as mean±s.d. (n=12 per group). **P<0.01 compared with the control group.
Figure 2
Figure 2
BWs and FBG levels in mice before and after liraglutide or saline treatment. The BWs and FBG levels observed before and after liraglutide or saline treatment are summarized in (a) and (b), respectively. Values are presented as means±s.d. (n=6 per group). *P<0.05; **P<0.01.
Figure 3
Figure 3
BWs, FBG levels, HOMA-IR scores and serum AC3 levels in mice treated with liraglutide (L) or saline (S). The BWs, FBG levels, HOMA-IR scores and serum AC3 levels observed after treatment with liraglutide or saline are summarized in (a–d), respectively. The P-values for the effect of the interaction between obesity and liraglutide treatment on BWs, FBG levels, HOMA-IR scores and serum AC3 levels are 0.350, 0.065, 0.008 and 0.736, respectively. Values are presented as means±s.d. (n=6 per group). *P<0.05, **P<0.01 for the comparison of the saline and liraglutide groups; #P<0.05, ##P<0.01 for the comparison of the normal and obese groups.
Figure 4
Figure 4
Expression of the AC3 and GLP-1R mRNAs and proteins in the liver after treatment with liraglutide (L) or saline (S). Expression of the AC3 and GLP-1R mRNAs and proteins in liver tissues of mice treated with liraglutide or saline are shown in (a–d), respectively. The image of AC3 and GLP-1R from western blotting experiments is represented in (e and f). The P-values for the effect of the interaction between obesity and liraglutide treatment on the hepatic AC3 mRNA, GLP-1R mRNA, AC3 protein and GLP-1R protein levels are 0.724, 0.96, 0.846 and 0.005, respectively. Values are presented as means±s.d. (n=8 per group, when detecting the expression levels of the AC3 and GLP-1R mRNAs; n=6 per group, when detecting the expression levels of the AC3 and GLP-1R proteins). *P<0.05, **P<0.01 for the comparison between the saline and liraglutide groups; #P<0.05, ##P<0.01 for the comparison between the normal and obese groups.

References

    1. Flegal KM, Carroll MD, Ogden CL, Curtin LR. Prevalence and trends in obesity among US adults, 1999-2008. JAMA 2010; 303: 235–241. - PubMed
    1. Ogden CL, Carroll MD, Curtin LR, Lamb MM, Flegal KM. Prevalence of high body mass index in US children and adolescents, 2007-2008. JAMA 2010; 303: 242–249. - PubMed
    1. Wang YC, McPherson K, Marsh T, Gortmaker SL, Brown M. Health and economic burden of the projected obesity trends in the USA and the UK. Lancet 2011; 378: 815–825. - PubMed
    1. Ng M, Fleming T, Robinson M, Thomson B, Graetz N, Margono C et al. Global, regional, and national prevalence of overweight and obesity in children and adults during 1980-2013: a systematic analysis for the Global Burden of Disease Study 2013. Lancet 2014; 384: 766–781. - PMC - PubMed
    1. Guh DP, Zhang W, Bansback N, Amarsi Z, Birmingham CL, Anis AH. The incidence of co-morbidities related to obesity and overweight: a systematic review and meta-analysis. BMC Public Health 2009; 9: 88. - PMC - PubMed