. 2017 Jun;49(6):825-833.
doi: 10.1038/ng.3861. Epub 2017 May 8.

Recurrent noncoding regulatory mutations in pancreatic ductal adenocarcinoma

Affiliations

Recurrent noncoding regulatory mutations in pancreatic ductal adenocarcinoma

Michael E Feigin et al. Nat Genet. 2017 Jun.

Abstract

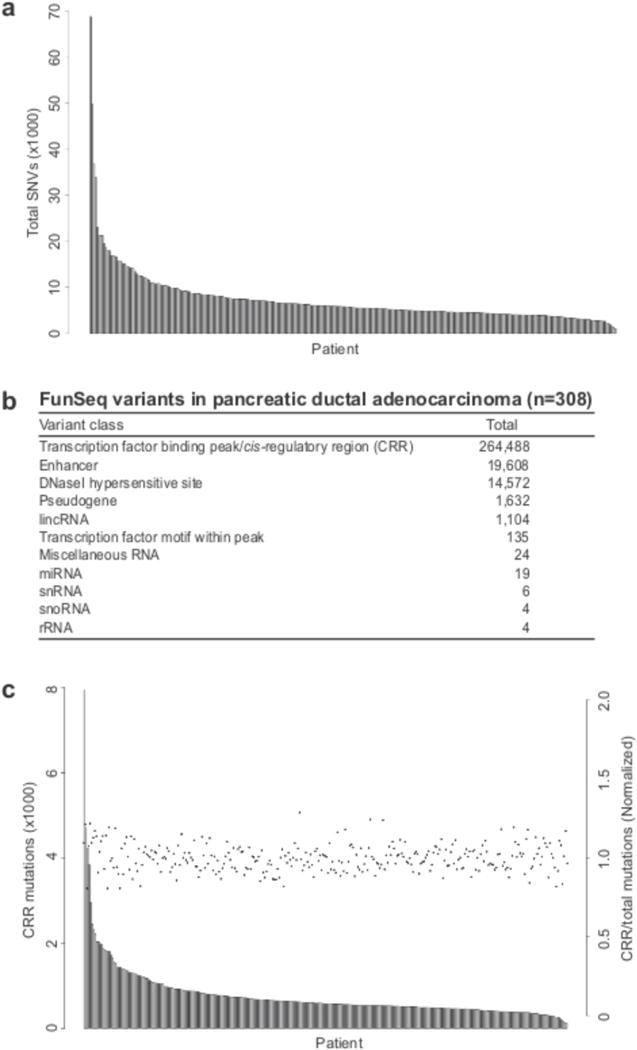
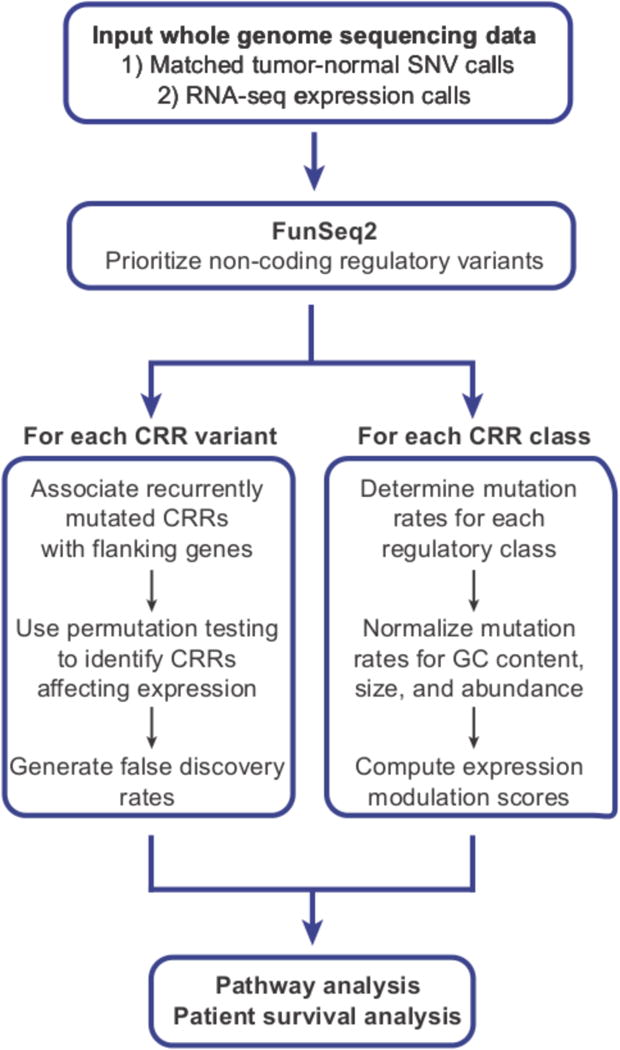
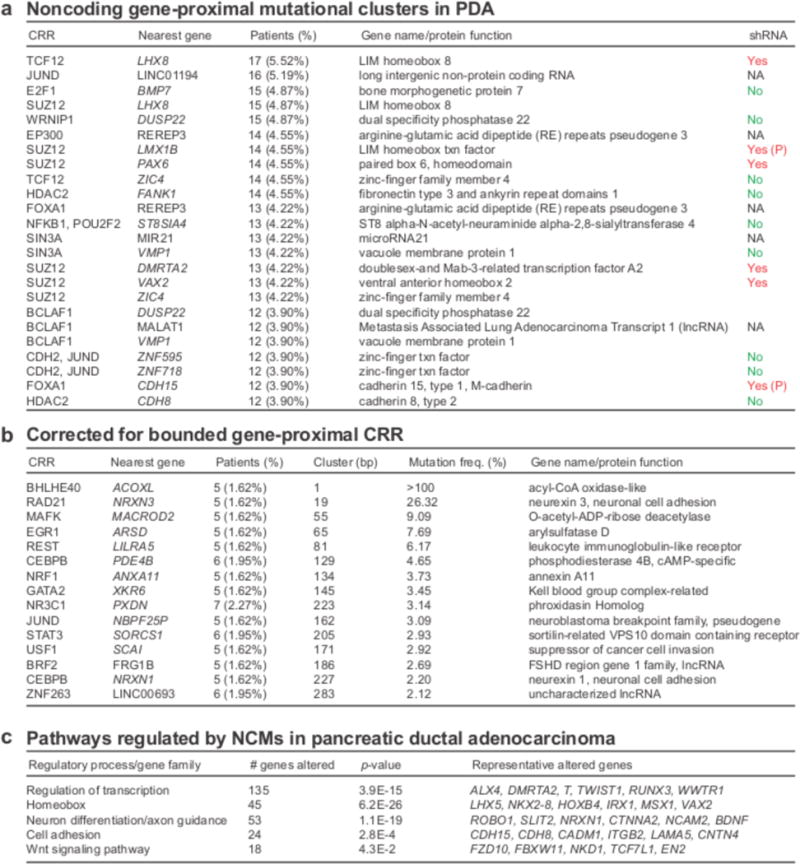
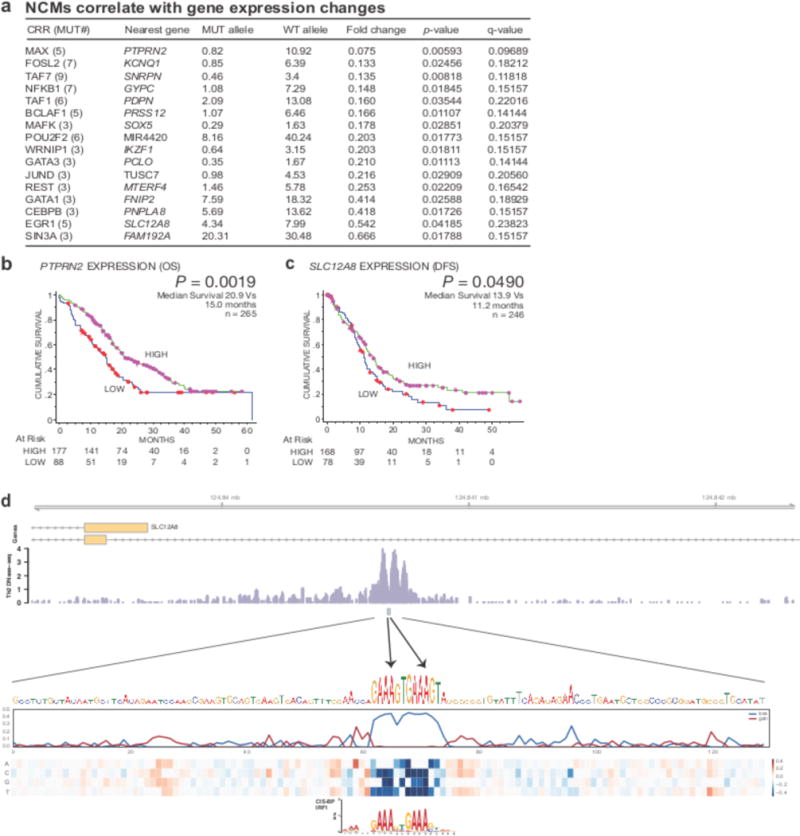
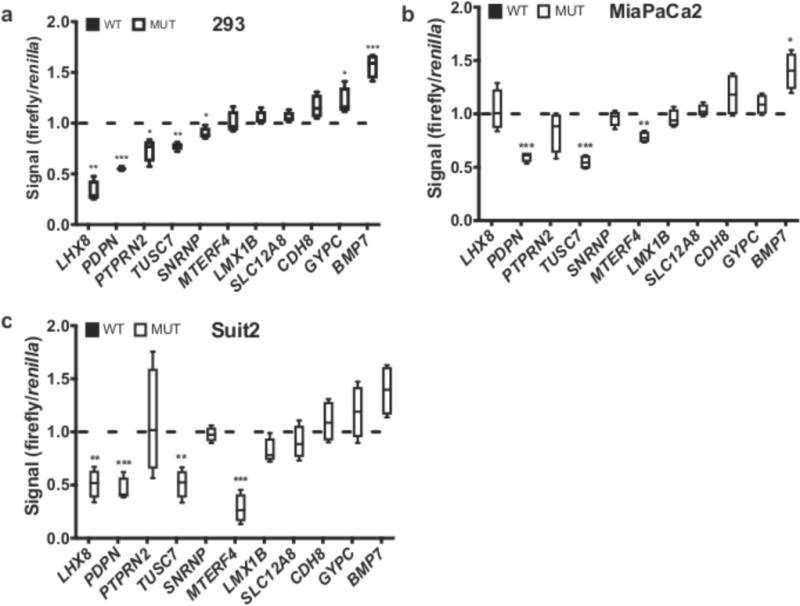
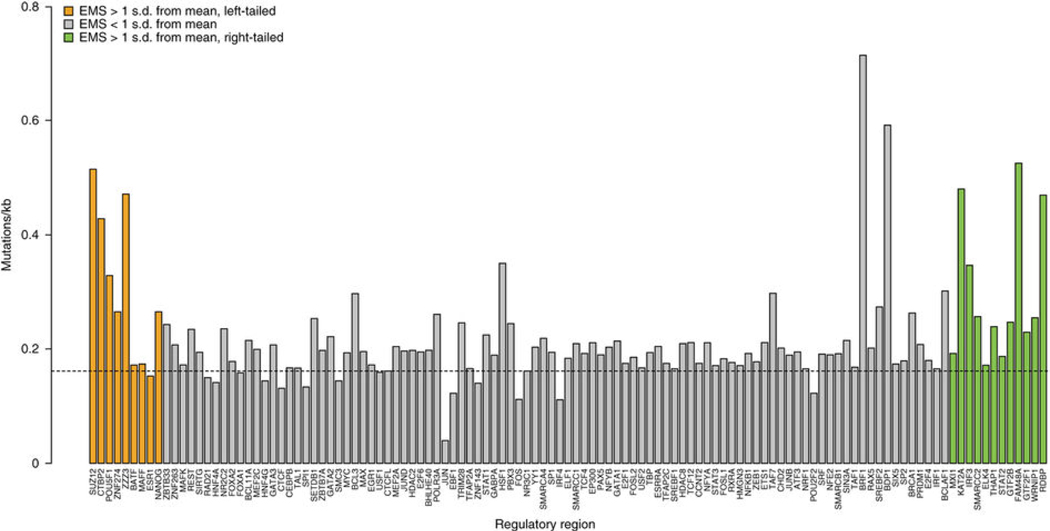
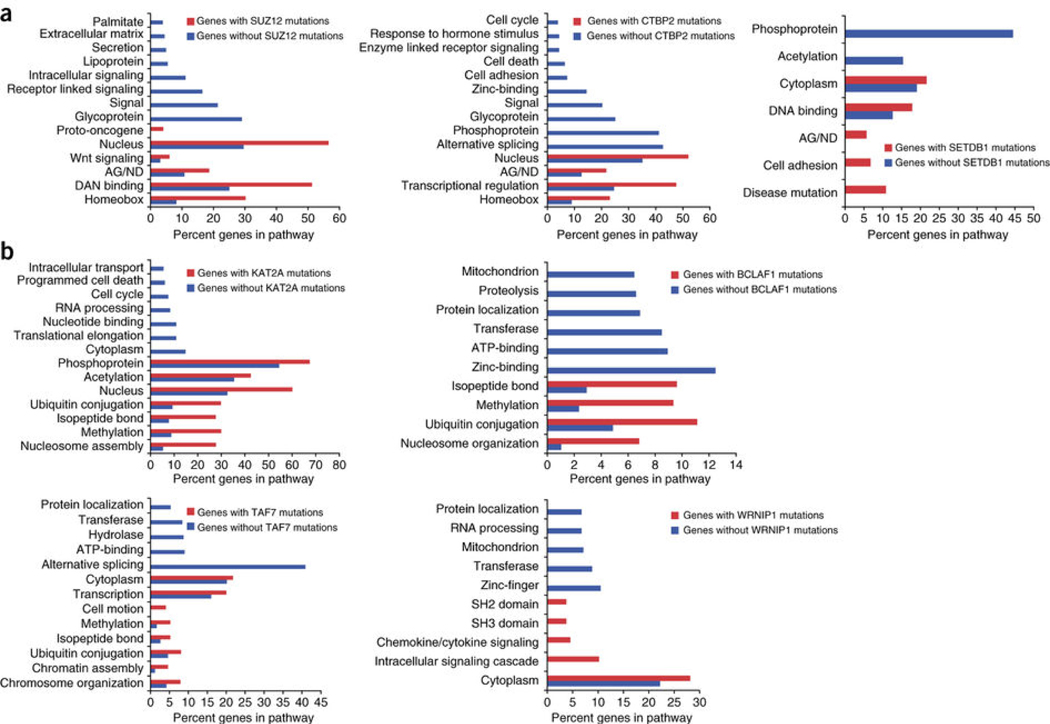
The contributions of coding mutations to tumorigenesis are relatively well known; however, little is known about somatic alterations in noncoding DNA. Here we describe GECCO (Genomic Enrichment Computational Clustering Operation) to analyze somatic noncoding alterations in 308 pancreatic ductal adenocarcinomas (PDAs) and identify commonly mutated regulatory regions. We find recurrent noncoding mutations to be enriched in PDA pathways, including axon guidance and cell adhesion, and newly identified processes, including transcription and homeobox genes. We identified mutations in protein binding sites correlating with differential expression of proximal genes and experimentally validated effects of mutations on expression. We developed an expression modulation score that quantifies the strength of gene regulation imposed by each class of regulatory elements, and found the strongest elements were most frequently mutated, suggesting a selective advantage. Our detailed single-cancer analysis of noncoding alterations identifies regulatory mutations as candidates for diagnostic and prognostic markers, and suggests new mechanisms for tumor evolution.


Conflict of interest statement

COMPETING FINANCIAL INTERESTS STATEMENT

The authors declare no competing financial interests.

Figures

Figure 1
Figure 1. Identification of recurrent noncoding mutations in PDA
(a) The total number of single nucleotide variants (SNV) was plotted for each patient. (b) FunSeq2 was utilized to detect and characterize putatitve somatic noncoding mutations from 308 PDA whole genome sequences. Mutation counts for each functional category are displayed. (c) The number of cis-regulatory region (CRR) mutations (grey bars), and CRR/total SNV (black points) were plotted for each patient.
Figure 2
Figure 2. GECCO (Genomic Enrichment Computational Clustering Operation) flowchart
GECCO utilizes noncoding somatic mutation calls from tumor whole genome sequencing data to identify clusters of mutations within 2kb of genes, including those that correlate with changes in gene expression. GECCO also calculates the mutation rate of gene regulatory regions and determines the strength of each regulatory region in terms of the effect on gene expression (expression modulation score, EMS). These data can then be used for pathway analysis of genes proximal to noncoding clusters and genes downstream of specific regulatory regions. The gene lists can also be interrogated for patient survival analysis when coupled to outcome data for detection of clinically relevant interactions.
Figure 3
Figure 3. Clustered gene-proximal mutations and pathways in PDA
(a) The most common mutational clusters across the patient cohort as determined by GECCO, with associated genes; Yes = knockdown promoted cell death in shRNA cancer cell line screen. (P denotes PDA-specific); No = no evidence for effect on cell death in shRNA cancer cell line screen. (b) Most significant clusters when corrected for cluster size as determined by GECCO. (c) DAVID pathway analysis was used to identify regulatory processes and pathways from genes associated with recurrent NCMs.
Figure 4
Figure 4. Recurrent gene-proximal mutations correlate with gene expression changes in PDA
(a) GECCO used gene expression data from matched PDA patients to correlate NCMs with changes in gene expression “Mut allele” = mean expression of linked gene in patients with associated CRR mutations. “WT allele” = mean expression of linked gene in patients without associated CRR mutations. (b) Analysis of overall survival (OS) in PDA patients expressing high (upper 2/3) and low (lower 1/3) levels of PTPRN2. Purple dots represent patients with high expression of PTPRN2 “at risk” (alive). Red dots represent patients with low expression of PTPRN2 “at risk” (alive). (c) Analysis of disease-free survival (DFS) in PDA patients expressing high (upper 2/3) and low (lower 1/3) levels of SLC12A8. (d) Two A→C mutations in a regulatory site on chromosome 3 at positions 124,840,671 and 124,840,678 alter critical nucleotides in an IRF1 and/or PRDM1 binding site. The regulatory site lies in an intron of one isoform and promoter of an alternative isoform of SLC12A8. At the bottom, heat map displays predicted change in accessibility, considered here as DNase-seq signal in GM12865. The line plots above measure the maximum (gain) and minimum (loss) predicted change; the loss highlights nucleotides that significantly alter the overall signal upon mutation as both of these mutations do.
Figure 5
Figure 5. - Noncoding mutations modulate luciferase gene expression
(a-c) Luciferase reporter assays of WT (black) and MUT sequences (white bars) are shown for selected NCMs associated with named genes. For each box-and-whisker plot, center line is the mean, box limits are min/max values, whiskers are s.d. Data from a representative experiment (n=3 replicates) with a total of n=4 independent transfected cultures for each cell line are shown. P values calculated by two-tailed unpaired t test. (*, p<0.05; **, p<0.01; ***, p<0.001)
Figure 6
Figure 6. Gene-proximal NCMs are enriched in specific classes of CRRs
Percentage of CRRs with at least 2 mutations across the patient cohort, corrected for genome abundance and size, ordered from left to right by expression modulation score (EMS) (most repressive to most active). Dotted line represents mean mutation frequency across all CRRs.
Figure 7
Figure 7. Gene-proximal NCMs in repressors and activators cluster near distinct subsets of genes
(a) Pathway analysis of genes associated with recurrently mutated repressive (SUZ12, CTBP2, SETDB1) sites (red bars), versus those never harboring NCMs in those CRRs (blue bars). (b) Pathway analysis of genes associated with recurrently mutated activator (KAT2A, BCLAF1, TAF7, WRNIP1) sites (red bars), versus those never harboring NCMs in those CRRs (blue bars). AG/ND, axon guidance/neuron differentiation.

References

    1. Siegel R, Naishadham D, Jemal A. Cancer statistics, 2013. CA: a cancer journal for clinicians. 2013;63:11–30. - PubMed
    1. Jones S, et al. Core signaling pathways in human pancreatic cancers revealed by global genomic analyses. Science. 2008;321:1801–1806. - PMC - PubMed
    1. Biankin AV, et al. Pancreatic cancer genomes reveal aberrations in axon guidance pathway genes. Nature. 2012;491:399–405. - PMC - PubMed
    1. Waddell N, et al. Whole genomes redefine the mutational landscape of pancreatic cancer. Nature. 2015;518:495–501. - PMC - PubMed
    1. Huang FW, et al. Highly recurrent TERT promoter mutations in human melanoma. Science. 2013;339:957–959. - PMC - PubMed

MeSH terms

Substances