. 2017 Jul;20(7):987-996.
doi: 10.1038/nn.4568. Epub 2017 May 3.

Thalamic projections sustain prefrontal activity during working memory maintenance

Affiliations

Thalamic projections sustain prefrontal activity during working memory maintenance

Scott S Bolkan et al. Nat Neurosci. 2017 Jul.

Erratum in

Abstract

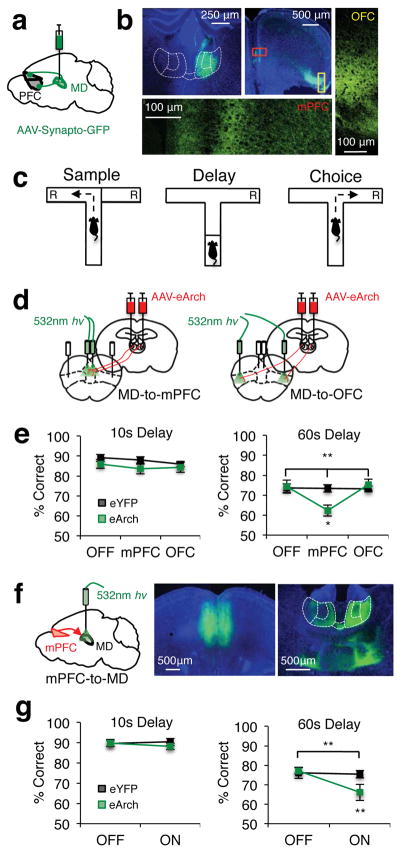
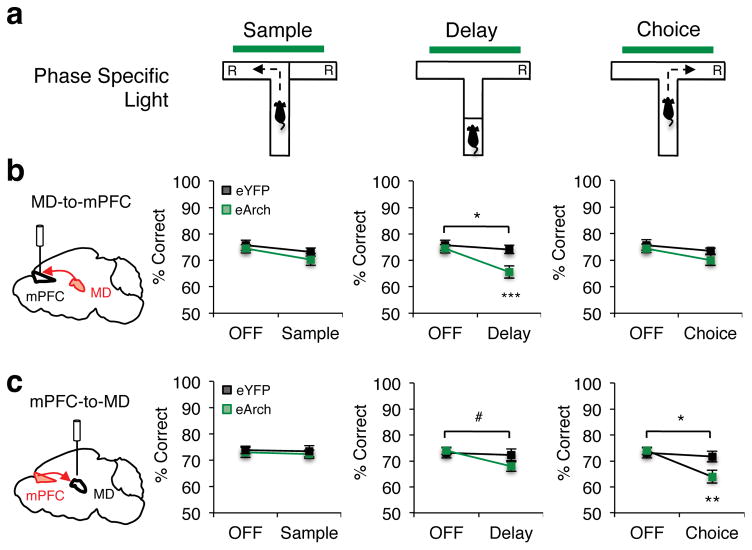
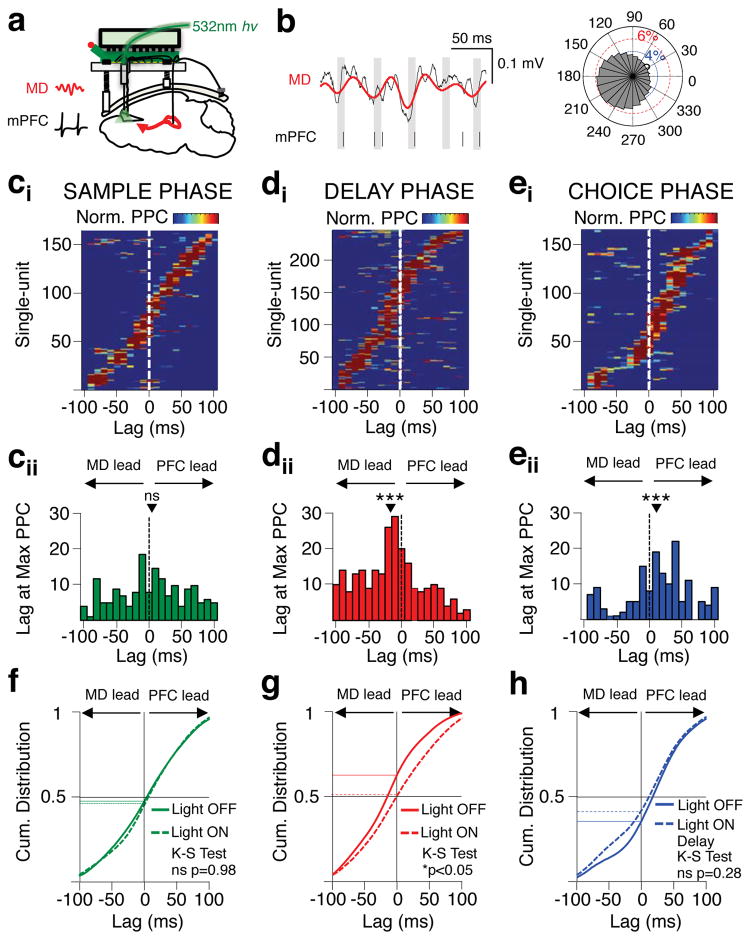
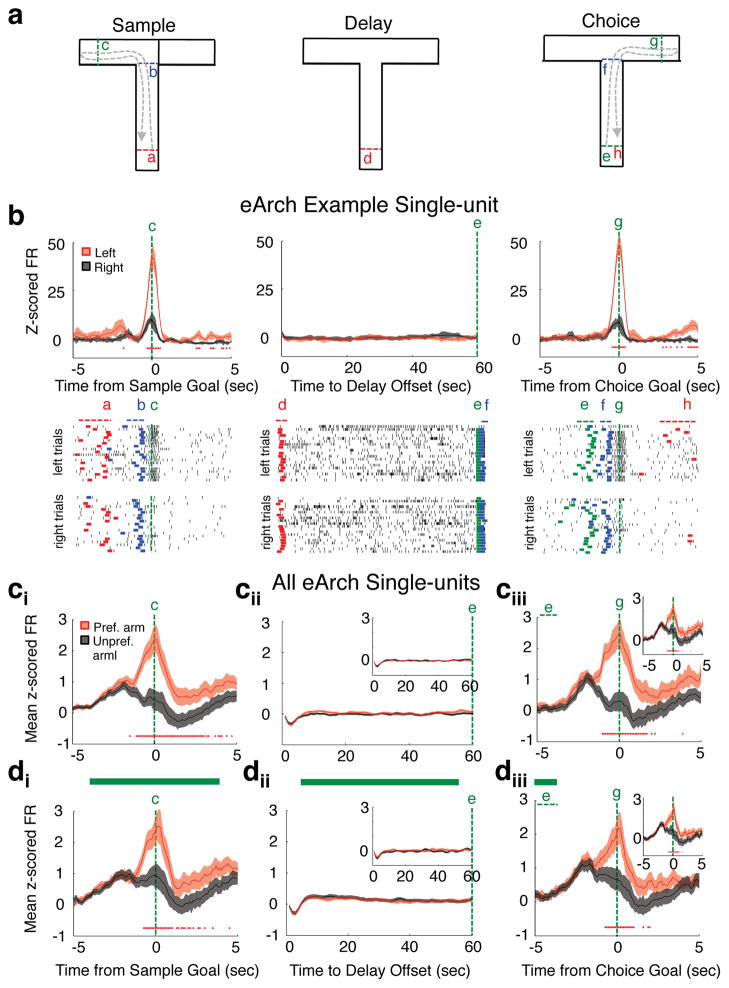
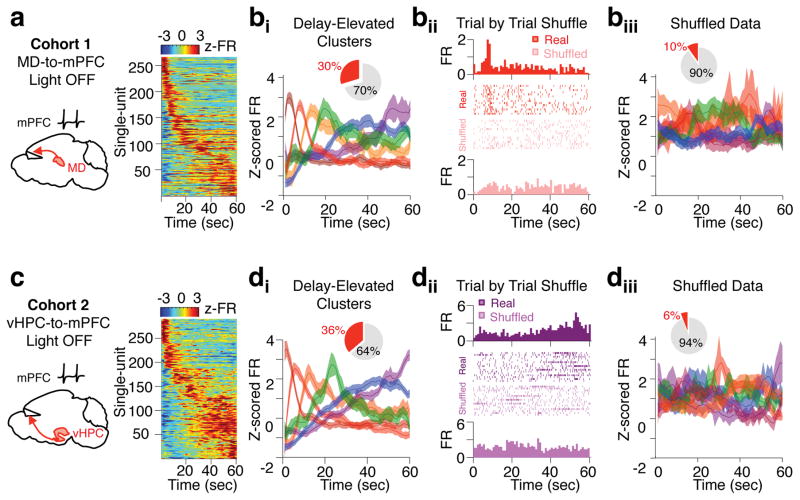
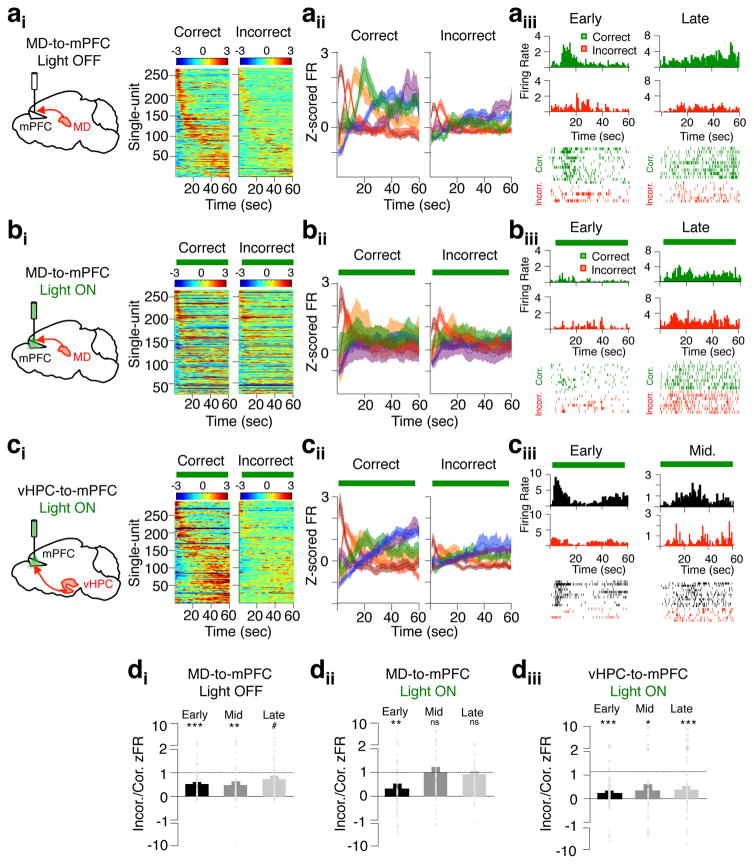
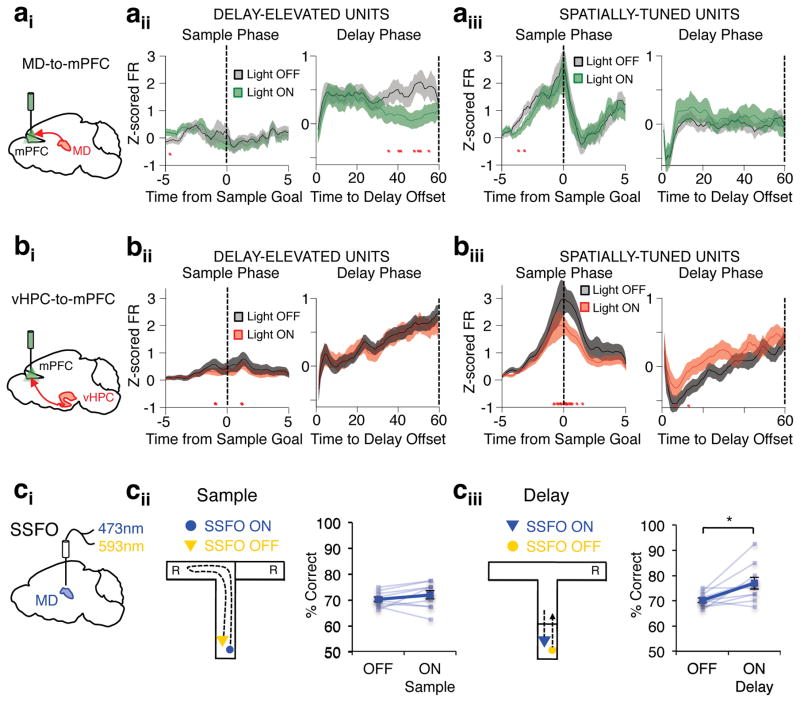
The mediodorsal thalamus (MD) shares reciprocal connectivity with the prefrontal cortex (PFC), and decreased MD-PFC connectivity is observed in schizophrenia patients. Patients also display cognitive deficits including impairments in working memory, but a mechanistic link between thalamo-prefrontal circuit function and working memory is missing. Using pathway-specific inhibition, we found directional interactions between mouse MD and medial PFC (mPFC), with MD-to-mPFC supporting working memory maintenance and mPFC-to-MD supporting subsequent choice. We further identify mPFC neurons that display elevated spiking during the delay, a feature that was absent on error trials and required MD inputs for sustained maintenance. Strikingly, delay-tuned neurons had minimal overlap with spatially tuned neurons, and each mPFC population exhibited mutually exclusive dependence on MD and hippocampal inputs. These findings indicate a role for MD in sustaining prefrontal activity during working memory maintenance. Consistent with this idea, we found that enhancing MD excitability was sufficient to enhance task performance.


Conflict of interest statement

COMPETING FINANCIAL INTERESTS

The authors declare no competing financial interests.

Figures

Figure 1
Figure 1. Reciprocal MD-mPFC activity is required for spatial working memory
(a) Schema of viral delivery of AAV1-CBA-Synaptophysin-GFP for visualization of MD-to-PFC synaptic contacts. (b) Top left: Representative expression of synaptophysin-GFP in MD cell bodies. Top Middle: Synaptophysin-GFP+ MD terminals in PFC. Bottom/Right: Confocal images of synaptophysin-GFP+ MD terminals in medial prefrontal (bottom; mPFC) and dorsolateral orbitofrontal cortex (right; OFC). (c) Schema of a single trial of the DNMS T-maze. “R” indicates reward locations. (d) Schema of viral delivery of AAV5-hSyn-eArch3.0-eYFP to MD and illumination of MD-to-mPFC (left) or MD-to-OFC (right) terminals within single animals. (e) Percent correct performance in the DNMS T-maze at 10s (left) or 60s (right) delays in eYFP (black trace) and eArch-expressing (green trace) mice (eYFP n=13; eArch n=12; 10s data: 2-tailed, rmANOVA light x group, p=0.67; 60s data: 2-tailed, rmANOVA light x group, **p=0.003, F(2,46)=6.73; 2-tailed, paired t-test eArch OFF vs. mPFC, *p=0.02, t(11)= −2.74). (f) Left: Schema of viral delivery of eArch-eYFP or eYFP to the mPFC and illumination of mPFC-to-MD terminals. Middle: Representative viral expression in mPFC cell bodies. Right: mPFC terminals projecting to the MD (outlined in white and parceled by lateral, central and medial subnuclei). (g) As in e but for mice receiving mPFC-to-MD terminal illumination (eYFP n=13; eArch n=14; 10s data: 2-tailed, rmANOVA light x group, p=0.35; 60s data: 2-tailed, rmANOVA light x group, **p=0.002, F(1,25)=12.1; 2-tailed, paired t-test eArch light ON vs. OFF, **p=0.001, t(13)=4.19). Error bars depict SEM throughout.
Figure 2
Figure 2. Discrete task phases depend on distinct MD-mPFC interactions
(a) Schema of terminal illumination restricted to the sample, delay or choice phase of the DNMS T-maze. (b) Percent correct performance in mice receiving MD-to-mPFC terminal illumination (eYFP, n=11, black; eArch, n=17, green) during the sample phase (rmANOVA light x group, p=0.59), the delay phase (2-tailed rmANOVA light x group, *p=0.016, F(1,26)=6.7; 2-tailed, paired t-test eArch light OFF vs. ON Delay, ***p=0.0003, t(16)=4.57) or choice phase (2-tailed rmANOVA light x group, p=0.51). (c) DNMS T-maze performance for mice receiving mPFC-to-MD terminal illumination (eYFP, n=13, black; eArch, n=14, green) during the sample phase (2-tailed rmANOVA light x group, p=0.94), delay phase (2-tailed rmANOVA light x group, #p=0.073, F(1,25)=3.51) or choice phase (rmANOVA light x group, *p=0.02, F(1,25)=6.62; 2-tailed, paired t-test eArch light OFF vs. ON Choice, **p=0.002, t(13)=3.85). Error bars depict SEM throughout.
Figure 3
Figure 3. MD-mPFC functional directionality dynamically shifts across task phases
(a) Schema of simultaneous recording of MD LFP and mPFC single-units. (b) Representative mPFC single-unit phase-locked to MD LFP filtered in the beta frequency range (13–30Hz). Left: Red line depicts filtered beta oscillation overlaid on raw MD LFP (black line). Vertical black lines below indicate simultaneous mPFC spike times with grey shading displaying the trough of the simultaneously recorded MD beta oscillation. Right: Polar plot of the distribution of mPFC spikes relative to a single cycle of the MD beta oscillation for the same unit. (ci) Normalized phase-locking values (pairwise phase comparison (PPC)) for each mPFC neuron during the sample phase of the DNMS T-maze after shifting mPFC spikes in 10ms steps +/−100ms. Only mPFC units with peak PPC values meeting Bonferonni-corrected p values are included (Rayleigh’s circular test, p<0.05/21) (165/547). (cii) Histogram displaying the lag at which the peak PPC value for each neuron in (cii) occurred. Black triangle indicates mean lag value across the population (mean=3.5ms; 2-tailed Signrank, ns: p=0.38; z(164)=0.88). (di–ii) as in ci–ii but for significantly phase-locked units in the delay phase (246/547; mean=−14.8; 2-tailed Signrank, ***p=0.000005; z(245)= −4.58). (ei–ii) as in ci–ii but for significantly phase-locked units in the choice phase (153/547; mean=13.3; 2-tailed Signrank, ***p=0.0002; z(152)=3.68). (f) Cumulative distribution of significantly phase-locked units during the sample phase across lag times. Solid green curve indicates light off trials and dotted green curve indicates light on sample trials (2-sample Kolmogorov-Smirnov; ns, p=0.98; k=0.049). Horizontal black line indicates 50% proportion, while vertical black line indicates lag time of 0. (g) As in f but for significantly phase-locked units during the delay phase on light off trials (solid red curve) and light on delay trials (dotted red curve) (2-sample Kolmogorov-Smirnov; *p=0.01; k=0.14). (h) As in f but for significantly phase-locked units during the choice phase on light off trials (solid blue curve) and light on delay trials (dotted blue curve) (2-sample Kolmogorov-Smirnov; ns, p=0.28; k=0.11).
Figure 4
Figure 4. mPFC spatial-tuning is absent during the delay phase and independent of MD input
(a) Schema of behavior timestamps for spike alignment on a single DNMS T-maze trial. (b) Example mPFC single-unit spatially-tuned to left arm runs. Top: Peri-event normalized spike rates on left arm (red trace) or right arm (black trace) trials (top; 100ms bins for sample and choice, 1s bins for delay). Bottom: Raster plots of raw spike times on left and right trials. Colored lines in raster plots display trial x trial event timestamps indicated in a above. (c) Normalized firing rate on light off preferred arm trials (red trace) or light off unprefered arm trials (black trace) averaged across all eArch single-units (891 units from 9 eArch mice). Arm preference was determined from firing rate differences on sample arm runs (ci–iii) or choice arm runs (cii–iii, insets). (d) As in c, but for trials in which MD-to-mPFC terminals were inhibited during the sample (di) or delay (dii) phases. In all normalized firing rate plots, red asterisks indicate bins with 2-tailed Wilcoxon sign-rank (population comparison) or 2-tailed Wilcoxon rank-sum (single-unit comparison) significance at Bonferroni-corrected p values (p<0.0005 sample and choice; p<0.00083 delay). Error bars depict SEM throughout.
Figure 5
Figure 5. Delay-elevated mPFC neurons exhibit temporally sparse and sequential activity that tiles the delay phase
(a) Normalized firing rates during the delay phase of the DNMS T-maze in a subpopulation of mPFC single-units that exhibit significant elevations in delay period activity (266/891 units from a cohort of 9 mice expressing eArch in the MD). Normalized firing rates were averaged across all light off trials. Single-units were then sorted by time of peak firing rate. (bi) Mean z-scored firing rate of delay-elevated units identified in a after clustering into six groups based on temporal correlation in firing rates. Inset: Proportion of all mPFC neurons in the data set that exhibited significant delay-elevated activity (red slice, 30%). (bii) Time-triggered histogram and trial-by-trial raster plot of an example delay-elevated mPFC unit. Histograms and rasters of raw spikes from real data (top) and shuffled versions of the data (bottom) are shown. (biii) Delay-elevated neurons identified as in a and clustered as in bi but from a trial-by-trial shuffled version of the entire data set. Inset: Proportion of all mPFC neurons in the shuffled data set that exhibit significant delay-elevated activity according to criterion used in a (88/891, 10%). (c,d) As in a and bi but for mPFC units obtained from an independent cohort of 6 mice expressing eArch in the vHPC. (di) Inset: 290/800 units (36%) exhibit delay-elevated activity according to criterion in a. (diii) Inset: 47/800 units exhibit delay-elevated activity following trial-by-trial shuffling of the entire data set as in bii. Example single units are colored according to their clustered group in bi and di, respectively.
Figure 6
Figure 6. Delay-elevated mPFC activity is diminished on incorrect trials and selectively depends on MD inputs
(ai) Normalized firing rates of delay-elevated mPFC neurons during light off trials, and parsed by correct or incorrect behavioral performance (266/8919 units from mice expressing eArch in the MD). (aii) Mean normalized firing rate of delay-elevated units after clustering into six groups based on temporal correlations in firing rates. (aiii) Time-triggered histograms and trial-by-trial raster plots from representative delay-elevated units exhibiting early (left) or late (right) delay peaks. Only spikes from light off trials are included, and are plotted separately for correct (green) or incorrect (red) trials. (bi–iii) as in ai–iii but for trials in which MD-to-mPFC inputs were inhibited during the delay phase. The same single-units shown in the light off condition in aiii are shown in the MD-to-mPFC light on delay condition in biii. (ci–iii) As in ai–iii but for delay-elevated mPFC units obtained from 6 mice expressing eArch in the vHPC (290/800). Only trials in which vHPC-to-mPFC inputs were inhibited during the delay are included. (di) Ratio of correct/incorrect normalized firing at time of peak firing on all light off trials, averaged across units grouped by early (91), middle (83) or late (92) peak times. Groupings reflect the first two, middle two or last two clusters in aii. Overlaid circles display all individual single-units. Significance was determined using a 2-tailed t-test against a distribution with mean of 1 (***p<0.001, t(90)= −5.65; **p=0.0015, t(82)= −3.29; #p=0.07, t(91)= −1.82). (dii) As in (di) but for MD-to-mPFC light on delay trials only (**p=0.003, t(90)= −3.07; not significant (ns)). (diii) As in di but for vHPC-to-mPFC light on delay trials only (***p<0.001, t(102)= −6.24; *p=0.018, t(64)=2.42; ***p=0.0001, t(121)= −3.97). Error bars depict SEM throughout.
Figure 7
Figure 7. MD activity sustains mPFC delay activity in an input and task phase specific manner
(a) Normalized firing rates in delay-elevated (266/891) (aii) and spatially-tuned (250/891) (aiii) mPFC neurons obtained from 9 mice expressing eArch in the MD and receiving task-phase specific MD-to-mPFC inhibition during either the sample or delay phases of the DNMS T-maze. Only correct trials are included, which are parsed by light off (black trace) or light on (green trace) conditions. Red asterisks denote bins with Wilcoxon sign-rank significance (p<0.0005 sample and choice; p<0.00083 delay). (b) As in a but for mPFC neurons obtained from 6 mice expressing eArch in the vHPC (800 units) and receiving task-phase specific vHPC-to-mPFC inhibition. Delay-elevated: 290/800. Spatially-tuned: 250/800. (ci) Schema of stabilized step function opsin (SSFO, hChr2(C128S/D156A) activation and deactivation of MD activity. (cii) Schema of SSFO activation at sample phase onset and deactivation at sample phase offset (left). Percent correct performance in the DNMS T-maze in 9 SSFO-expressing mice during light off and on sample trials (right). Transparent blue lines reveal individual mouse performance, while thick blue line indicates group mean performance (2-tailed, paired t-test: p=0.26; t(8)= −1.22). (ciii) As in cii but for mice receiving SSFO activation of the MD at delay onset and deactivation at delay offset (2-tailed rmANOVA on all trial types, Light effect: p= F(7)=7.75, p<0.01; 2-tailed, paired t-test, light off vs. on delay: p=0.014, t(8)= −3.14). Error bars depict SEM throughout.

Comment in

  • Working memory: Persistence is key.
    Bray N. Bray N. Nat Rev Neurosci. 2017 Jul;18(7):385. doi: 10.1038/nrn.2017.70. Epub 2017 May 25. Nat Rev Neurosci. 2017. PMID: 28541347 No abstract available.
  • The thalamic paradox.
    Acsády L. Acsády L. Nat Neurosci. 2017 Jun 27;20(7):901-902. doi: 10.1038/nn.4583. Nat Neurosci. 2017. PMID: 28653685 No abstract available.

References

    1. Fuster JM. Anatomy, Physiology, and Neuropsychology of the Frontal Lobe. 2. Raven; New York: 1989. The Prefrontal Cortex.
    1. Minzenberg MJ, Laird AR, Thelen S, Carter CS, Glahn DC. Meta-analysis of 41 functional neuroimaging studies of executive function in schizophrenia. Arch Gen Psychiatry. 2009;66:811–822. doi: 10.1001/archgenpsychiatry.2009.91. - DOI - PMC - PubMed
    1. Weinberger DR, Berman KF. Prefrontal function in schizophrenia: confounds and controversies. Philos Trans R Soc Lond B Biol Sci. 1996;351:1495–1503. doi: 10.1098/rstb.1996.0135. - DOI - PubMed
    1. Perlstein WM, Carter CS, Noll DC, Cohen JD. Relation of prefrontal cortex dysfunction to working memory and symptoms in schizophrenia. Am J Psychiatry. 2001;158:1105–1113. doi: 10.1176/appi.ajp.158.7.1105. - DOI - PubMed
    1. Mitchell AS. The mediodorsal thalamus as a higher order thalamic relay nucleus important for learning and decision-making. Neuroscience and biobehavioral reviews. 2015;54:76–88. - PubMed

LinkOut - more resources