. 2017 Jun;20(6):815-823.
doi: 10.1038/nn.4559. Epub 2017 May 8.

Cell-specific pallidal intervention induces long-lasting motor recovery in dopamine-depleted mice

Affiliations

Cell-specific pallidal intervention induces long-lasting motor recovery in dopamine-depleted mice

Kevin J Mastro et al. Nat Neurosci. 2017 Jun.

Abstract

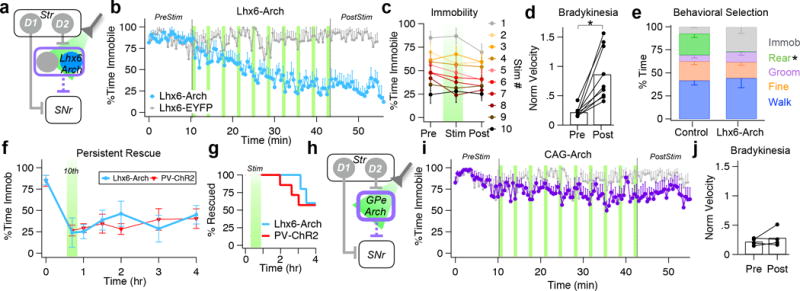
The identification of distinct cell types in the basal ganglia has been critical to our understanding of basal ganglia function and the treatment of neurological disorders. The external globus pallidus (GPe) is a key contributor to motor suppressing pathways in the basal ganglia, yet its neuronal heterogeneity has remained an untapped resource for therapeutic interventions. Here we demonstrate that optogenetic interventions that dissociate the activity of two neuronal populations in the GPe, elevating the activity of parvalbumin (PV)-expressing GPe neurons over that of Lim homeobox 6 (Lhx6)-expressing GPe neurons, restores movement in dopamine-depleted mice and attenuates pathological activity of basal ganglia output neurons for hours beyond stimulation. These results establish the utility of cell-specific interventions in the GPe to target functionally distinct pathways, with the potential to induce long-lasting recovery of movement despite the continued absence of dopamine.


Figures

Figure 1
Figure 1. Global GPe stimulation does not rescue movement in DD mice
(a) Schematic of global optogenetic stimulation in the GPe. GPe projections to the SNr are represented as a dashed line to indicate omission of the STN. (b) Percentage of time spent in the immobile state before, during, and after stimulation (n = 4). Stimulation epochs are indicated with vertical blue lines. (c) Overlay of immobility immediately before (pre), during (stim), and after (post) each light pulse. (d) Movement velocities, normalized to dopamine intact controls, before (PreStim, b) and after stimulation (PostStim, b) (t(3) = −0.450, p = 0.683, paired t-test). Bars denote population averages; connected circles show data for individual mice. (e) Schematic of direct pathway stimulation with D1-ChR2. (f) Percentage of time spent in the immobile state before, during, and after stimulation (n = 4). (g) Overlay of immobility immediately before (pre), during (stim), and after (post) each light pulse. (h) Movement velocities, normalized to dopamine intact controls, before (PreStim, f) and after stimulation (PostStim, f) (t(3) = 4.441, p = 0.02, paired t-test). Bars denote population averages; connected circles show data for individual mice. (i) Schematic of GPe network recording during global stimulation. (j) Light-evoked responses of ten example GPe multiunits. (k) Average multiunit responses (n = 68 across 3 animals) over the course of a 30 sec optical stimulus, displayed as z-score (z = 1.65, p = 0.0495, one tailed z-test). Shaded area, sem. (l) Average firing rates (normalized to baseline) of units (n = 34 across 3 animals) held across all 10 stimulations. Each bin denotes firing in 30 sec bins immediately before and after each stimulation (blue). Error bars, sem.
Figure 2
Figure 2. Selective stimulation of PV-GPe neurons rescues movement persistently in DD mice
(a) Schematic of optogenetic stimulation of PV-ChR2. (b) Percentage of time spent in the immobile state before, during, and after stimulation (PV-ChR2: n = 10, PV-EYFP: n = 8). (c) Overlay of immobility immediately before (pre), during (stim), and after (post) each light pulse. (d) Movement velocities, normalized by dopamine intact controls, before (PreStim, b) and after stimulation (PostStim, b) (t(9) = 6.757, p = 0.00008, paired t-test). Bars denote population averages; connected circles show data for individual mice. (e) Duration of prokinetic effects of PV-ChR2 (n = 10) and D1-ChR2 (n = 4) stimulation (Main EffectTime: F[6, 54] = 7.672, p < 0.0001; Main EffectCondition: F[1, 9]= 10.04, p = 0.0114; Interaction EffectTime × Condition: F[6, 54] = 6.793, p < 0.0001, Two-way RM-ANOVA). (f) Percentage of animals rescued after D1-ChR2 or PV-ChR2 over the post stimulation period. Blue bar (Stim) represents full optogenetic manipulation. (g) Cumulative success rate over the 5 min trial for PV-ChR2 (n = 8/10) and PV-EYFP (n = 1/5) mice to approach food dish on opposing end of cage (χ(1)= 5.000, p = 0.0253, chi-squared test) (h) Comparison of behavioral patterns expressed by PV-ChR2 mice (n = 10) during the PostStim period (b) compared to dopamine intact controls (n = 7). The average time engaged in each behavior is expressed as a percentage of total time. Only immobility (p = 0.003, Mann Whitney U) and rearing (p = 0.0001, Mann Whitney U) were significantly different between conditions. Error bars, sem.
Figure 3
Figure 3. Local response during PV-ChR2 stimulation directly inhibits other high-firing GPe neurons
(a) Schematic of GPe network recording during PV-ChR2 stimulation. (b) Light-evoked responses of ten single units during onset of a 30 sec pulse. (c) Average z-score of excited (red, n = 18/39 across 3 animals) and inhibited (blue, n = 14/39) neurons during a 30 sec optical pulse. Shaded area, sem. (d) Firing rates of individual neurons before, during (time 0), and in 10 sec bins after a 30 sec light pulse (Excited: t(17) = −4.913, p < 0.0001, paired t-test, Inhibited: t(13) = 4.789, p < 0.0001, paired t-test). Population averages are shown as thick, colored lines. (e) Average firing rates of units held across all ten 30 sec pulses for excited (top, n = 5 across 3 animals) and inhibited units (bottom, n =4 across 2 animals). Each bin denotes firing in 30 sec bins immediately before and after each stimulation (colored bars). Error bars, sem. (f) Schematic of GPe network during Lhx6-Arch stimulation. (g) Light-evoked responses of ten single units during onset of a 30 sec pulse. (h) Average z-score of inhibited (blue, n = 27/42 across 3 animals) and no change (grey, n = 15/42) neurons during a 30 sec optical pulse. Shaded area, sem. (i) Firing rates of individual neurons before, during (time 0), and in 10 sec bins after a 30 sec light pulse (Inhibited: t(26) = 9.888, p < 0.0001, paired t-test, No change: t(14) = −1.126, p = 0.279, paired t-test). Population averages are shown as thick, colored lines. (j) Average firing rates of inhibited units held across all ten 30 sec pulses (n = 11 across 3 animals). Each bin denotes firing in 30 sec bins immediately before and after each stimulation (colored bars). Error bars, sem. (k) Summary of average firing rates before, during, and after 30 sec stimulations of PV-ChR2, and Lhx6-Arch. Error bars, sem.
Figure 4
Figure 4. Selective suppression of Lhx6-GPe neurons rescues movement persistently in DD mice
(a) Schematic of optogenetic inhibition of Lhx6-GPe neurons. (b) Percentage of time spent in the immobile state before, during, and after Lhx6-Arch (n = 9) and Lhx6-EYFP (n = 7). (c) Overlay of immobility immediately before (pre), during (stim), and after (post) each light pulse (d) Movement velocities, normalized by dopamine intact controls, before (PreStim, b) and after stimulation (PostStim, b) (p = 0.002, paired t-test). Bars denote population averages; connected circles show data for individual mice. (e) Comparison of behavioral patterns expressed by Lhx6-Arch (n = 7) mice during the PostStim period (b) compared to dopamine intact controls (n = 6). The average time engaged in each behavior is expressed as a percentage of total time. Only immobility rearing (p = 0.001, Mann Whitney U) was significantly different between conditions. (f) Duration of prokinetic effects of Lhx6-Arch (n = 5) and PV-ChR2 (n = 7) plotted for reference (Main EffectTime: F[7, 70] = 7.994, p < 0.0001; Main EffectCondition: F[1, 10]= 0.5855, p = 0.462; Interaction EffectTime × Condition: F[7, 70] = 1.358, p = 0.2367, Two-way RM-ANOVA).(g) Percentage of animals rescued after Lhx6-Arch or PV-ChR2 over the post stimulation period. Green bar (Stim) represents full optogenetic manipulation.(h) Schematic of optogenetic inhibition of all GPe neurons. (i) Percentage of time spent in the immobile state before, during, and after CAG-Arch (n = 4) and Lhx6-EYFP (n = 7). (j) Movement velocities, normalized by dopamine intact controls, before (PreStim, g) and after stimulation (PostStim, g) (p = 0.393, paired t-test). Bars denote population averages; connected circles show data for individual mice. Error bars, sem.
Figure 5
Figure 5. The induction of persistent behavioral rescue is cell-type specific
(a) Schematic of optogenetic stimulation of Lhx6-GPe neurons. (b) Percentage of time spent in the immobile state before, during, and after Lhx6-ChR2 stimulation (n = 5). (c) Duration of prokinetic effects in Lhx6-ChR2 mice. Data from PV-ChR2 (n = 10) and D1-ChR2 (n = 4) is re-plotted for reference (Main EffectTime: F[6, 78] = 10.25, p < 0.0001; Main EffectCondition: F[2, 13]= 7.177, p = 0.0079; Interaction EffectTime × Condition: F[12, 78] = 3.947, p < 0.0001, Two-way RM-ANOVA).. (d) Schematic of optogenetic suppression of PV-GPe neurons. (e) Percentage of time spent in the immobile state before, during, and after PV-Arch stimulation (n = 4). (f) Schematic of GPe manipulations that globally alter GPe physiology and those that shift the relative balance of PV and Lhx6 neurons to successfully induce behavioral rescue (PV-ChR2, Lhx6-Arch). Error bars, sem.
Figure 6
Figure 6. PV-ChR2 and Lhx6-Arch reverse pathological bursting activity persistently
(a) Cumulative distribution plots of burst firing in the SNr of naive (black) and bilaterally depleted mice (Acute, dotted) (b) Representative raster of single unit activity in Naive and Acute conditions (c) Schematic of simultaneous GPe stimulation (bilateral, not depicted) and SNr recording (d) Representative single unit activity before (pre), between stimulations (inter-stim) and after (post) stimulation of the PV-GPe neurons (e) Distribution of burst firing before (pre) and after (post) PV-ChR2 stimulation. Acute distribution (dotted) replotted for reference. (f) Histogram of burst firing before (pre, top) and after (post, bottom) PV-ChR2 stimulation (g) Fraction of ‘Bursty’ units before and after PV-ChR2 stimulation (h) Distribution of burst firing before (pre) and after (post) hSyn-ChR2 stimulation (i) Histogram of burst firing before (pre, top) and after (post, bottom) hSyn-ChR2 stimulation (j) Fraction of ‘Bursty’ units before and after hSyn-ChR2 stimulation (k–l) Single unit activity before, during and after PV-ChR2 (n = 7 across 3 animals) or hSyn-ChR2 (n = 3 across 2 animals). Error bars, sem. (m) Distribution of burst firing before (pre) and after (post) Lhx6-Arch inhibition (n) Histogram of burst firing before (pre, top) and after (post, bottom) Lhx6-Arch inhibition (o) Fraction of ‘Bursty’ units before and after Lhx6-Arch inhibition. (p) Fraction of ‘Bursty’ units over the course of the three hour post-stimulation period across 3 animals per condition. Error bars, sem.

Comment in

Similar articles

Cited by

References

    1. Saunders A, et al. A direct GABAergic output from the basal ganglia to frontal cortex. Nature. 2015;521:85–89. - PMC - PubMed
    1. Mastro KJ, Bouchard RS, Holt HA, Gittis AH. Transgenic mouse lines subdivide external segment of the globus pallidus (GPe) neurons and reveal distinct GPe output pathways. The Journal of neuroscience. 2014;34:2087–2099. - PMC - PubMed
    1. Kita H. Globus pallidus external segment. Progress in brain research. 2007;160:111–133. - PubMed
    1. Bevan MD, Magill PJ, Terman D, Bolam JP, Wilson CJ. Move to the rhythm: oscillations in the subthalamic nucleus-external globus pallidus network. Trends Neurosci. 2002;25:525–531. - PubMed
    1. Mallet N, et al. Parkinsonian beta oscillations in the external globus pallidus and their relationship with subthalamic nucleus activity. The Journal of neuroscience. 2008;28:14245–14258. - PMC - PubMed

MeSH terms