. 2017 Jun;24(6):525-533.
doi: 10.1038/nsmb.3408. Epub 2017 May 8.

The myosin mesa and the basis of hypercontractility caused by hypertrophic cardiomyopathy mutations

Affiliations

The myosin mesa and the basis of hypercontractility caused by hypertrophic cardiomyopathy mutations

Suman Nag et al. Nat Struct Mol Biol. 2017 Jun.

Abstract

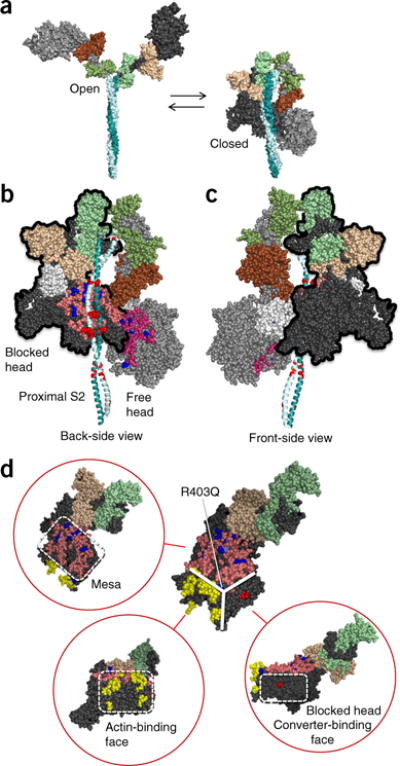
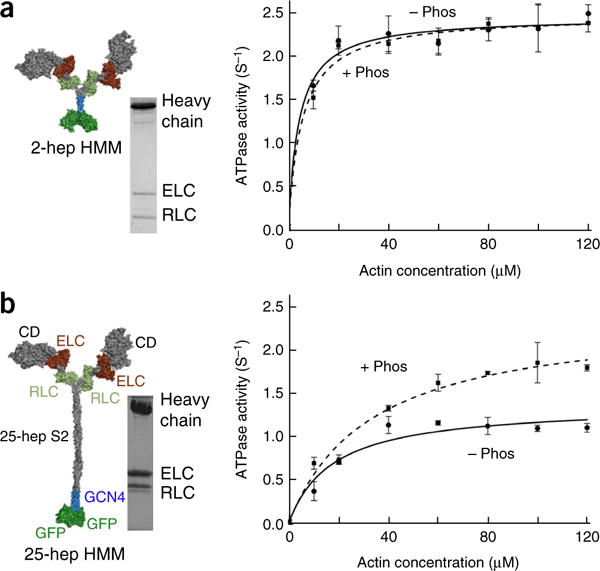
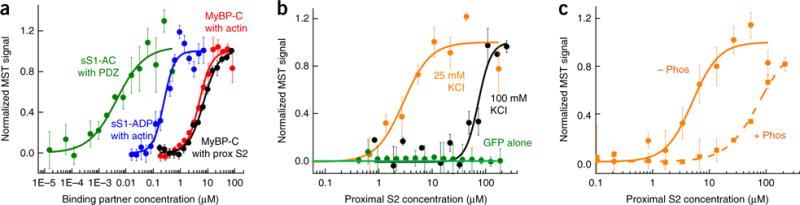
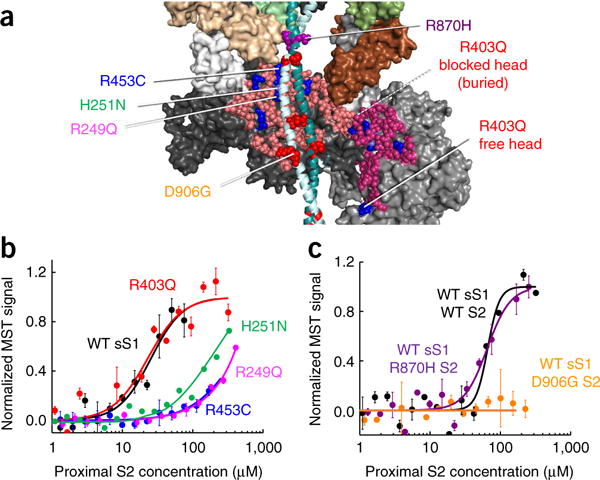
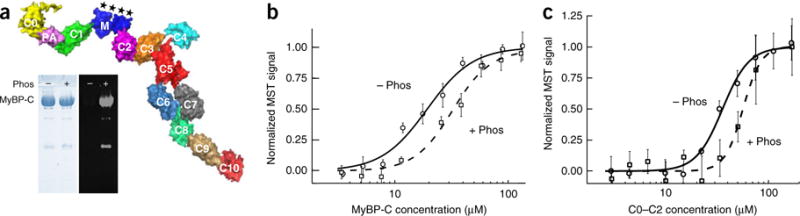
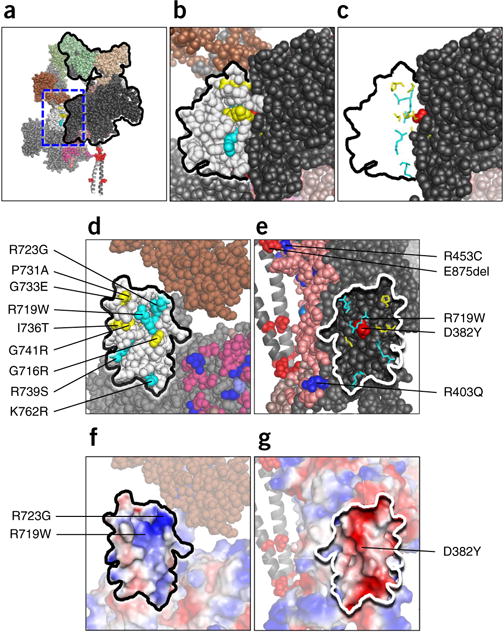
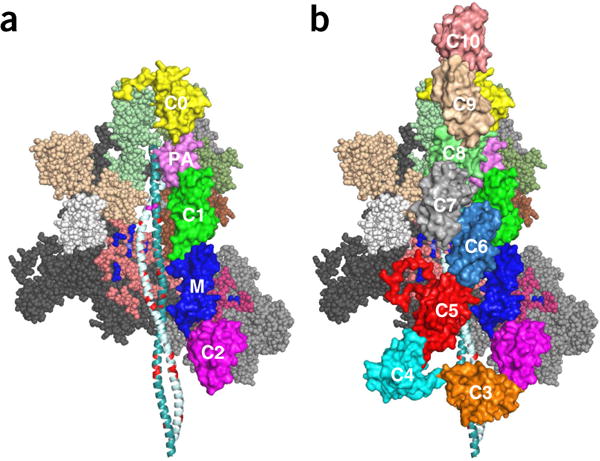
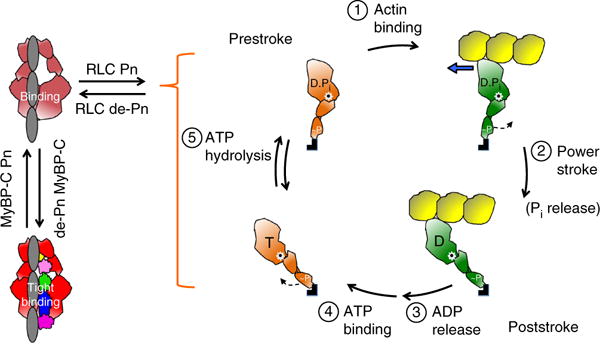
Hypertrophic cardiomyopathy (HCM) is primarily caused by mutations in β-cardiac myosin and myosin-binding protein-C (MyBP-C). Changes in the contractile parameters of myosin measured so far do not explain the clinical hypercontractility caused by such mutations. We propose that hypercontractility is due to an increase in the number of myosin heads (S1) that are accessible for force production. In support of this hypothesis, we demonstrate myosin tail (S2)-dependent functional regulation of actin-activated human β-cardiac myosin ATPase. In addition, we show that both S2 and MyBP-C bind to S1 and that phosphorylation of either S1 or MyBP-C weakens these interactions. Importantly, the S1-S2 interaction is also weakened by four myosin HCM-causing mutations but not by two other mutations. To explain these experimental results, we propose a working structural model involving multiple interactions, including those with myosin's own S2 and MyBP-C, that hold myosin in a sequestered state.


Conflict of interest statement

COMPETING FINANCIAL INTERESTS

The authors declare competing financial interests: details are available in the online version of the paper.

Figures

Figure 1
Figure 1
Structural model of sequestered heads of human β-cardiac myosin. The model is based on the 3D reconstruction of tarantula skeletal myosin thick filaments (PDB 3DTP). (a) A short version of myosin HMM, showing the first 123 residues of the coiled-coil S2 domain, is illustrated in its open and closed states, which are in equilibrium. The templates used to model the poststroke structure were obtained from the human β-cardiac myosin motor domain supplemented with the rigor structure from the squid myosin motor domain (Online Methods). (b) The back-side view (side facing the myosin bipolar thick filament) of the sequestered state, showing the potential interaction between different domains of the two heads. The heavy-chain residues of the S1 head on the left (blocked head, outlined in black) are colored pink (mesa residues), dark blue (arginine HCM mutations), light blue (a histidine HCM mutation), white (the converter domain), and dark gray (all remaining residues). The ELC is colored light brown, and the RLC is light green. The heavy-chain residues of the S1 head on the right (free head) are colored dark pink (mesa residues), dark blue (arginine HCM mutations), light blue (a histidine HCM mutation), and light gray (all remaining residues). The ELC is colored dark brown, and the RLC is colored dark green. The proximal S2 tail is shown in teal, with glutamate and aspartate residues mutated in HCM in red. (c) The front-side view of the sequestered state showing the blocked head (outlined in black) interacting with the converter domain (white) of the free head (left). (d) The catalytic domain of human β-cardiac myosin forms a pyramidal structure (thick white solid lines). The three surfaces are the mesa (pink residues with arginine HCM mutations shown in dark blue), the actin-binding interface (yellow, according to the residues involved, as discussed), and the blocked-head surface (dark gray) that abuts the converter domain of the free head in the folded, sequestered-head state (marked by the red residue Asp382, whose mutation to tyrosine is an early-onset HCM mutation). These different interfaces are shown in different orientations of the myosin molecule in the red circles. Coordinates of the homology modeled folded-back human β-cardiac myosin are available for download (MS01, Supplementary Data Set 1).
Figure 2
Figure 2
Actin-activated ATPase activities of phosphorylated- and nonphosphorylated-RLC forms of 2-hep and 25-hep HMM. (a) Actin-activated ATPase activity of 2-hep HMM, phosphorylated (+ Phos, dashed curve) and nonphosphorylated (− Phos, solid curve). An SDS–PAGE gel and a structural schematic of the architecture of the 2-hep HMM structure are shown on the left. This construct has 2-heptad repeats of the S2 region. Gray, heavy-chain residues of the S1 heads and S2; brown, ELCs; light green, RLCs; blue, GCN4; green, GFP. (b) Actin-activated ATPase activity of 25-hep HMM, phosphorylated (+ Phos, dashed curve) and nonphosphorylated (− Phos, solid curve). An SDS–PAGE gel of 25-hep HMM and a structural schematic of its architecture are shown on the left. The two S1 heads (1–841 residues of each, containing the catalytic domain (CD) and both the human cardiac ELC- and RLC-binding sites) are linked by 25-heptad repeats of the S2 region followed by a GCN4 leucine zipper to ensure dimerization. C-terminal to the GCN4 are two GFPs. Data points are mean and s.e.m. from n = 2 independent experiments. Source data are available online.
Figure 3
Figure 3
Binding of sS1 and 2-hep HMM to proximal S2 by using MST. (a) MST assays for four protein-protein interactions yielded Kd values within two-fold of those reported in earlier studies using other techniques: sS1 with a C-terminal eight-residue affinity tag (RGSIDTWV) (sS1-AC) binding to PDZ (~5 nM, green), sS1 binding to actin in the ADP state (~250 nM, blue),, MyBP-C binding to actin (~5 μM, red), and MyBP-C binding to proximal S2 (~7 μM, black). (b) Binding of GFP-tagged sS1 to proximal S2 at 25 mM (orange) and 100 mM (black) KCl. GFP alone showed no binding (green circles). (c) Binding of GFP-labeled 2-hep HMM to proximal S2 at 25 mM KCl. Nonphosphorylated (− Phos) and phosphorylated (+ Phos) 2-hep HMM are compared. All data shown in graphs are mean and s.e.m. from n = 3 measurements from a single set of protein preparations; source data are available online. Data from multiple preparations are summarized in Supplementary Table 1.
Figure 4
Figure 4
Effects of HCM mutations on the interaction of human β-cardiac sS1 with proximal S2. (a) Model of S1 of the blocked head interacting with proximal S2, marking the positions of four mesa HCM mutations and two proximal-S2 mutations used for binding experiments. Also shown is the free head interacting with the blocked head. Arg453 lies in the mesa domain and is predicted to interact with the proximal S2, whereas Arg403 is buried and away from the interacting site. Similarly, Asp906 on the proximal S2 is predicted to interact with the mesa, but Arg870 is not. (b) Binding of GFP-labeled WT (black), R403Q (red), R453C (blue) R249Q (magenta), and H251N (green curve; data reproduced from Adhikari et al.) sS1 to proximal S2. (c) Binding of GFP-labeled WT sS1 to WT proximal S2 (black), and R870H (purple) and D906G (orange) mutant proximal S2. Graphs in b and c show mean and s.e.m. from n = 3 measurements from a single set of protein preparations; source data are available online. Data from multiple preparations are summarized in Supplementary Table 1.
Figure 5
Figure 5
Binding of human β-cardiac sS1 to human cardiac MyBP-C. (a) Surface rendition of full-length human cardiac MyBP-C (details of the model in Online Methods). The C0–C10 domains were connected C-terminal to N-terminal in PyMOL to obtain the image shown. There are four serine phosphorylation sites (asterisks) on the M domain (blue) that regulate MyBP-C function. The left panel of the gel shows a Coomassie gel of dephosphorylated (−) and phosphorylated (+) full-length human cardiac MyBP-C. The right panel shows ProQ-Diamond staining of the same gel. Lower-molecular-weight contaminants are also phosphorylated (probably proteolytic fragments of MyBP-C). (b) Binding of Cy5-labeled sS1 to dephosphorylated (− Phos, solid curve) and phosphorylated (+ Phos, dashed curve) full-length MyBP-C. (c) Binding of Cy5-labeled sS1 to dephosphorylated (− Phos, solid curve) and phosphorylated (+ Phos, dashed curve) C0–C2. Data points in graphs in b and c are mean and s.e.m. from n = 3 measurements from a single set of protein preparations; source data are available online. Data from multiple preparations are summarized in Supplementary Table 1.
Figure 6
Figure 6
Structural features of the S1-S1 interaction in the homology-modeled human β-cardiac S1. (a) The front view of the sequestered complex shows the association of a surface adjacent to the mesa of the blocked head (black outline) with the converter domain of the free head (white). (b) The area in the dashed blue box in a is enlarged to focus on the interface between the blocked head (dark gray) and the converter (white residues, black outline) of the free head. Converter mutations are cyan for arginine and lysine residues and yellow for uncharged residues. (c) The nine HCM residues shown in stick format with the remainder of the converter-domain residues removed. The alignment along the binding face of the two S1 heads is shown. (d) The image in c rotated 90° counterclockwise about the vertical axis defining the binding interface. All nine HCM residues near the surface of the converter at the S1-S1 junction. (e) The image in c, rotated 90° clockwise about the vertical axis defining the binding interface. The positions of the nine HCM residues of the converter domain of the free head are mapped onto the black binding interface of the blocked head. (f) The same image as in d, but shown in vacuum-electrostatics mode in PyMOL. The converter-binding interface is generally positively charged. (g) The same image as in e, but shown in vacuum-electrostatics mode in PyMOL. The blocked-head binding interface is generally negatively charged.
Figure 7
Figure 7
Hypothetical models of the interaction of C0 and C2 and full-length MyBP-C with folded-back, sequestered S1 heads. (a) The backside view of the sequestered state, showing the myosin mesa domains of the two heads cradling the C0–C2 domains of MyBP-C with potential interactions between the C0–C2 and the mesa of the free head (right), illustrating potential interactions between proximal S2 and C1–C2 (ref. 53). The C0 domain (yellow) is bound to the RLCs, and the PA domain (pink) connects to the C1(green)–M (blue)–C2 (magenta) domains, which are bound to proximal S2. (B) Domains C3–C10 have been added to illustrate potential interactions among C5 and C7 with the mesa of the blocked head and possibly proximal S2. These structures, which were assembled by manual placement of the MyBP-C domains onto our folded-back homology model by using PyMOL, should serve as working models for future experiments. All domains of MyBP-C are marked. Coordinates of the homology modeled folded-back human β-cardiac myosin bound to C0-C2 and C0-C10 are available as MS01C0C2 (Supplementary Data Set 2) and MS01C0C10 (Supplementary Data Set 3), respectively.
Figure 8
Figure 8
Schematic drawings of the actin-myosin chemomechanical cycle and hypothesized sequestered states of myosin heads. Pn, phosphorylation. (1) The prestroke S1 (orange) with bound ADP (D) and phosphate (Pi) binds to actin (yellow). (2) While bound to actin (green head), the lever arm swings to the right about a fulcrum point (black dot on white star) to the poststroke position, thus moving the actin filament to the left (blue arrow) with respect to the myosin thick filament. (3) ADP release frees the active site for binding of ATP (T). (4) ATP binding weakens the interaction of S1 with actin and frees the lever arm so that it can cock into the prestroke state. (5) ATP hydrolysis locks the head into the prestroke state. The heads in the cycle are phosphorylated (~P) on the RLC. Heads that are sequestered into a nonfunctional state are shown in two states on the left side of the figure: RLC nonphosphorylated and bound to the S2 tail (light red) and complexed with nonphosphorylated MyBP-C and more firmly locked into the sequestered state (bright red). Other than the interactions shown here, many other interactions, for example those involving the LMM and titin, are probably involved in the sequestered state of myosin, and a common theme for HCM mutations may be that they shift the equilibrium away from the sequestered folded-back state of the myosin heads to the open state, which is functionally accessible for interaction with actin, thus producing the hypercontractility observed clinically.

References

    1. Woodhead JL, et al. Atomic model of a myosin filament in the relaxed state. Nature. 2005;436:1195–1199. - PubMed
    1. Alamo L, et al. Three-dimensional reconstruction of tarantula myosin filaments suggests how phosphorylation may regulate myosin activity. J Mol Biol. 2008;384:780–797. - PMC - PubMed
    1. Zhao FQ, Craig R, Woodhead JL. Head-head interaction characterizes the relaxed state of Limulus muscle myosin filaments. J Mol Biol. 2009;385:423–431. - PMC - PubMed
    1. Pinto A, Sánchez F, Alamo L, Padrón R. The myosin interacting-heads motif is present in the relaxed thick filament of the striated muscle of scorpion. J Struct Biol. 2012;180:469–478. - PubMed
    1. Alamo L, et al. Conserved intramolecular interactions maintain myosin interacting-heads motifs explaining tarantula muscle super-relaxed state structural basis. J Mol Biol. 2016;428:1142–1164. - PMC - PubMed

MeSH terms