Modeling the hepatitis A epidemiological transition in Brazil and Mexico
- PMID: 28481680
- PMCID: PMC5557237
- DOI: 10.1080/21645515.2017.1323158
Modeling the hepatitis A epidemiological transition in Brazil and Mexico
Abstract
Background: Many low- to middle-income countries have completed or are in the process of transitioning from high or intermediate to low endemicity for hepatitis A virus (HAV). Because the risk of severe hepatitis A disease increases with age at infection, decreased incidence that leaves older children and adults susceptible to HAV infection may actually increase the population-level burden of disease from HAV. Mathematical models can be helpful for projecting future epidemiological profiles for HAV.
Methods: An age-specific deterministic, dynamic compartmental transmission model with stratification by setting (rural versus urban) was calibrated with country-specific data on demography, urbanization, and seroprevalence of anti-HAV antibodies. HAV transmission was modeled as a function of setting-specific access to safe water. The model was then used to project various HAV-related epidemiological outcomes in Brazil and in Mexico from 1950 to 2050.
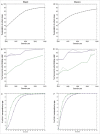
Results: The projected epidemiological outcomes were qualitatively similar in the 2 countries. The age at the midpoint of population immunity (AMPI) increased considerably and the mean age of symptomatic HAV cases shifted from childhood to early adulthood. The projected overall incidence rate of HAV infections decreased by about two thirds as safe water access improved. However, the incidence rate of symptomatic HAV infections remained roughly the same over the projection period. The incidence rates of HAV infections (all and symptomatic alone) were projected to become similar in rural and urban settings in the next decades.
Conclusion: This model featuring population age structure, urbanization and access to safe water as key contributors to the epidemiological transition for HAV was previously validated with data from Thailand and fits equally well with data from Latin American countries. Assuming no introduction of a vaccination program over the projection period, both Brazil and Mexico were projected to experience a continued decrease in HAV incidence rates without any substantial decrease in the incidence rates of symptomatic HAV infections.
Keywords: Latin America; clean water; hepatitis A; mathematical model; seroprevalence; urbanization.
Figures


Similar articles
-
Modeling the hepatitis A epidemiological transition in Thailand.Vaccine. 2016 Jan 20;34(4):555-562. doi: 10.1016/j.vaccine.2015.11.052. Epub 2015 Dec 2. Vaccine. 2016. PMID: 26657185
-
Model-based projections of the population-level impact of hepatitis A vaccination in Mexico.Hum Vaccin Immunother. 2012 Aug;8(8):1099-108. doi: 10.4161/hv.20549. Epub 2012 Aug 1. Hum Vaccin Immunother. 2012. PMID: 22854667 Free PMC article.
-
Seroprevalence of hepatitis A virus in a cross-sectional study in Mexico: Implications for hepatitis A vaccination.Hum Vaccin Immunother. 2013 Feb;9(2):375-81. doi: 10.4161/hv.22774. Epub 2013 Jan 4. Hum Vaccin Immunother. 2013. PMID: 23291940 Free PMC article.
-
Hepatitis A epidemiology in Latin American countries: a 2020 view from a systematic literature review.Expert Rev Vaccines. 2020 Sep;19(9):795-805. doi: 10.1080/14760584.2020.1813575. Epub 2020 Sep 21. Expert Rev Vaccines. 2020. PMID: 32955965
-
Challenges in Management of Hepatitis A Virus Epidemiological Transition in Mexico.Ann Hepatol. 2019 Jan-Feb;18(1):14-22. doi: 10.5604/01.3001.0012.7857. Ann Hepatol. 2019. PMID: 31113583 Review.
Cited by
-
Global burden and trends of viral hepatitis among women of childbearing age from 1990 to 2021.Front Microbiol. 2025 Feb 21;16:1553129. doi: 10.3389/fmicb.2025.1553129. eCollection 2025. Front Microbiol. 2025. PMID: 40061861 Free PMC article.
-
Modelling the Cost-Effectiveness of Hepatitis A in South Africa.Vaccines (Basel). 2024 Jan 24;12(2):116. doi: 10.3390/vaccines12020116. Vaccines (Basel). 2024. PMID: 38400100 Free PMC article.
-
Global burden and trends of acute viral hepatitis among children and adolescents from 1990 to 2019: a systematic analysis of the Global Burden of Disease Study 2019.Hepatol Int. 2024 Jun;18(3):917-928. doi: 10.1007/s12072-024-10640-2. Epub 2024 Mar 26. Hepatol Int. 2024. PMID: 38528292
-
Hepatitis A beyond childhood causing diagnostic and therapeutic challenges in Addis Ababa, Ethiopia.PLoS One. 2025 Aug 13;20(8):e0330212. doi: 10.1371/journal.pone.0330212. eCollection 2025. PLoS One. 2025. PMID: 40802699 Free PMC article.
-
Modeling hepatitis A epidemiological profiles and estimating the pediatric vaccination threshold in the Russian Federation.Front Public Health. 2024 Jun 27;12:1371996. doi: 10.3389/fpubh.2024.1371996. eCollection 2024. Front Public Health. 2024. PMID: 38993707 Free PMC article.
References
-
- Jacobsen KH, Koopman JS. Declining hepatitis A seroprevalence: A global review and analysis. Epidemiol Infect 2004; 132:1005-22; PMID:15635957; https://doi.org/10.1017/S095026880400285710.1017/S0950268804002857 - DOI - PMC - PubMed
-
- Jacobsen KH. The global prevalence of hepatitis A virus infection and susceptibility: A systematic review. Geneva: World Health Organization; 2009. June, 428 p. Report No.: WHO/IVB/10.01.
-
- Franco E, Meleleo C, Serino L, Sorbara D, Zaratti L. Hepatitis A: Epidemiology and prevention in developing countries. World J Hepatol 2012; 4:68-73; PMID:22489258; https://doi.org/10.4254/wjh.v4.i3.6810.4254/wjh.v4.i3.68 - DOI - PMC - PubMed
-
- Armstrong GL, Bell BP. Hepatitis A virus infection in the United States: Model-based estimates and implications for childhood immunization. Pediatrics 2002; 109:839-45; PMID:11986444; https://doi.org/10.1542/peds.109.5.83910.1542/peds.109.5.839 - DOI - PubMed
-
- Ciocca M. Clinical course and consequences of hepatitis A infection. Vaccine 2000; 18:71-74; https://doi.org/10.1016/S0264-410X(99)00470-310.1016/S0264-410X(99)00470-3 - DOI - PubMed
Publication types
MeSH terms
Substances
LinkOut - more resources
Full Text Sources
Other Literature Sources
Medical
