. 2017 May 8;12(5):e0177086.
doi: 10.1371/journal.pone.0177086. eCollection 2017.

Low-sodium diet induces atherogenesis regardless of lowering blood pressure in hypertensive hyperlipidemic mice

Affiliations

Low-sodium diet induces atherogenesis regardless of lowering blood pressure in hypertensive hyperlipidemic mice

Fernanda B Fusco et al. PLoS One. .

Abstract

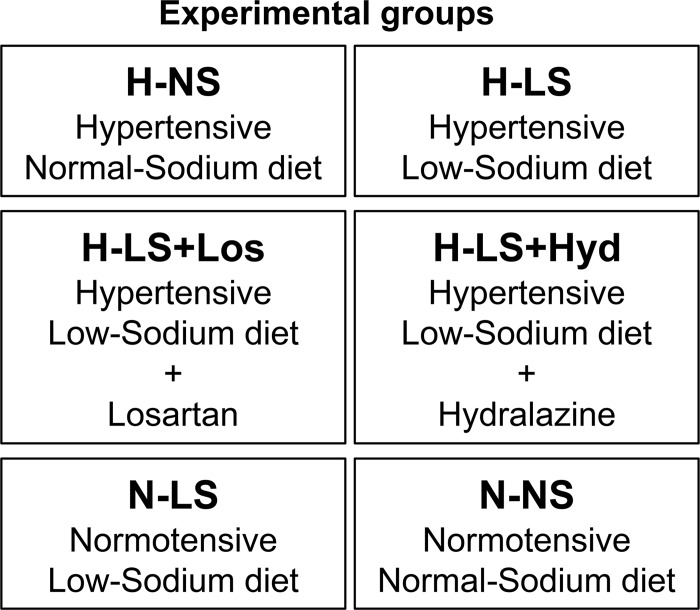
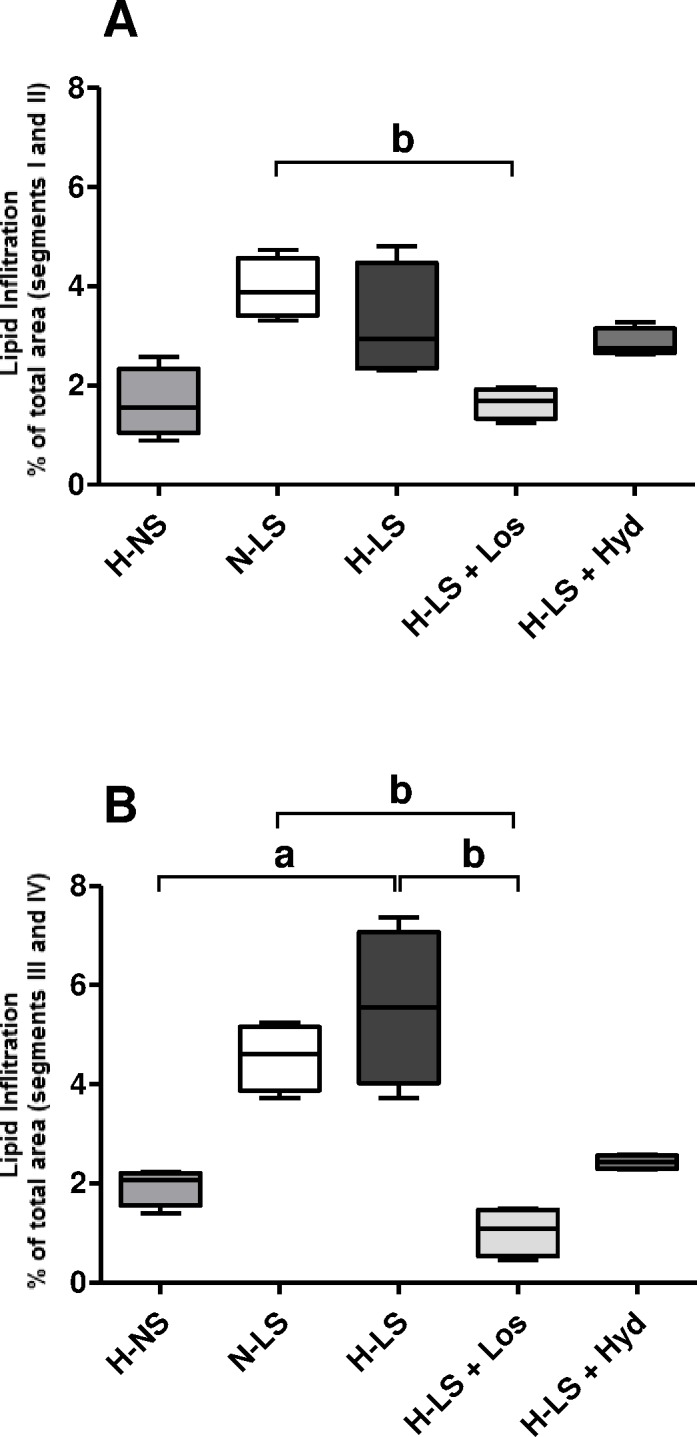
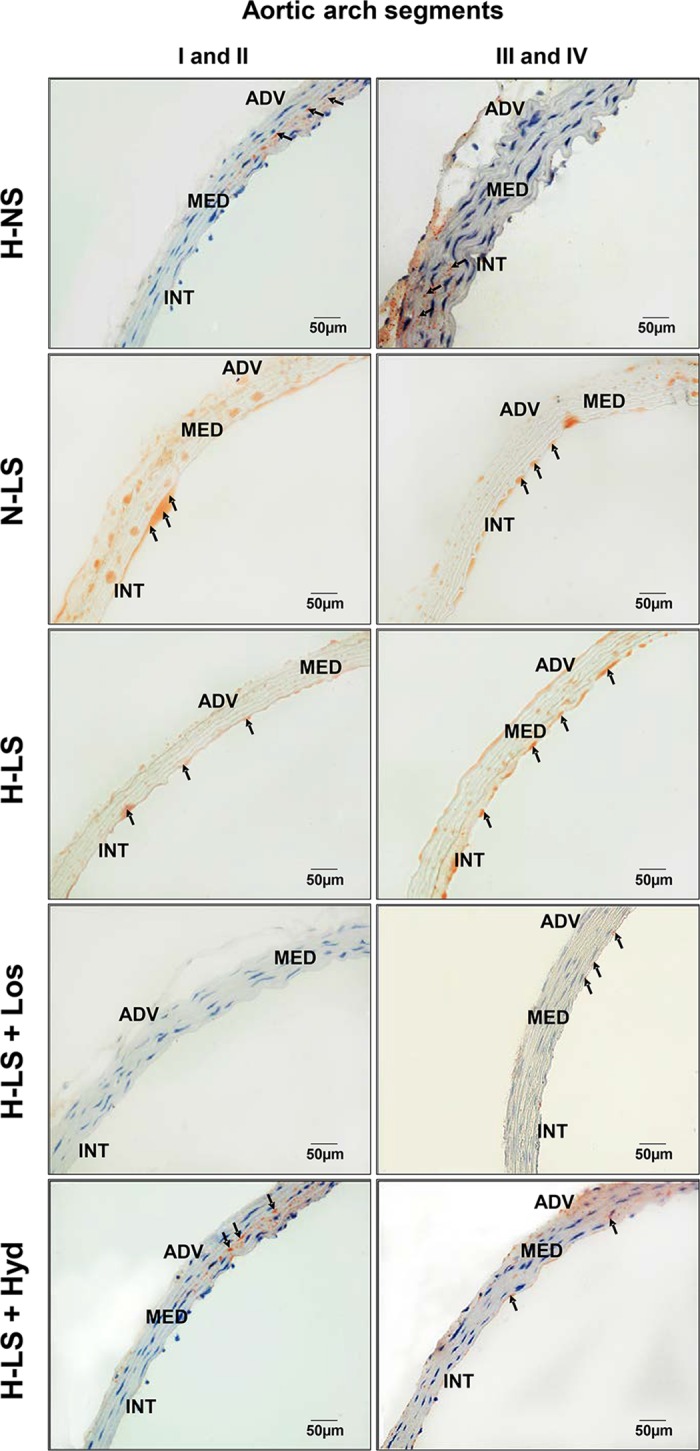
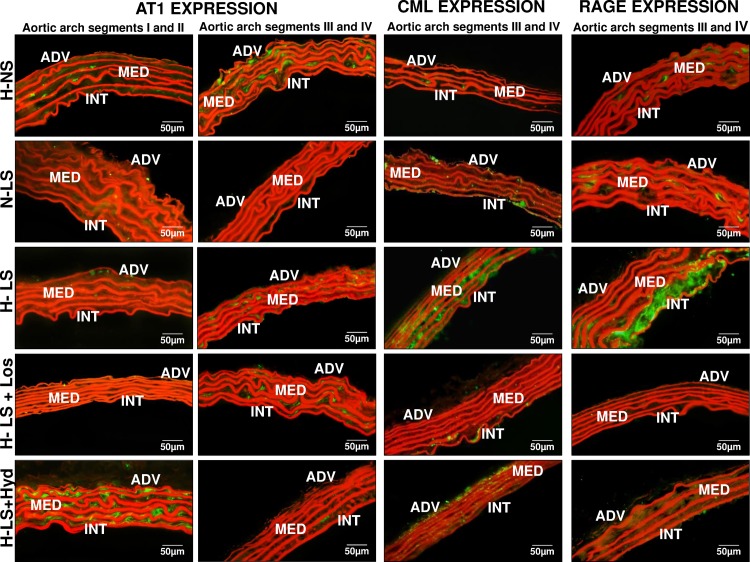
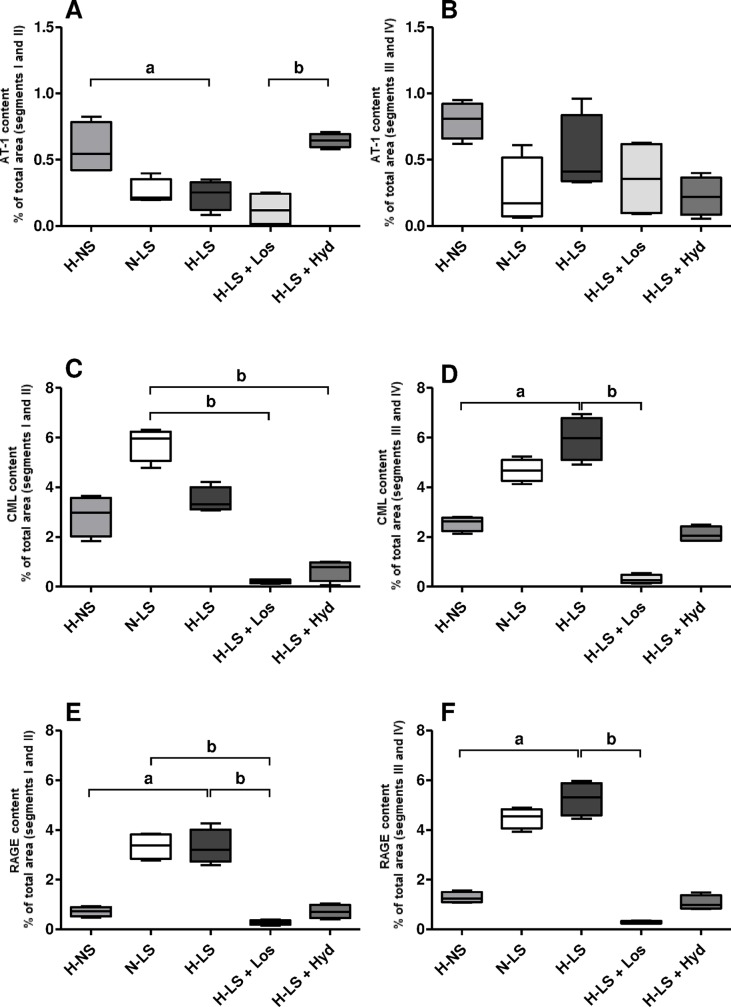
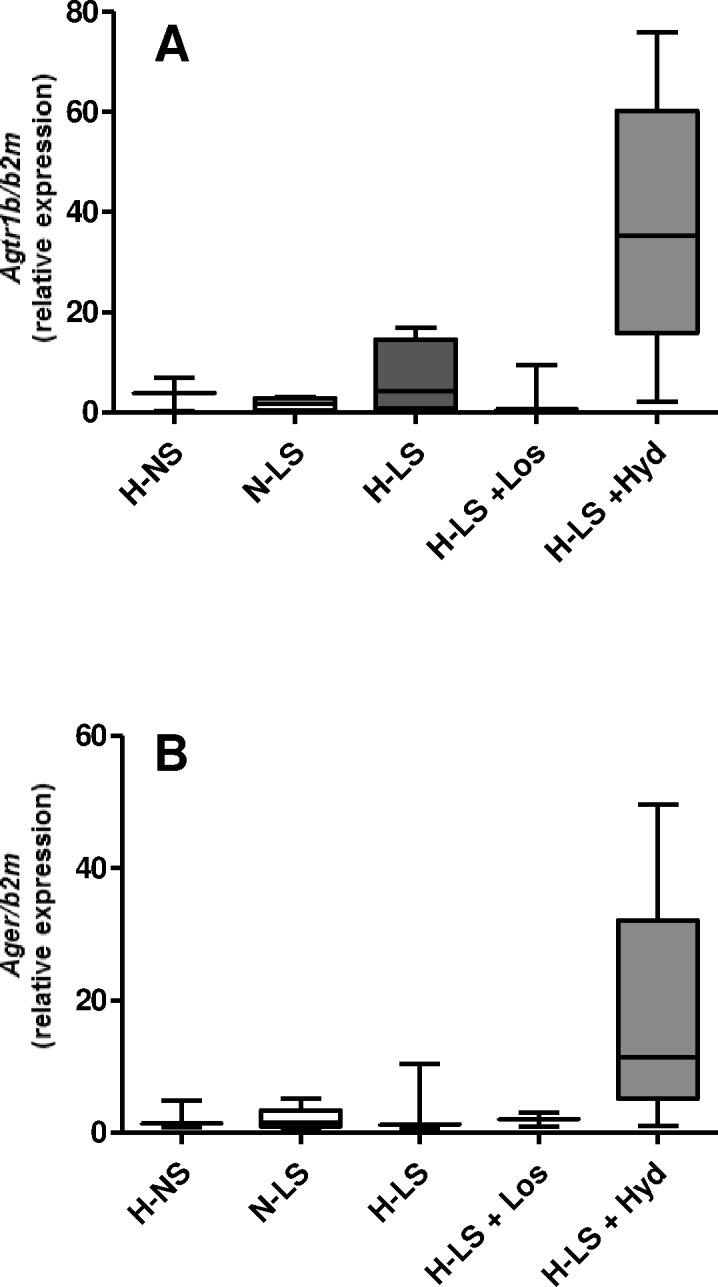
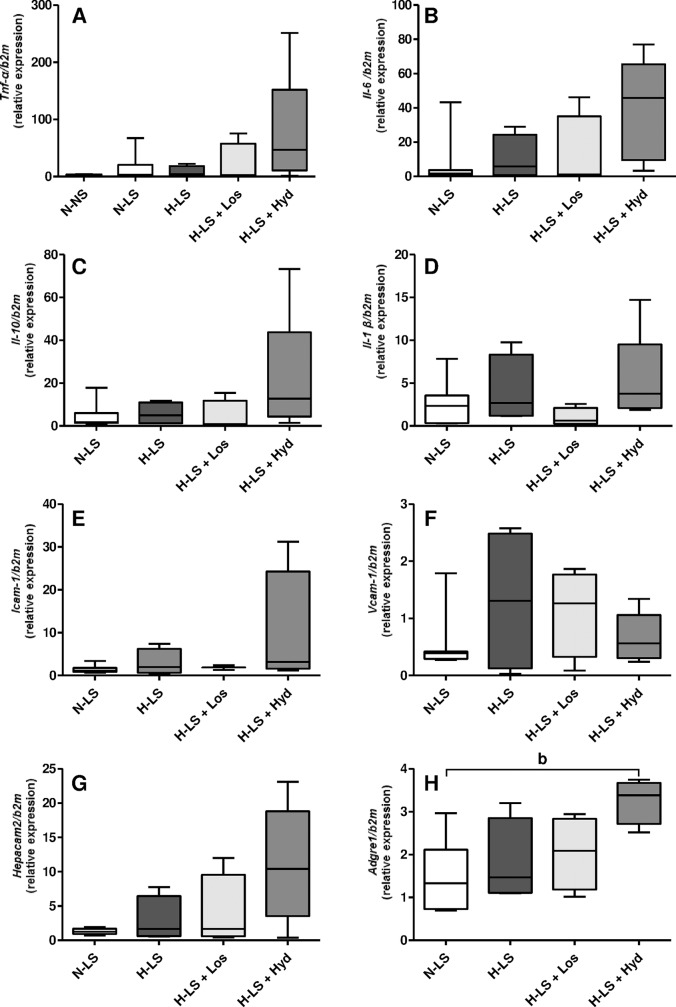
This study investigated the influence of sodium restriction and antihypertensive drugs on atherogenesis utilizing hypertensive (H) low-density lipoprotein-receptor knockout mice treated or not with losartan (Los) or hydralazine (Hyd) and fed low-sodium (LS) or normal-sodium (NS) chow. Despite reducing the blood pressure (BP) of H-LS mice, the LS diet caused arterial lipid infiltration due to increased plasma total cholesterol (TC) and triglycerides (TG). Los and Hyd reduced the BP of H-LS mice, and Los effectively prevented arterial injury, likely by reducing plasma TG and nonesterified fatty acids. Aortic lipid infiltration was lower in Los-treated H-LS mice (H-LS+Los) than in normotensive (N)-LS and H-LS mice. Aortic angiotensin II type 1 (AT1) receptor content was greater in H-NS than H-LS mice and in H-LS+Hyd than H-LS+Los mice. Carboxymethyl-lysine (CML) and receptor for advanced glycation end products (RAGE) immunostaining was greater in H-LS than H-NS mice. CML and RAGE levels were lower in LS animals treated with antihypertensive drugs, and Hyd enhanced the AT1 receptor level. Hyd also increased the gene expression of F4/80 but not tumor necrosis factor-α, interleukin (IL)-1β, IL-6, IL-10, intercellular adhesion molecule-1 or cluster of differentiation 66. The novelty of the current study is that in a murine model of simultaneous hypertension and hyperlipidemia, the pleiotropic effect of chronic, severe sodium restriction elicited aortic damage even with reduced BP. These negative effects on the arterial wall were reduced by AT1 receptor antagonism, demonstrating the influence of angiotensin II in atherogenesis induced by a severely LS diet.


Conflict of interest statement

Competing Interests: The authors have declared that no competing interests exist.

Figures

Fig 1
Fig 1. Experimental groups.
Fig 2
Fig 2
Vascular injury quantified by a histomorphometric analysis of oil red O-stained lipid infiltration as the mean percentage of total positively stained area of the aortic arch cross-sections (A segments I and II; B segments III and IV); n = 4 mice per group. a P < 0.05, hypertensive mice fed a normal-sodium diet (H-NS) vs hypertensive mice fed a low-sodium diet (H-LS), Mann Whitney test. b P < 0.05, Kruskal Wallis with Dunn’s post hoc test applied for comparisons among LS groups.
Fig 3
Fig 3. Representative examples of lipid infiltration visualized by oil red O staining of the intima and media layers of different aortic arch segments from animal groups consisting of hypertensive mice fed a normal-sodium diet (H-NS), normotensive mice fed a low-sodium diet (N-LS), hypertensive mice fed a low-sodium diet (H-LS), hypertensive mice fed a low-sodium diet and treated with losartan (H-LS+Los) and hypertensive mice fed a low-sodium diet and treated with hydralazine (H-LS+Hyd).
Arrows indicate sites of aortic arch lipid infiltration. ADV = adventitia, MED = media, INT = intima (400×).
Fig 4
Fig 4. Representative examples of AT1 receptor expression, CML content and RAGE expression visualized by immunofluorescence in the intima and media layers of different aortic arch segments from animal groups consisting of hypertensive mice fed a normal-sodium diet (H-NS), normotensive mice fed a low-sodium diet (N-LS), hypertensive mice fed a low-sodium diet (H-LS), hypertensive mice fed a low-sodium diet and treated with losartan (H-LS+Los) and hypertensive mice fed a low-sodium diet and treated with hydralazine (H-LS+Hyd).
ADV = adventitia, MED = media, INT = intima (400×).
Fig 5
Fig 5
Histomorphometric analysis of immunofluorescence-stained AT1 receptor (A segments I and II; B segments III and IV), and vascular injury quantified by a histomorphometric analysis of immunofluorescence-stained CML (C segments I and II; D segments III and IV) and RAGE (E segments I and II; F segments III and IV); data are represented as the mean percentage of the total positively stained area of the aortic arch cross-sections; n = 4 mice per group. a P < 0.05, hypertensive mice fed a normal-sodium diet (H-NS) vs hypertensive mice fed a low-sodium diet (H-LS), Mann Whitney test. b P < 0.05, Kruskal Wallis with Dunn’s post hoc test applied for comparisons among LS groups.
Fig 6
Fig 6. Gene expression (mRNA) of the AT1 receptor (Agtr1) and RAGE (Ager) in the mouse aortic arch.
Data are expressed as relative mRNA units normalized to mouse β2M expression. Mann Whitney test was used for comparisons between hypertensive mice fed a normal-sodium (H-NS) diet and hypertensive mice fed a low-sodium (H-LS) diet. The Kruskal Wallis test with Dunn’s post hoc test was applied for comparisons among the LS groups; n ≥ 4 mice per group.
Fig 7
Fig 7
Gene expression (mRNA): A: TNF-α (Tnf-α); B: IL-6 (Il6); C: IL-10 (Il10); D: IL-1β (Il1β); E: ICAM-1 (Icam1); F: VCAM-1 (Vcam1); G: CD66 (Hepacam2); and H: F4/80 (Adgre1) from the mouse aortic arch. Data are expressed as relative mRNA units normalized to mouse β2M expression. The Mann Whitney test was used for comparisons between normotensive mice fed a normal-sodium (N-NS) diet and normotensive mice fed a low-sodium (N-LS) diet (A). b P < 0.05 hypertensive mice fed a low-sodium diet and treated with hydralazine (H-LS+Hyd) vs N-LS (H). The Kruskal Wallis test with Dunn’s post hoc test was applied for comparisons among the LS groups (A-H); n ≥ 4 mice per group.

References

    1. Stolarz-Skrzypek K, Kuznetsova T, Thijs L, Tikhonoff V, Seidlerová J, Richart T, et al. Fatal and nonfatal outcomes, incidence of hypertension, and blood pressure changes in relation to urinary sodium excretion. JAMA. 2011; 305: 1777–1785. doi: 10.1001/jama.2011.574 - DOI - PubMed
    1. Alderman MH. Dietary sodium and cardiovascular health in hypertensive patients: the case against universal sodium restriction. J Am Soc Nephrol. 2004; 15 (Suppl 1): S47–S50. - PubMed
    1. Alderman MH. Reducing dietary sodium: the case for caution. JAMA. 2010; 303: 448–449. doi: 10.1001/jama.2010.69 - DOI - PubMed
    1. Garg R, Williams GH, Hurwitz S, Brown NJ, Hopkins PN, Adler GK. Low-salt diet increases insulin resistance in healthy subjects. Metabolism. 2011; 60: 965–968. doi: 10.1016/j.metabol.2010.09.005 - DOI - PMC - PubMed
    1. Krikken JA, Dallinga-Thie GM, Navis G, Dullaart RP. Short term dietary sodium restriction decreases HDL cholesterol, apolipoprotein A-I and high molecular weight adiponectin in healthy young men: relationships with renal hemodynamics and RAAS activation. Nutr Metab Cardiovasc Dis. 2012; 22: 35–41. doi: 10.1016/j.numecd.2010.03.010 - DOI - PubMed