. 2017 Jun 20;45(11):6546-6571.
doi: 10.1093/nar/gkx392.

PRL-3 promotes telomere deprotection and chromosomal instability

Affiliations

PRL-3 promotes telomere deprotection and chromosomal instability

Shenyi Lian et al. Nucleic Acids Res. .

Abstract

Phosphatase of regenerating liver (PRL-3) promotes cell invasiveness, but its role in genomic integrity remains unknown. We report here that shelterin component RAP1 mediates association between PRL-3 and TRF2. In addition, TRF2 and RAP1 assist recruitment of PRL-3 to telomeric DNA. Silencing of PRL-3 in colon cancer cells does not affect telomere integrity or chromosomal stability, but induces reactive oxygen species-dependent DNA damage response and senescence. However, overexpression of PRL-3 in colon cancer cells and primary fibroblasts promotes structural abnormalities of telomeres, telomere deprotection, DNA damage response, chromosomal instability and senescence. Furthermore, PRL-3 dissociates RAP1 and TRF2 from telomeric DNA in vitro and in cells. PRL-3-promoted telomere deprotection, DNA damage response and senescence are counteracted by disruption of PRL-3-RAP1 complex or expression of ectopic TRF2. Examination of clinical samples showed that PRL-3 status positively correlates with telomere deprotection and senescence. PRL-3 transgenic mice exhibit hallmarks of telomere deprotection and senescence and are susceptible to dextran sodium sulfate-induced colon malignancy. Our results uncover a novel role of PRL-3 in tumor development through its adverse impact on telomere homeostasis.


Figures

Figure 1.
Figure 1.
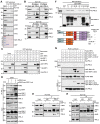
RAP1 mediates PRL-3–TRF2 interaction. (A) Precipitation of endogenous RAP1 and TRF2 by GST-PRL-3. HCT116 cell lysates (500 μg) were co-incubated with 1 μg purified GST (lane 2) or GST-PRL-3 (lane 3), and subjected to GST pull-down with Glutathione-agarose beads. Precipitates and 50 μg HCT116 cell lysates (lane 1, input) were analyzed by western blot with indicated anti-shelterin antibodies. Purities of GST-PRL-3 and GST were verified by Coomassie blue staining (lower panel). (B) Endogenous PRL-3 associates with RAP1 and TRF2 in cells in a DNA/RNA-independent manner. HCT116 cell lysates (500 μg) were immunoprecipitated by 1 μg antibody against PRL-3 (upper panel) or RAP1 (lower panel). For control, 1 μg preimmune IgG was used. Parts of lysates were also pre-treated with benzonase (Benz) for 30 min at room temperature before immunoprecipitation. Precipitates and 25 μg HCT116 cell lysates (input) were subjected to western blot. (C) Requirement of RAP1 for PRL-3-TRF2 association in vitro. Purified proteins (100 ng each) were mixed as indicated (lanes 4–11) and subjected to GST pull-down assay. Some of mixtures were also pre-treated with benzonase for 30 min at room temperature (lanes 8–11). Precipitates and purified proteins (10 ng each, lanes 1–3, input) were analyzed by western blot with antibodies to TRF2, RAP1 and PRL-3. (D) Enhancement of PRL-3–TRF2 interaction by RAP1 in cells. COS7 cells were co-transfected with indicated amounts of pcDNA3 and pcDNA3-myc-RAP1 plasmids. The total amount of plasmids for each sample was adjusted to 2 μg. After 48 h, cells were harvested and lysates were immunoprecipitated with anti-PRL-3 and analyzed by western blot with antibodies to TRF2, myc-tag, RAP1 and PRL-3. (E) Requirement of RAP1 for PRL-3–TRF2 association in cells. HCT116 cells were transfected with 50 nM control or RAP1-specific siRNA for 48 h. Cell lysates were immunoprecipitated with anti-PRL-3. HC, IgG heavy chain. (F) Upper, GST pull-down assay to map the domain of RAP1 required for its interaction with PRL-3. A total of 100 ng GST (lane 2) or GST-RAP1s (lanes 3–8) was co-incubated with 100 ng His-PRL-3 (lanes 2–8). After pull-down, precipitates were detected by anti-PRL3 and anti-GST. Input, 10 ng His-PRL-3 (lane 1). Lower, summary of binding. FL, full-length RAP1; ΔB, deletion of BRCT domain; ΔBΔM, deletion of BRCT and Myb domains; ΔCΔRΔN, deletion of coiled-coil, RCT and NLS domains. Red asterisks, position of GST or GST fusion proteins. (G) Adaptor function of RAP1 in mediating TRF2 and PRL-3 interaction is dependent on its Myb and RCT domains. Purified FALG-TRF2, GST-RAP1 (FL, ΔBΔM, ΔCΔRΔN) and His-PRL-3 proteins (100 ng each) were mixed as indicated. Five percent of mixtures were kept as input, and the rests were subjected to pull-down with anti-FLAG-agarose bead. Precipitates and input were analyzed by western blot with antibodies to PRL-3, TRF2 and GST-tag. (H) Blockade of PRL-3's recruitment to RAP1–TRF2 complex by GFP-Myb. HCT116 cells were transfected with 0.5 μg of pEGFP-N1 or pEGFP-N1-Myb plasmid for 48 h. Lysates (500 μg) were immunoprecipitated with 1 μg anti-RAP1 or pre-immune IgG. Precipitates and 25 μg lysates (input) were analyzed by western blot.
Figure 2.
Figure 2.
RAP1 and TRF2-dependent recruitment of PRL-3 to telomere. (A) In situ PLA analysis of PRL-3's associations with RAP1 and TRF2. HCT116 cells were pre-extracted, fixed, inmunostained with indicated pairs of antibodies and probed with Duolink in situ PLA reagent. Binding foci were in red and dashed lines indicated outline of nucleus (determined by DAPI counter staining). Scale bar, 10 μm. (B) TRF2- and RAP1-dependent recruitment of PRL-3 to telomeric DNA in vitro. Purified myc-TRF2 (150 ng), His-RAP1 (120 ng), and His-PRL-3 (30 ng) were co-incubated with 1 μg biotin-labeled telomere (lanes 1–4) or Alu (lanes 5–8) probe as indicated and subjected to pull-down analysis with Streptavidin agarose. Precipitates were analyzed by western blot with antibodies to TRF2, RAP1 and PRL-3. (C and D) TRF2 and RAP1-dependent recruitment of PRL-3 to telomere in cells. HCT116 cells were transfected with 50 nM indicated siRNAs for 48 h, pre-extracted, fixed and subjected to IF-FISH staining. (C) Representative PRL-3 association with telomere. Scale bar, 10 μm. Areas in white squares were enlarged. (D) Quantification of cells with ≥5 associations between PRL-3 foci and telomere. Mean ± SD of three independent experiments. n > 100 cells per single experiment. Student's t-test. (E) Knockdown efficiencies of RAP1 and TRF2. HCT116 cells were transfected with 50 nM siRNAs against RAP1 or TRF2 for 48 h. Lysates were analyzed by western blot with indicated antibodies. (F) ChIP analysis of PRL-3 binding to telomeric and Alu DNA. HCT116 cells were transfected with 50 nM indicated siRNAs for 48 h and processed for ChIP using anti-PRL-3 or pre-immune IgG. Upper, representative blots of hybridization with probe to telomere or Alu. Input, 2% DNA. Lower, quantification of relative optical densities (OD). Relative OD was calculated by normalizing to OD of Input and relative OD of control siRNA-transfected sample was set as 100%. Mean ± SD of three independent experiments. Student's t-test.
Figure 3.
Figure 3.
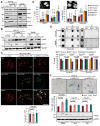
Silencing of PRL-3 promotes DDR and senescence. (A) Efficiencies of PRL-3 silencing in HCT116 (knockdown by two shRNAs using lentivirus system, left) and SW480 (knockout by CRISPR/Cas9 system, right) cells and its effects on indicated protein levels. WT, wild-type. KO, knockout. (B) Effects of PRL-3 silencing on phosphorylations of H2AX and CHK1. Samples treated with 20 μM etoposide (ETP) for 4 h were used as positive controls. (C) Effects of PRL-3 silencing on TIF formation. Indicated HCT116 cells were subjected to IF-FISH staining. Upper, representative staining. Arrows, colocalizations between γH2AX and telomere (TIFs). Scale bar, 5 μm. Lower, quantification of cells with ≥5 TIF. Mean ± SD of two independent experiments. n > 200 cells per single experiment. Student's t-test. (D) Effects of PRL-3 silencing on anaphase bridges (APB) and micronuclei (MN) formation. Indicated cells were treated with aphidicolin (0.2 μM) or DMSO (1:1000) for 24 h, followed by DAPI staining. Mean ± SD of two independent experiments. n > 1000 cells scored per sample for MN and n > 50 anaphase cells scored per sample for APB. Student's t-test. Representative images of APB (red arrow) and MN (white arrow) of HCT116 cells stained with DAPI were shown. (E) ChIP analysis of RAP1 and TRF2's binding to telomeric or Alu DNA in HCT116 and S480 cells silenced for PRL-3. Upper, representative blots after ChIP with indicated antibodies or IgG. Input, 2% DNA. Lower, quantification of relative OD. Relative OD was calculated by normalizing to that of input and relative OD of control was set as 100%. Mean ± SD of three independent experiments. Student's t-test. (F) PRL-3 silencing induced ROS-dependent cellular senescence and DNA damage response. Indicated HCT116 cells were treated with NAC (10 mM), GSH (10 mM) or DMSO (1:1000) for 24 h. Part of cells were fixed and processed for β-galactosidase staining, others were analyzed by western blot. Upper, representative β-galactosidase staining of cells treated with DMSO. Middle, quantification of β-galactosidase positive cells. Mean ± SD of two independent experiments. n > 400 cells per single experiment. Student's t-test. Lower, western blot of γH2AX.
Figure 4.
Figure 4.
Overexpression of PRL-3 promotes telomere dysfunction. (A) Validation of PRL-3 stable overexpression. WI38 fibroblasts were infected with control or PRL-3-expressing letivirus. Expression vectors pcDNA3-myc-PRL-3 (for HCT116 cells), pcDNA3.1-myc-PRL-3 (for LoVo cells) and the respective control plasmids were transfected into cells, followed by selection and pooling of stable colonies. Cell lysates were examined by western blot with antibodies to PRL-3, TRF2 and RAP1. (B) Effects of PRL-3 stable overexpression on γH2AX, pCHK1 and p53 levels. Indicated cells were treated with ETP (20 μM) or DMSO (1:1000) for 4 h. (C) Effects of PRL-3 stable overexpression on TIF formation. WI38 cells were analyzed by IF-FISH staining of pATM (green) and telomere (red). Left, representative staining. Arrows, foci of TIFs. Scale bar, 5 μm. Right, quantification of cells with ≥5 TIFs. Mean ± SD of two independent experiments. n > 60 metaphase per single experiment. Student's t-test. (D) Effects of PRL-3 stable overexpression on dysfunctional telomere repair pathways. Upper, representative CO-FISH staining of WI38 cells. Metaphase cells were stained with probes specific for leading (red) and lagging (green) strands and counterstained with DAPI (blue). Yellow arrow, a typical T-SCE. White arrow, a chromosome–chromosome fusion. Red arrowhead, a MTS. Scale bar, 2.5 μm. Lower, quantification of abnormalities. Mean ± SD of two independent experiments. n > 1300 chromosomes per single experiment. Student's t-test. (E) Southern blot analysis of PRL-3 stable overexpression-induced telomere deprotection. Genomic DNA from indicated cells were resolved on agarose gel, transferred to nitrocellulose membrane and probed with biotin-labeled telomere probe. (F) qPCR analysis of PRL-3 stable overexpression-induced telomere deprotection. Relative telomere to single copy gene (T/S) ratio of control cells was set as 1. Mean ± SD of three independent experiments. n = 4 replicates per single experiment. Student's t-test.
Figure 5.
Figure 5.
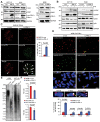
Overexpression of PRL-3 promotes chromosomal instability and senescence. (A) Effects of PRL-3 stable overexpression on APB and MN formation. Indicated cells were treated with aphidicolin (0.2 μM) or DMSO (1:1000) for 24 h, followed by DAPI staining. Mean ± SD of two independent experiments. Student's t-test. n > 1500 cells scored per sample for MN or n > 60 anaphase cells scored per sample for APB. (B) Effects of PRL-3 stable overexpression on BrdU incorporation. Indicated cells were treated with double-thymidine block, released into fresh medium containing 10 μM BrdU and incubated for 45 min. Cells were fixed, immunostained with anti-BrdU (green), and counterstained with DAPI (blue). Left, representative staining of BrdU. Scale bar, 15 μm. Right, quantification of BrdU-positive cells. Mean ± SD of two independent experiments. n > 300 cells per single experiment. Student's t-test. (C) Effects of PRL-3 stable overexpression on senescence. Indicated cells were treated with DMSO (1:1000) or Ku55933 (5 μM) for 24 h, followed by β-galactosidase staining. Left, representative staining. Right, quantification of β-galactosidase positive cells. Mean ± SD of three independent experiments. n > 500 cells per single experiment. Student's t-test. (D) Effects of PRL-3 stable overexpression on H3K9me3 levels. Indicated cells were fixed, immunostained with anti-H3K9me3 (red), and counterstained with DAPI (blue). (E) Effects of reconstituted PRL-3 on telomere length, DNA damage and senescence in PRL-3 stable knockdown cells. HCT116 control and PRL-3 stable knockdown cells were co-transfected with indicated amount of pcDNA3 and pcDNA3-PRL-3 plasmids. The total amount of plasmids for each sample was adjusted to 4 μg. After 72 h, protein lysates were subjected to western blot of PRL-3, γH2AX, H3K9me3 (lower). Genomic DNA was used for qPCR analysis of telomere length (upper). Protein bands were scanned and relative OD was calculated by normalizing to GAPDH. T/S ratio of HCT116 control cells transfected with pcDNA3 was set as 1. Pearson χ2 test.
Figure 6.
Figure 6.
Correlations of PRL-3 with telomere length, chromosomal instability and senescence in clinical samples. (A) Correlations of PRL-3 with hallmarks of chromosomal instability in colon cancer tissues. Left, representative images of chromosomal mis-segregations (black arrows) in colon cancer tissues stained with an anti-PRL-3 mAb (brown areas). Scale bar, 20 μm. Right, percentage of anaphase cells with bridges and percentage of mitotic cells with ≥3 spindle poles in colon cancer tissues with negative and positive PRL-3 expression. Pearson χ2 test. (B) Correlations of PRL-3 with telomere length, DNA damage and senescence in colon cancer tissues. Protein lysates from 12 colon cancer tissues were subjected to western blot of PRL-3, γH2AX, H3K9me3 (left). Genomic DNA from these samples was used for qPCR analysis of telomere length (right). Protein lysates and genomic DNA from control and PRL-3 stable expressing WI38 cells were also compared. Protein bands were scanned and relative OD was calculated by normalizing to GAPDH. T/S ratio of WI38 control cells was set as 1. Pearson χ2 test. (C) Correlation of PRL-3 with telomere length in thyroid tissues. Left, representative images of PRL-3 immunohostochemical staining and telomere staining in thyroid adenocarcinoma (Stage I). Scale bar, 50 μm. Right, quantification of telomere fluorescence units (TFUs) in PRL-3 negative and positive samples. Results represent the average TFU ± SD. n > 300 nuclei scored per sample. Student's t-test. (D) Correlation of PRL-3 with senescence in thyroid tissues. Left, representative images of H3K9me3 immunostaining in thyroid adenocarcinoma (Stage I) with negative or positive PRL-3 expression. Right, analysis of correlation between PRL-3 and H3K9me3 status. P3-N, PRL-3 negative. P3-P, PRL-3 positive. Pearson χ2 test.
Figure 7.
Figure 7.
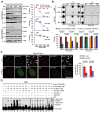
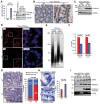
PRL-3 relocates RAP1 and TRF2 from telomeric DNA. (A) Effects of PRL-3 stable overexpression on the chromatin abundance of RAP1, TRF2 and TRF1. Nuclei from HCT116 cells were homogenized in buffer containing indicated concentrations of NaCl. Chromatin-enriched fractions were analyzed by western blot. Left, representative blots. Right, relative levels of TRF2, RAP1 and TRF1. Protein band were scanned and relative OD was calculated by normalizing to OD of H2B. The relative OD of sample prepared with 150 mM NaCl was set as 100%. Mean ± SD of three independent experiments. ANOVA. (B) Effects of PRL-3 stable overexpression on bindings of RAP1 and TRF2 to telomeric and Alu DNA. Indicated cells were crosslinked, immunoprecipitated with antibodies to RAP1, TRF2 or pre-immune IgG, and precipitated DNA was analyzed by ChIP. Upper, representative blots. Lower, quantification of relative OD, which was calculated by normalizing to that of Input. Relative OD of control was set as 100%. Mean ± SD of three independent experiments. Student's t-test. (C) Effects of PRL-3 stable overexpression on telomere associations of RAP1 and TRF2 in WI38 cells. Left, representative IF-FISH staining of telomere (red) and RAP1 or TRF2 (green). Arrows, foci of co-localization. Scale bar, 10 μm. Right, quantification of cells with ≥5 associations between RAP1 or TRF2 foci and telomere. Mean ± SD of two independent experiments. n > 80 cells per single experiment. Student's t-test. (D) EMSA analysis of PRL-3, RAP1 and TRF2's associations with telomeric DNA. Indicated concentrations of purified FLAG-TRF2, His-RAP1, myc-PRL-3 were co-incubated with Biotin-labeled telomere probe (20 nM). To induce super-shift, 0.1 μg anti-PRL-3 (lane 5), anti-TRF2 (lanes 6 and 18) and IgG (lane 7) were used. Note that anti-PRL-3 and anti-TRF2-induced super-shifts of Complex II partially co-migrated with Complex I (lanes 5 and 6).
Figure 8.
Figure 8.
Disrupting PRL-3-RAP1 complex or expressing ectopic TRF2 attenuates PRL-3 overexpression-promoted telomere deprotection, DNA damage, chromosomal instability and senescence. (A) HCT116 control and PRL-3 overexpressing cells were transfected with 0.5 μg of pEGFP-N1-Myb or pEGFP-N1 plasmid for 72 h, and indicated proteins were analyzed by western blot. (B) qPCR analysis of telomere length of cells in (A). T/S ratio of HCT116 control cells transfected with pEGFP-N1 was set as 1. Mean ± SD of three independent experiments. Three replicates per single experiment. Student's t-test. (C) Quantification of micronuclei of cells in (A). Mean ± SD of two independent experiments. n > 500 cells per single experiment. Student's t-test. (D) Quantification of β-galactosidase-positive cells in (A). Mean ± SD of two independent experiments. n > 300 cells per single experiment. Student's t-test. (E) Relative migration of cells in (A). Cells were allowed to migrate through transwell chambers for 24 h. Value of HCT116 control cells transfected with pEGFP-N1 was set as 1. Mean ± SD of two independent experiments. Three replicates per single experiment. Student's t-test. (F) HCT116 control and PRL-3 overexpressing cells were infected with control (Lv-con) or TRF2-expressing lentivirus (Lv-TRF2) for 120 h, and lysates were subjected to western blot. (G) qPCR analysis of telomere length of cells in (F). T/S ratio of HCT116 control cells infected with Lv-con was set as 1. Mean ± SD of three independent experiments. 3 replicates per single experiment. Student's t-test. (H) Quantification of micronuclei of cells in (F). Mean ± SD of three independent experiments. n > 500 cells per single experiment. Student's t-test. (I) Quantification of β-galactosidase-positive cells in (F). Mean ± SD of three independent experiments. n > 300 cells per single experiment. Student's t-test. (J) Relative migration of cells of (F). Cells were allowed to migrate through transwell chambers for 24 h. Value of HCT116 control cells infected with Lv-con was set as 1. Mean ± SD of three independent experiments. Three replicates per single experiment. Student's t-test.
Figure 9.
Figure 9.
PRL-3-promoted telomere deprotection is associated with colon tumorigenesis in mice. (A) qRT-PCR (left) and western blot (right) analysis of PRL-3 expression in distal colon tissues of wild-type (WT) and transgenic (TG) mice treated with DOX for 8 weeks. Lysates from HCT116 cells stably overexpressing PRL-3 were used as the control. (B) Representative immunohistochemical staining of PRL-3 (brown areas) in distal colon tissues of mice treated with DOX for 8 weeks. Sections were counterstained with Hematoxylin and eosin (HE). Scale bar, 50 μm. (C) PRL-3-induced ERK1/2 phosphorylation in distal colon tissues of mice (n = 2) treated with DOX for 8 weeks. (D) Representative FISH staining of telomere in distal colon tissues of mice treated with DOX for 8 weeks. Scale bar, 50 μm. (E) Southern blot analysis of telomere length in distal colon and liver tissues of mice treated with DOX for 8 weeks. (F) qPCR analysis of telomere length in distal colon and liver tissues of mice treated with DOX for 8 weeks. T/S ratio of WT mice was set as 1. Mean ± SD of three independent experiments. n = 3 mice per single experiment. Student's test. (G) PRL-3-promoted colon malignancy in mice. Mice were treated with DOX for 8 weeks, followed by four cycles of DSS administration. Tumors were microscopically analyzed at the end of the 4th DSS cycle and classified as adenocarcinoma or adenoma. Left, representative images of HE-stained colon tumors. Scale bars, 100 μm. Right, incidence of adenocarcinoma or adenoma in WT (n = 8) and TG (n = 7) mice. Pearson χ2 test. (H) PRL-3-promoted chromosomal mis-segregation in colon tumor tissues at the end of the 4th DSS cycle. Left, representative images of normal (in WT) and abnormal (in TG) mitoses. Arrow, an anaphase bridge. Scale bars, 25 μm. Right, incidence of anaphase bridge in WT (n = 8) and TG (n = 7) mice. Pearson χ2 test. (I) Expression of indicated proteins in the distal colon tissues (n = 3) at the end of the fourth DSS cycle.

Similar articles

Cited by

References

    1. Al-Aidaroos A.Q., Zeng Q.. PRL-3 phosphatase and cancer metastasis. J. Cell. Biochem. 2010; 111:1087–1098. - PubMed
    1. Bessette D.C., Qiu D., Pallen C.J.. PRL PTPs: mediators and markers of cancer progression. Cancer Metastasis. Rev. 2008; 27:231–252. - PubMed
    1. Rios P., Li X., Köhn M.. Molecular mechanisms of the PRL phosphatases. FEBS J. 2013; 280:505–524. - PubMed
    1. Achiwa H., Lazo J.S.. PRL-1 tyrosine phosphatase regulates c-Src levels, adherence, and invasion in human lung cancer cells. Cancer Res. 2007; 67:643–650. - PubMed
    1. Hardy S., Wong N.N., Muller W.J., Park M., Tremblay M.L.. Overexpression of the protein tyrosine phosphatase PRL-2 correlates with breast tumor formation and progression. Cancer Res. 2010; 70:8959–8967. - PubMed