

High-density genetic map construction and QTLs identification for plant height in white jute (Corchorus capsularis L.) using specific locus amplified fragment (SLAF) sequencing
- PMID: 28482802
- PMCID: PMC5421330
- DOI: 10.1186/s12864-017-3712-8
High-density genetic map construction and QTLs identification for plant height in white jute (Corchorus capsularis L.) using specific locus amplified fragment (SLAF) sequencing
Abstract
Background: Genetic mapping and quantitative trait locus (QTL) detection are powerful methodologies in plant improvement and breeding. White jute (Corchorus capsularis L.) is an important industrial raw material fiber crop because of its elite characteristics. However, construction of a high-density genetic map and identification of QTLs has been limited in white jute due to a lack of sufficient molecular markers. The specific locus amplified fragment sequencing (SLAF-seq) strategy combines locus-specific amplification and high-throughput sequencing to carry out de novo single nuclear polymorphism (SNP) discovery and large-scale genotyping. In this study, SLAF-seq was employed to obtain sufficient markers to construct a high-density genetic map for white jute. Moreover, with the development of abundant markers, genetic dissection of fiber yield traits such as plant height was also possible. Here, we present QTLs associated with plant height that were identified using our newly constructed genetic linkage groups.
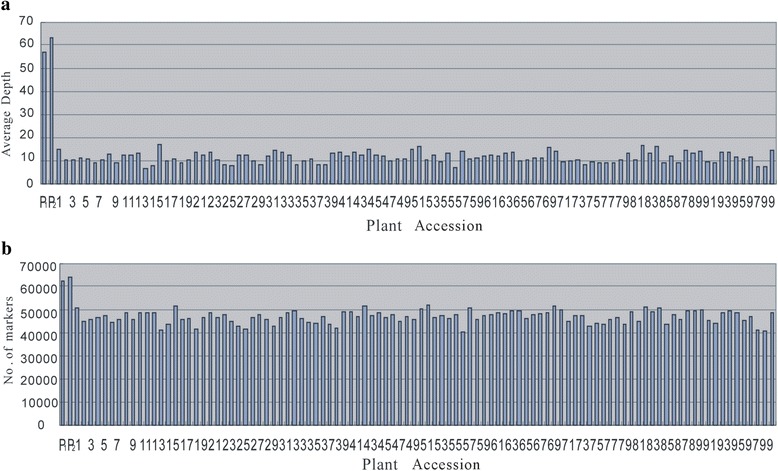
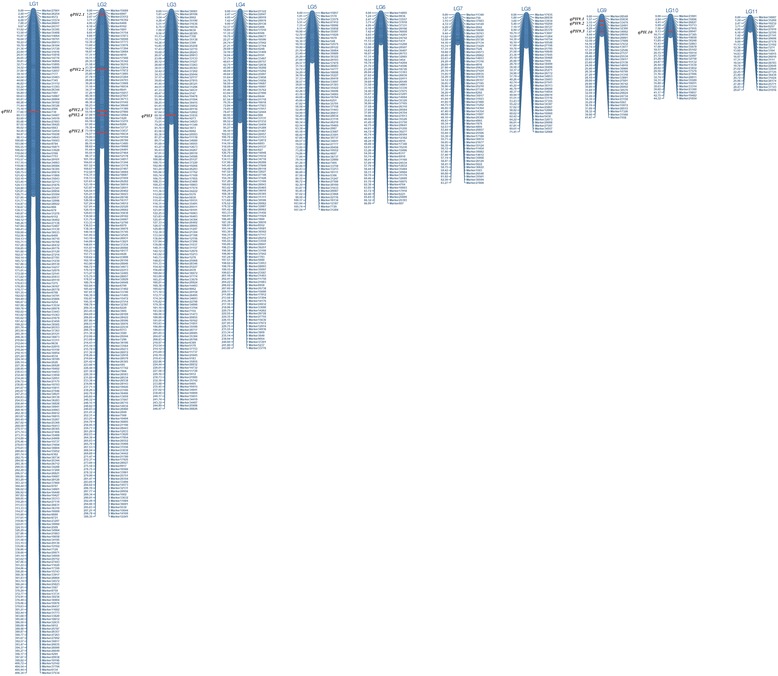
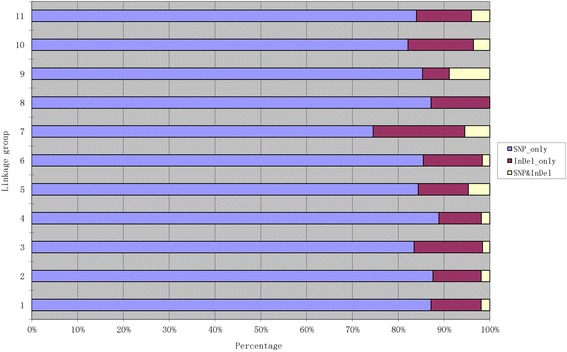
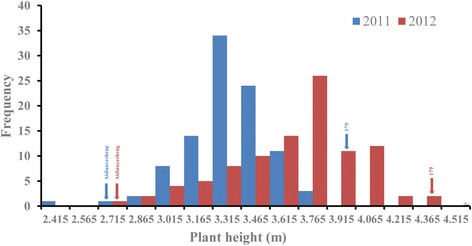
Results: An F8 population consisting of 100 lines was developed. In total, 69,446 high-quality SLAFs were detected of which 5,074 SLAFs were polymorphic; 913 polymorphic markers were used for the construction of a genetic map. The average coverage for each SLAF marker was 43-fold in the parents, and 9.8-fold in each F8 individual. A linkage map was constructed that contained 913 SLAFs on 11 linkage groups (LGs) covering 1621.4 cM with an average density of 1.61 cM per locus. Among the 11 LGs, LG1 was the largest with 210 markers, a length of 406.34 cM, and an average distance of 1.93 cM between adjacent markers. LG11 was the smallest with only 25 markers, a length of 29.66 cM, and an average distance of 1.19 cM between adjacent markers. 'SNP_only' markers accounted for 85.54% and were the predominant markers on the map. QTL mapping based on the F8 phenotypes detected 11 plant height QTLs including one major effect QTL across two cultivation locations, with each QTL accounting for 4.14-15.63% of the phenotypic variance.
Conclusions: To our knowledge, the linkage map constructed here is the densest one available to date for white jute. This analysis also identified the first QTL in white jute. The results will provide an important platform for gene/QTL mapping, sequence assembly, genome comparisons, and marker-assisted selection breeding for white jute.
Keywords: Corchorus capsularis L; Genetic map; Plant height; QTL; SLAF.
Figures
Similar articles
-
Construction of a high-density genetic map based on large-scale markers developed by specific length amplified fragment sequencing (SLAF-seq) and its application to QTL analysis for isoflavone content in Glycine max.BMC Genomics. 2014 Dec 10;15(1):1086. doi: 10.1186/1471-2164-15-1086. BMC Genomics. 2014. PMID: 25494922 Free PMC article.
-
Construction of a high-density genetic map and mapping of QTLs for soybean (Glycine max) agronomic and seed quality traits by specific length amplified fragment sequencing.BMC Genomics. 2018 Aug 29;19(1):641. doi: 10.1186/s12864-018-5035-9. BMC Genomics. 2018. PMID: 30157757 Free PMC article.
-
An SNP-based saturated genetic map and QTL analysis of fruit-related traits in cucumber using specific-length amplified fragment (SLAF) sequencing.BMC Genomics. 2014 Dec 22;15(1):1158. doi: 10.1186/1471-2164-15-1158. BMC Genomics. 2014. PMID: 25534138 Free PMC article.
-
Quantitative trait loci from identification to exploitation for crop improvement.Plant Cell Rep. 2017 Aug;36(8):1187-1213. doi: 10.1007/s00299-017-2127-y. Epub 2017 Mar 28. Plant Cell Rep. 2017. PMID: 28352970 Review.
-
Human QTL linkage mapping.Genetica. 2009 Jun;136(2):333-40. doi: 10.1007/s10709-008-9305-3. Epub 2008 Jul 31. Genetica. 2009. PMID: 18668207 Free PMC article. Review.
Cited by
-
High-Density Genetic Linkage Maps Provide Novel Insights Into ZW/ZZ Sex Determination System and Growth Performance in Mud Crab (Scylla paramamosain).Front Genet. 2019 Apr 5;10:298. doi: 10.3389/fgene.2019.00298. eCollection 2019. Front Genet. 2019. PMID: 31024620 Free PMC article.
-
Integrative QTL mapping and candidate gene analysis for main stem node number in soybean.BMC Plant Biol. 2025 Apr 3;25(1):422. doi: 10.1186/s12870-025-06457-2. BMC Plant Biol. 2025. PMID: 40181259 Free PMC article.
-
Gene coexpression network analysis and tissue-specific profiling of gene expression in jute (Corchorus capsularis L.).BMC Genomics. 2020 Jun 16;21(1):406. doi: 10.1186/s12864-020-06805-6. BMC Genomics. 2020. PMID: 32546133 Free PMC article.
-
QTL analysis and candidate gene identification for plant height in cotton based on an interspecific backcross inbred line population of Gossypium hirsutum × Gossypium barbadense.Theor Appl Genet. 2019 Sep;132(9):2663-2676. doi: 10.1007/s00122-019-03380-7. Epub 2019 Jun 24. Theor Appl Genet. 2019. PMID: 31236630
-
QTL mapping of drought-related traits in the hybrids of Populus deltoides 'Danhong'×Populus simonii 'Tongliao1'.BMC Plant Biol. 2022 May 11;22(1):238. doi: 10.1186/s12870-022-03613-w. BMC Plant Biol. 2022. PMID: 35545765 Free PMC article.
References
-
- Islam AS TM, Lee CT, Ingram C, Montalvo RJ, Ende G, Alam S, Siddiqui J, Sathasivan K: Preliminary progress in jute (Corchorus species) genome analysis. Plant Tissue Cult Biotechnol 2005, 15:145–156
-
- Chen Y, Zhang L, Qi J, Chen H, Tao A, Xu J, Lin L, Fang P. Genetic linkage map construction for white jute (Corchorus capsularis L.) using SRAP, ISSR and RAPD markers. Plant Breed. 2014;133:777–781. doi: 10.1111/pbr.12205. - DOI
-
- Wazni MW, Islam AS, Taliaferro JM, Anwar N, Sathasivan K. Novel ESTs from a Jute (Corchorus olitorius L.) cDNA Library. Plant Tissue Cult Biotech. 2007;17(2):173–182.
-
- HP X . Breeding sciences of bast and leaf fiber crops, 1st edn. Beijing: Agricultural Science and Technology Press of China; 2008.
Publication types
MeSH terms
Substances
LinkOut - more resources
Full Text Sources
Other Literature Sources
Miscellaneous
