. 2017 May 8;5(1):37.
doi: 10.1186/s40478-017-0439-3.

Higher levels of myelin phospholipids in brains of neuronal α-Synuclein transgenic mice precede myelin loss

Affiliations

Higher levels of myelin phospholipids in brains of neuronal α-Synuclein transgenic mice precede myelin loss

Jessica Grigoletto et al. Acta Neuropathol Commun. .

Abstract

α-Synuclein is a protein involved in the pathogenesis of synucleinopathies, including Parkinson's disease (PD), dementia with Lewy bodies (DLB) and multiple system atrophy (MSA). We investigated the role of neuronal α-Syn in myelin composition and abnormalities. The phospholipid content of purified myelin was determined by 31P NMR in two mouse lines modeling PD, PrP-A53T α-Syn and Thy-1 wt-α-Syn. Significantly higher levels of phospholipids were detected in myelin purified from brains of these α-Syn transgenic mouse models than in control mice. Nevertheless, myelin ultrastructure appeared intact. To further investigate the effect of α-Syn on myelin abnormalities, we systematically analyzed the striatum, a brain region associated with neurodegeneration in PD. An age and disease-dependent loss of myelin basic protein (MBP) signal was detected by immunohistochemistry in striatal striosomes (patches). The age-dependent loss of MBP signal was associated with lower P25α levels in oligodendrocytes. In addition, we found that α-Syn inhibited oligodendrocyte maturation and the formation of membranous sheets in vitro. Based on these results we concluded that neuronal α-Syn is involved in the regulation and/or maintenance of myelin phospholipid. However, axonal hypomyelination in the PD models is evident only in progressive stages of the disease and associated with α-Syn toxicity.

Keywords: Myelin; Parkinson’s disease; Phospholipids; α-Synuclein.


Figures
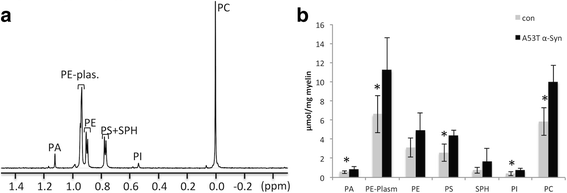
Fig. 1
Fig. 1
Higher levels of phospholipids in purified myelin from neuronal α-Syn-expressing mouse brains. a 31P NMR spectra of a sample consisting of a chloroform/methanol extract of purified myelin obtained from a Thy-1 human wt α-Syn tg mouse brain. The 31P NMR spectra were obtained with a 500 MHz NMR spectrometer (Bruker, Germany) with a 5 mm broadband probe. The 31P chemical shifts were assigned according to standard phosphatidic acid (PA) and phosphatidylserine (PS), spiked into the sample and referenced to phosphatidylcholine (PC) pick at 0 ppm. b The area under the curves was calculated for samples of A53T α-Syn and control mouse brains and the relative amount of specific phospholipids was calculated using the MNova data processing program (Mestrelab Research); mean ± SD of n = 5 mouse brains; *, < 0.05, one-way ANOVA. phosphatidylethanolamine plasmalogen (PE-plasm); phosphatidylethanolamine (PE); sphingomyelin (SPH); phosphatidylinositol (PI); phosphatidylcholin (PC)
Fig. 2
Fig. 2
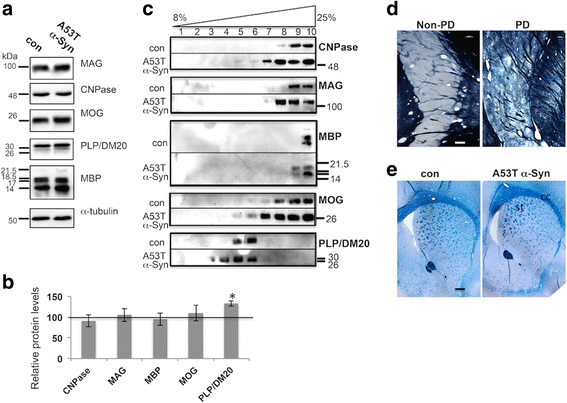
Myelin proteins, membrane flotation and histology. a Western blot showing myelin proteins in preparations of purified myelin from A53T α-Syn and control mouse brains at 4–6 months of age (n = 5–6 mice). b Bars showing mean ± SD of the indicated myelin protein levels, in whole brain protein extracts, of A53T α-Syn at 12–14 months (n = 8–9 mice). Presented as a percent of control age-matched mouse brain, set at 100% (vertical line) *, < 0.05, one-way ANOVA. c Flotation assay showing the distribution of detergent-soluble myelin membrane particles into a 8–25% nycodenz gradient. Purified myelin preparations of A53T α-Syn and control mouse brains at 12 months of age, analyzed in parallel. Aliquots of gradient fractions analyzed by Western blotting using the specified antibodies. Representative blot of n = 3. 2', 3'-cyclic nucleotide 3'-phosphodiesterase (CNPase); myelin associated glycoprotein (MAG); myelin basic protein (MBP); myelin oligodendrocyte glycoprotein (MOG); proteolipid protein (PLP). d The caudate nucleus in coronally sectioned human brain hemisphere (100 μm), including striosomes (dark strips) and matrix (light staining) of a 90-year old female without PD (non-PD) and a 68-year-old female PD patient with advanced disease (neuropathological stage 5). Sections were stained for myelin using a modified Pal-Weigert method. Scale bar, 500 μm. Stained brain sections were provided by the Braak laboratory (University of Ulm, Ulm, Germany). e Coronal brain sections (6 μm, paraffin embedded) of A53T α-Syn and control mice at 12 months of age stained with Luxol Fast Blue/Periodic Acid Schiff, showing the corpus callosum (cc) and striatum (st). Scale bar, 500 μm
Fig. 3
Fig. 3
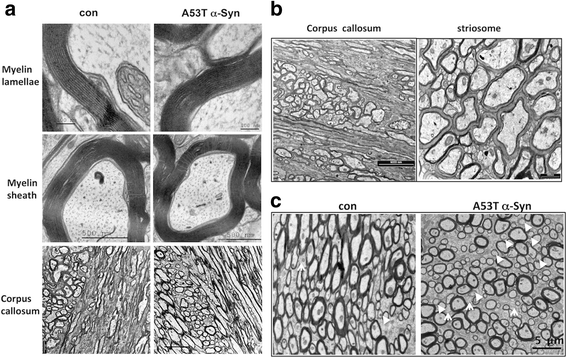
Myelin ultrastructure. a Representative electron micrographs of myelin ultrastructure in 12 month-old A53T α-Syn and age-matched control mouse brains. Coronal sections were prepared from a brain region containing the corpus callosum and rostro-dorsal striatum (with the size of the lateral ventricle as a reference for section position). b Electron micrographs as in (a) showing corpus callosum and striosome of a 5 month-old A53T α-Syn tg mouse brain. c Electron micrographs of striosomes in 12 month-old A53T and age-matched control brains. Arrow, point at sparsely myelinated axons
Fig. 4
Fig. 4
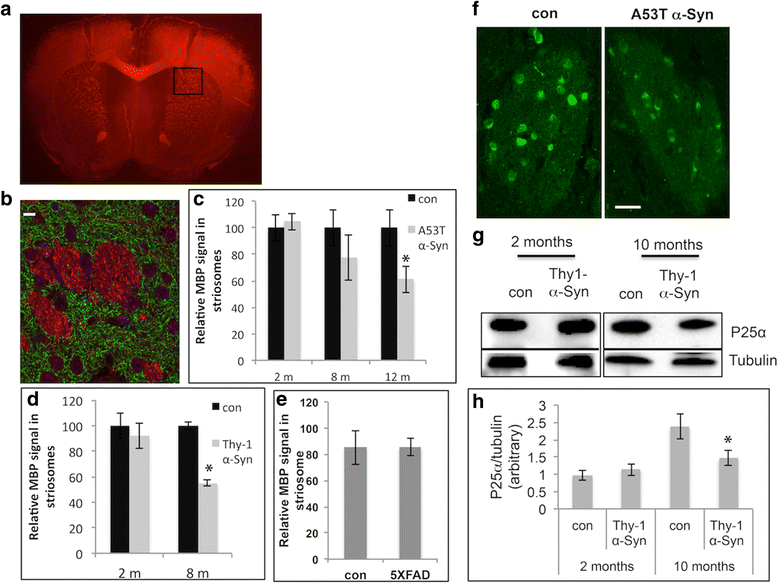
Age-dependent loss of MBP and P25α signals in striosomes (patches). a A coronal brain section (6 μm, paraffin embedded) from a 12 month-old A53T α-Syn mouse, stained with anti-MBP antibody. Black square shows area of interest. b Higher magnification of the area of interest from (a) in a consecutive section, double stained with anti-MBP (red) and anti-tyrosine hydroxylase (TH, green) antibodies. Scale bar, 100 μm. c Quantification of MBP signal inside striosomes. Bars represent mean ± SD of n = 4 A53T and control mice at 2, 8 and 12 months of age. *, < 0.05, one-way ANOVA. d Quantification of MBP signal in striosomes of Thy-1 α-Syn tg and age-matched control mouse brains determined at 2 and 8 months of age. Bars represent mean ± SD of n = 4 mice. *, < 0.05, one-way ANOVA. e Quantification of MBP signal in striosomes of 12 month-old 5XFAD and control mice. f Coronal brain sections containing rostral-dorsal striatum (6 μm, paraffin embedded) of 12 month-old A53T α-Syn mouse and age-matched control immunoreacted with anti-P25α antibody and showing a striosome. Scale bar, 10 μm. g Samples of high-speed supernatant (50 μg protein) obtained from whole Thy-1 α-Syn and control mouse brains at 2 and 10 months of age analyzed by Western blotting and immunoreacted with anti-P25α antibody. h Graph showing quantitation of blots obtained in (G) mean ± SD of n = 4 mice. *, < 0.05, one-way ANOVA
Fig. 5
Fig. 5
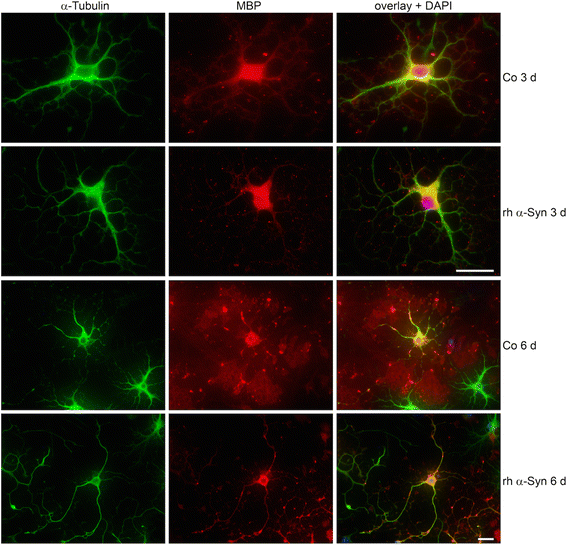
Effects of α-Syn on oligodendrocyte differentiation. Oligodendrocyte progenitor cells were either untreated (Co) or incubated with recombinant human (rh)α-Syn (10 μg/ml) 2 h after plating for the indicated time. Cells were subjected to indirect immunofluorescence staining using antibodies against α-tubulin (green) and MBP (red). Nuclei were stained with DAPI (blue). Scale bar: 20 μm
Fig. 6
Fig. 6
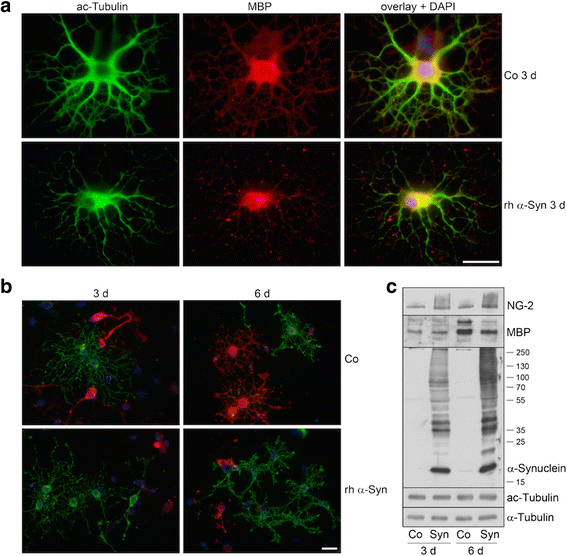
α-Syn impairs oligodendrocyte maturation. Oligodendrocyte progenitor cells were either untreated (Co) or incubated with rh α-Syn (10 μg/ml) 2 h after plating for 3 or 6 days. Cells were subjected to immunocytochemistry using antibodies: a anti-acetylated α-tubulin (green) and anti-MBP (red); b anti-proteoglycan NG-2 (green) and anti-MBP (red). Nuclei were stained with DAPI (blue). Scale bar: 20 μm. c Exogenously applied α-Syn led to an increase in NG-2 and a decrease in MBP levels. Western blot analysis of cell extracts was carried out with antibodies indicated on the right. Numbers on the right indicate molecular weights in kDa
Fig. 7
Fig. 7
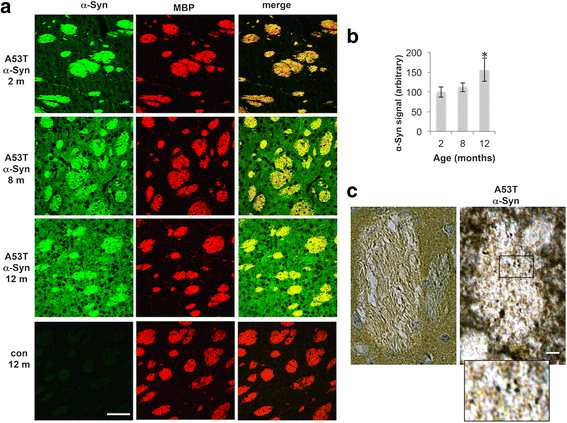
Age-dependent accumulation of α-Syn toxicity in the striatum. a Coronal brain sections containing rostral-dorsal striatum (6 μm, paraffin embedded) of A53T α-Syn mouse at 2, 8 and 12 months of age, or control brain section at 12 months old, immunoreacted with anti-α-Syn antibody (syn - 303). Scale bar, 50 μm b. Quantification of α-Syn signal in striatum of n = 4 mice at each age group. Mean ± SD. *, < 0.05, one-way ANOVA c. Coronal brain sections of A53T α-Syn and control mouse brains, at 12 months of age. Immunoreacted with anti-α-Syn antibody followed by Avidin/Biotin detection. Scale bar, 10 μm. Square present area of magnification

Similar articles

Cited by

References

    1. Bleasel JM, Halliday GM, Kim WS. Animal modeling an oligodendrogliopathy--multiple system atrophy. Acta Neuropathol Commun. 2016;4:12. doi: 10.1186/s40478-016-0279-6. - DOI - PMC - PubMed
    1. Bleasel JM, Wong JH, Halliday GM, Kim WS. Lipid dysfunction and pathogenesis of multiple system atrophy. Acta Neuropathol Commun. 2014;2:15. doi: 10.1186/2051-5960-2-15. - DOI - PMC - PubMed
    1. Blight EG, Dyer WJ. A rapid method of total lipid extraction and purification. Can. J. Biochem. Physiol. 1950;37:911–917. doi: 10.1139/o59-099. - DOI - PubMed
    1. Bozzali M, Wrabetz L. Axonal signals and oligodendrocyte differentiation. Neurochem Res. 2004;29:979–988. doi: 10.1023/B:NERE.0000021242.12455.75. - DOI - PubMed
    1. Braak H, Bohl JR, Muller CM, Rub U, de Vos RA, Del Tredici K. Stanley Fahn Lecture 2005: The staging procedure for the inclusion body pathology associated with sporadic Parkinson's disease reconsidered. Mov Disord. 2006;21:2042–2051. doi: 10.1002/mds.21065. - DOI - PubMed

Publication types

MeSH terms