

Trends in alcohol-related admissions to hospital by age, sex and socioeconomic deprivation in England, 2002/03 to 2013/14
- PMID: 28482876
- PMCID: PMC5423017
- DOI: 10.1186/s12889-017-4265-0
Trends in alcohol-related admissions to hospital by age, sex and socioeconomic deprivation in England, 2002/03 to 2013/14
Abstract
Background: Prevalence of alcohol-related harms in England are among the highest in Europe and represents an important policy issue. Understanding how alcohol-related trends vary by demographic factors is important for informing policy debates. The aim of our study was to examine trends in alcohol-related admissions to hospital in England, with a focus on variations by sex, age and socioeconomic deprivation.
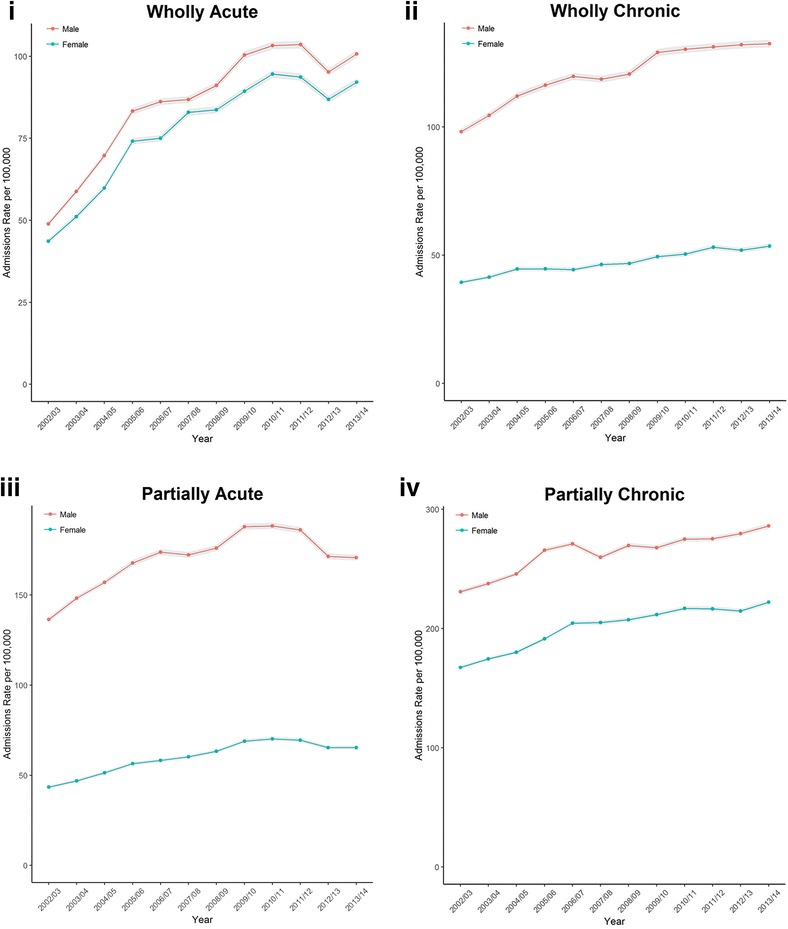
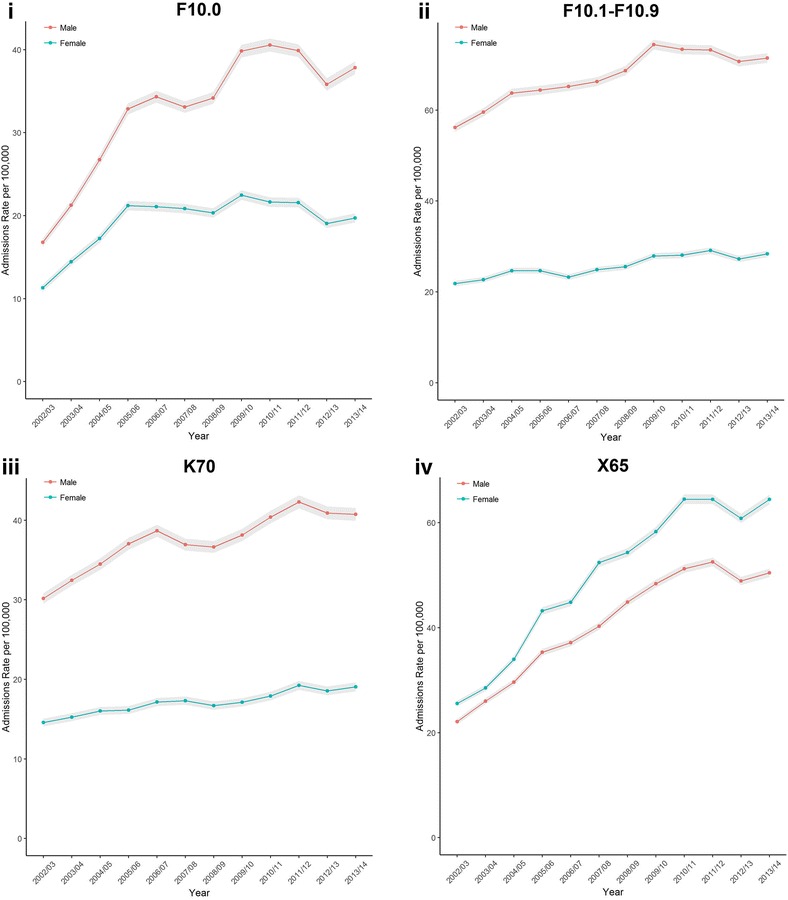
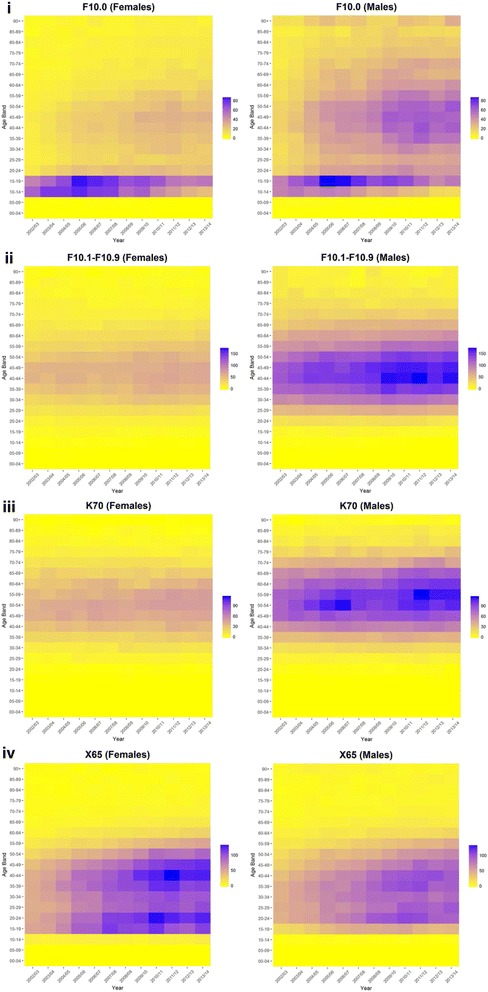
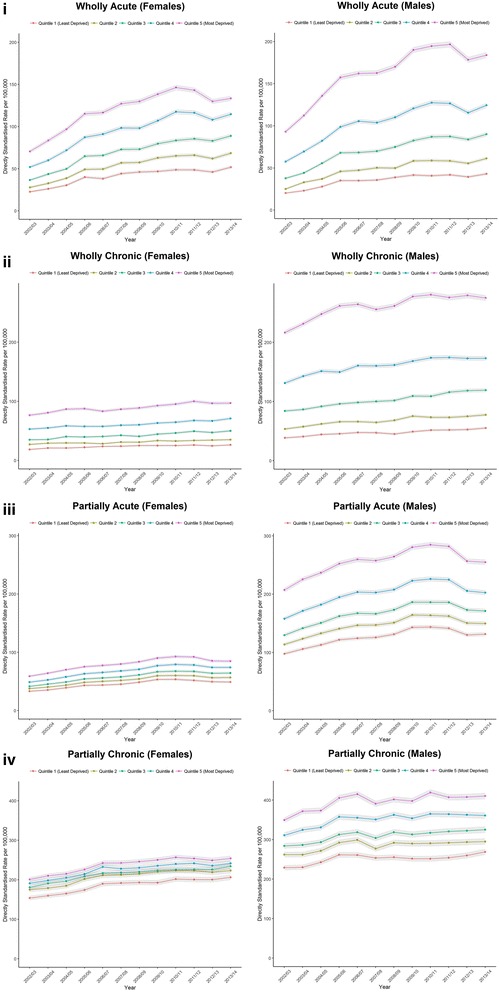
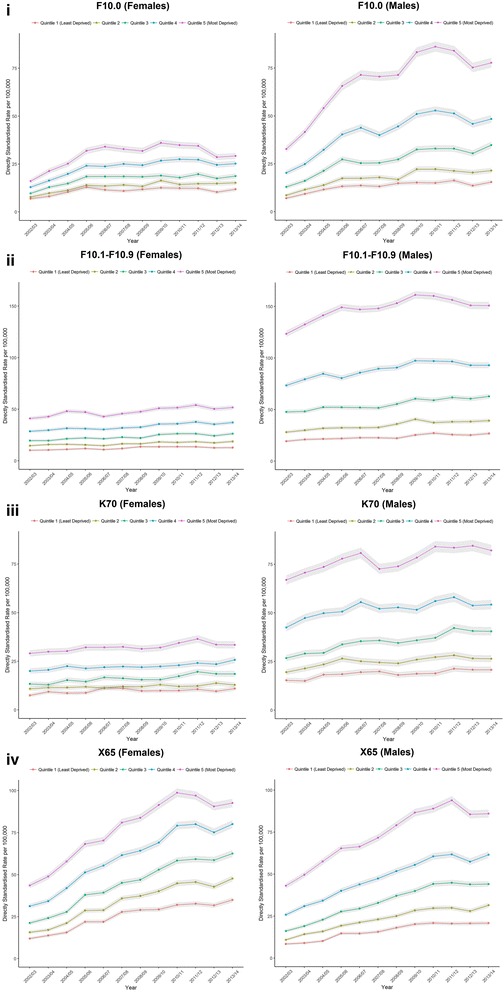
Methods: We used data on hospital admissions for England for the financial years 2002/03 to 2013/14. Our four main outcome variables were acute and chronic conditions wholly and partially attributable to alcohol consumption. We also looked at four specific conditions wholly attributable to alcohol. Socioeconomic deprivation was measured using the English Indices of Deprivation of a patient's residence (categorised by quintile). We calculated crude rates, age-specific rates (visualised by Lexis plots) and directly standardised rates by deprivation category, separately for males and females.
Results: Total admissions for all alcohol-attributable admissions increased from 201,398 in 2002/03 to 303,716 in 2013/14. The relative increase of these admissions was larger than compared to non-alcohol attributable admissions. Acute admissions wholly attributable to alcohol had the largest relative increase of our outcome measures, and displayed a bimodal distribution with higher rates in adolescence/young adults and middle age. Chronic conditions wholly attributable to alcohol were concentrated in middle age (particularly males). While admission rates were generally higher for males, females had higher rates of hospitalisations due to 'Intentional self-poisoning due to alcohol'. We also found evidence of wide social inequalities by level of deprivation, which were wider for men than compared to women across all of our outcome measures other than 'Intentional self-poisoning due to alcohol'.
Conclusions: Our study expands the evidence base to help understand population level trends in alcohol-related admissions by age, sex and socioeconomic deprivation. There have been increasing hospital admissions attributable to alcohol between 2002/03 and 2013/14, particularly concentrated in middle aged males and deprived areas. However, the increase in young females being admitted for 'Intentional self-poisoning due to alcohol' raises additional concerns.
Keywords: Alcohol-induced Disorders; Alcohol-related Disorders; Alcoholic liver diseases; England; Population characteristics; Poverty; Trends.
Figures

References
-
- Newton JN, Briggs ADM, Murray CJL, Dicker D, Foreman KJ, Wang H, et al. Changes in health in England, with analysis by English regions and areas of deprivation, 1990-2013: a systematic analysis for the global burden of disease study 2013. Lancet. 2015;386:2257–2274. doi: 10.1016/S0140-6736(15)00195-6. - DOI - PMC - PubMed
-
- Office for National Statistics. Statistical Bulletin Adult Health in Great Britain, 2012. 2014. Available from: http://www.ons.gov.uk/ons/dcp171778_355938.pdf. Accessed 18 Apr 2017.
MeSH terms
Substances
Grants and funding
LinkOut - more resources
Full Text Sources
Other Literature Sources
