

Sources of Sodium in US Adults From 3 Geographic Regions
- PMID: 28483828
- PMCID: PMC5417577
- DOI: 10.1161/CIRCULATIONAHA.116.024446
Sources of Sodium in US Adults From 3 Geographic Regions
Abstract
Background: Most US adults consume excess sodium. Knowledge about the dietary sources of sodium intake is critical to the development of effective reduction strategies.
Methods: A total of 450 adults were recruited from 3 geographic locations: Birmingham, AL (n=150); Palo Alto, CA (n=150); and the Minneapolis-St. Paul, MN (n=150), metropolitan areas. Equal numbers of women and men from each of 4 race/ethnic groups (blacks, Asians, Hispanics, and non-Hispanic whites) were targeted for recruitment. Four record-assisted 24-hour dietary recalls were collected from each participant with special procedures, which included the collection of duplicate samples of salt added to food at the table and in home food preparation.
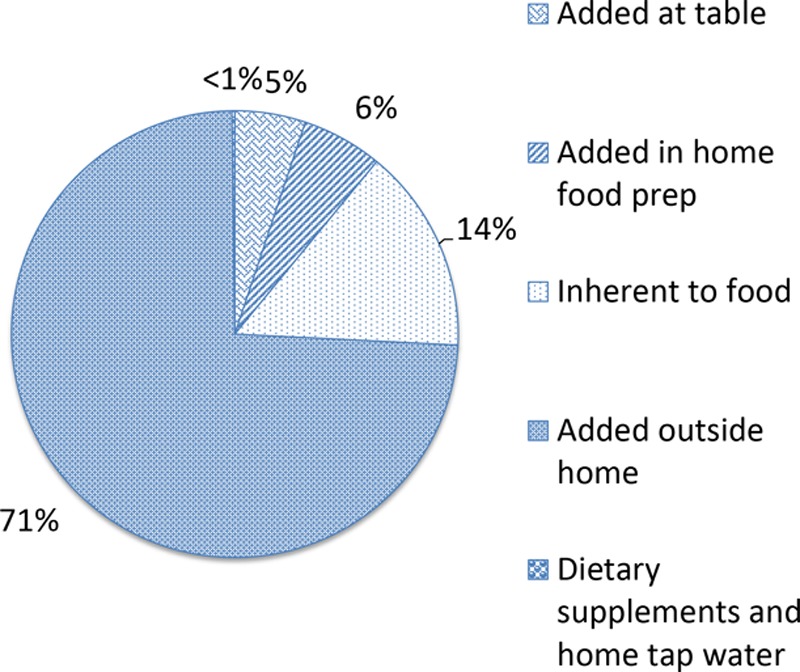
Results: Sodium added to food outside the home was the leading source of sodium, accounting for more than two thirds (70.9%) of total sodium intake in the sample. Although the proportion of sodium from this source was smaller in some subgroups, it was the leading contributor for all subgroups. Contribution ranged from 66.3% for those with a high school level of education or less to 75.0% for those 18 to 29 years of age. Sodium inherent to food was the next highest contributor (14.2%), followed by salt added in home food preparation (5.6%) and salt added to food at the table (4.9%). Home tap water consumed as a beverage and dietary supplement and nonprescription antacids contributed minimally to sodium intake (<0.5% each).
Conclusions: Sodium added to food outside the home accounted for ≈70% of dietary sodium intake. This finding is consistent with the 2010 Institute of Medicine recommendation for reduction of sodium in commercially processed foods as the primary strategy to reduce sodium intake in the United States.
Clinical trial registration: URL: http://www.clinicaltrials.gov. Unique identifier: NCT02474693.
Keywords: diet; hypertension; sodium.
© 2017 The Authors.
Figures
Comment in
-
Sources of Dietary Sodium: Implications for Patients, Physicians, and Policy.Circulation. 2017 May 9;135(19):1784-1787. doi: 10.1161/CIRCULATIONAHA.117.027933. Circulation. 2017. PMID: 28483829 Free PMC article. No abstract available.
References
-
- US Department of Agriculture and US Department of Health and Human Services. Dietary Guidelines for Americans, 1980. https://health.gov/dietaryguidelines/history.htm#6. Accessed January 31, 2017.
-
- Jackson S, Coleman King S, Zhao L, Cogswell M. Prevalence of excess sodium intake in the United States: NHANES, 2009–2012. Morb Mortal Wkly Rep. 2016;64:1393–1397. - PubMed
-
- Institute of Medicine, Committee on Strategies to Reduce Sodium Intake. Strategies to Reduce Sodium Intake in the United States. Washington, DC: National Academies Press; 2010.
-
- Centers for Disease Control and Prevention. Food categories contributing the most to sodium consumption: United States, 2007–2008. Morb Mortal Wkly Rep. 2012;61:92–98. - PubMed
MeSH terms
Substances
Associated data
Grants and funding
LinkOut - more resources
Full Text Sources
Other Literature Sources
Medical
Miscellaneous
