Review
. 2017 Jun 19;372(1723):20160138.
doi: 10.1098/rstb.2016.0138.

Evolution of phenotypic plasticity in extreme environments

Affiliations
Review

Evolution of phenotypic plasticity in extreme environments

Luis-Miguel Chevin et al. Philos Trans R Soc Lond B Biol Sci. .

Abstract

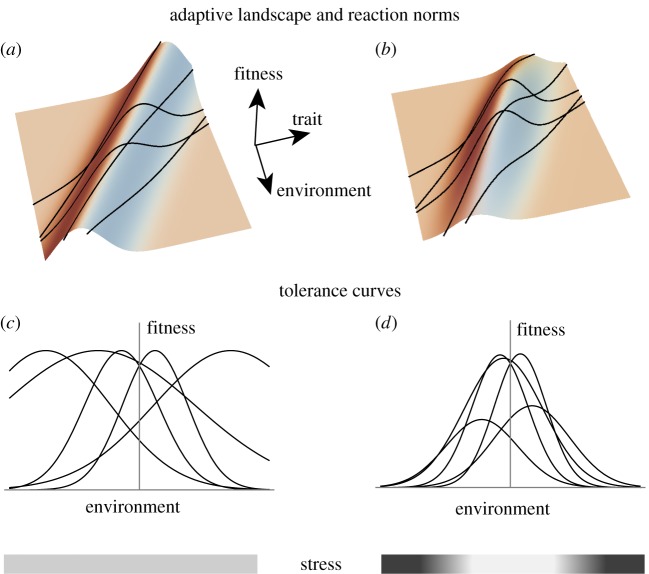
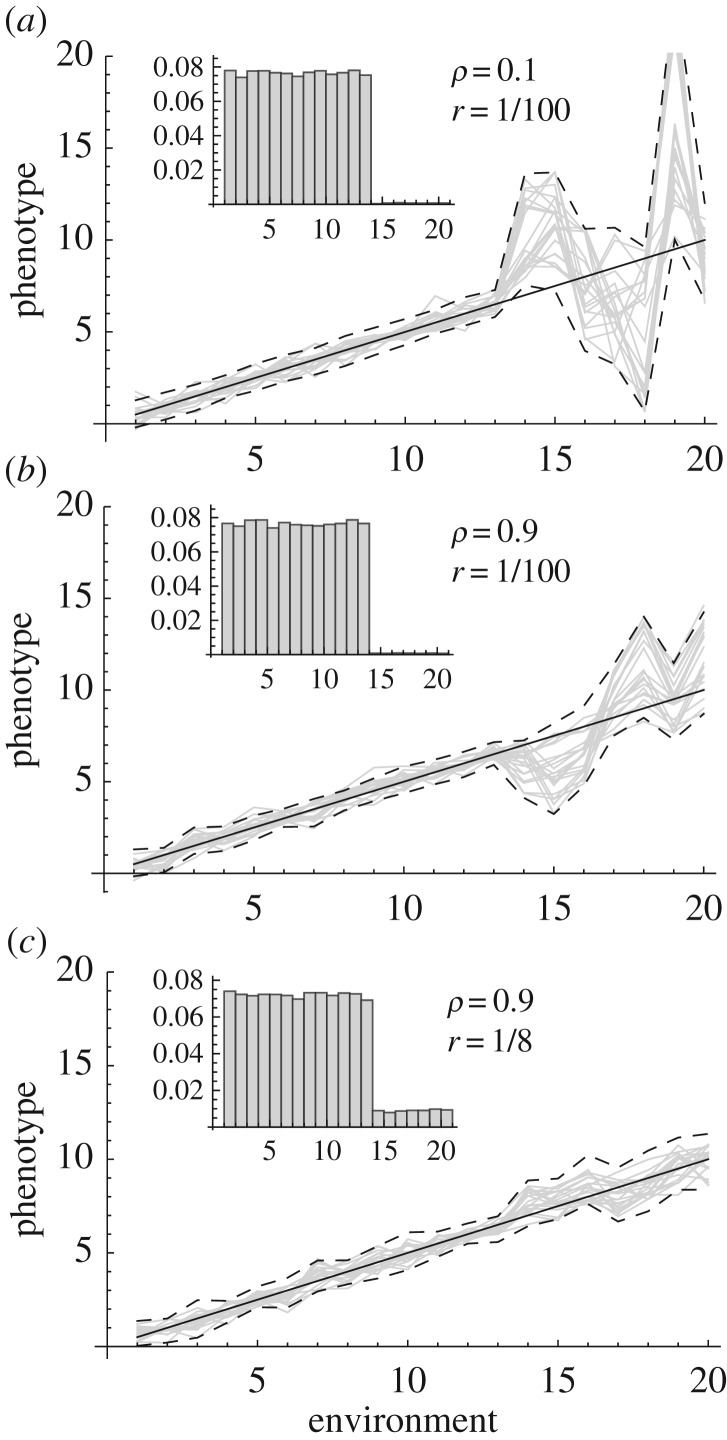
Phenotypic plasticity, if adaptive, may allow species to counter the detrimental effects of extreme conditions, but the infrequent occurrence of extreme environments and/or their restriction to low-quality habitats within a species range means that they exert little direct selection on reaction norms. Plasticity could, therefore, be maladaptive under extreme environments, unless genetic correlations are strong between extreme and non-extreme environmental states, and the optimum phenotype changes smoothly with the environment. Empirical evidence suggests that populations and species from more variable environments show higher levels of plasticity that might preadapt them to extremes, but genetic variance for plastic responses can also be low, and genetic variation may not be expressed for some classes of traits under extreme conditions. Much of the empirical literature on plastic responses to extremes has not yet been linked to ecologically relevant conditions, such as asymmetrical fluctuations in the case of temperature extremes. Nevertheless, evolved plastic responses are likely to be important for natural and agricultural species increasingly exposed to climate extremes, and there is an urgent need to collect empirical information and link this to model predictions.This article is part of the themed issue 'Behavioural, ecological and evolutionary responses to extreme climatic events'.

Keywords: adaptation; environmental stress; environmental tolerance; extreme environments; genetic constraints; phenotypic plasticity.


Conflict of interest statement

We have no competing interests.

Figures

Figure 1.
Figure 1.
Maladaptation, habitat quality and environmental stress. (a,b) Generalized adaptive landscapes, with fitness as a function of the trait and the environment (following Chevin et al. [11]). The ridge in the adaptive landscape marks the position of an optimum phenotype that changes with the environment. Projected onto this landscape are linear reaction norms (black lines) for different genotypes, with varying slopes and elevations (intercepts). (a) Maximum fitness is the same in all environments; (b) extreme environments are low-quality habitats where fitness is lower, even for the locally best phenotype. (c,d) The resulting tolerance curves, with fitness plotted against the environment. These are obtained for each genotype by ‘slicing’ through the above fitness landscape along the line given by the reaction norm. Without habitat quality effects (a), all fitness variation is caused by genotype-specific maladaptation, such that no environment is stressful per se for the whole species (c). By contrast, with differences in habitat quality (b), stress generally increases towards extreme environments, where the maximum fitness of all genotypes is lower, regardless of how well adapted they are relative to other genotypes (d).
Figure 2.
Figure 2.
Reaction norm evolution in extreme versus common environments. The evolution of reaction norms was simulated over a range of environments that differ in frequency, such that the higher third of the environmental range consists of extreme environments that are much rarer than the rest. The odds ratio r of the frequency of rare over common environments is indicated in each panel (ac), and the distribution of these environments is illustrated graphically by the inset histograms. The phenotype expressed at each value of environmental unit was treated as a character state, with same additive genetic variance (G = 1) in all environments, and additive genetic correlation ρɛ| between character states expressed Δɛ environmental units apart. We simulated 20 000 generations of evolution under random genetic drift (with Ne = 1000) and natural selection caused by environmentally driven temporal fluctuations in an optimum phenotype, allowing for partial unpredictability of selection (see electronic supplementary material for more details on simulations). Grey lines show population mean reaction norms at 20 randomly picked generations, and dashed lines represent the 95% interval over all generations. The continuous line shows the expected optimum phenotype experienced by individuals developing in each of the environments.

References

    1. Parmesan C. 2006. Ecological and evolutionary responses to recent climate change. Annu. Rev. Ecol. Evol. Syst. 37, 637–669. (10.1146/Annurev.Ecolsys.37.091305.110100) - DOI
    1. Hoffmann AA, Sgro CM. 2011. Climate change and evolutionary adaptation. Nature 470, 479–485. (10.1038/nature09670) - DOI - PubMed
    1. Ozgul A, Childs DZ, Oli MK, Armitage KB, Blumstein DT, Olson LE, Tuljapurkar S, Coulson T. 2010. Coupled dynamics of body mass and population growth in response to environmental change. Nature 466, 482–485. (10.1038/Nature09210) - DOI - PMC - PubMed
    1. Ozgul A, Tuljapurkar S, Benton TG, Pemberton JM, Clutton-Brock TH, Coulson T. 2009. The dynamics of phenotypic change and the shrinking sheep of St. Kilda. Science 325, 464–467. (10.1126/Science.1173668) - DOI - PMC - PubMed
    1. Ellner SP, Geber MA, Hairston NG Jr. 2011. Does rapid evolution matter? Measuring the rate of contemporary evolution and its impacts on ecological dynamics. Ecol. Lett. 14, 603–614. (10.1111/j.1461-0248.2011.01616.x) - DOI - PubMed

LinkOut - more resources