Review
. 2017 Jun 19;372(1723):20160141.
doi: 10.1098/rstb.2016.0141.

Learning from single extreme events

Affiliations
Review

Learning from single extreme events

Res Altwegg et al. Philos Trans R Soc Lond B Biol Sci. .

Abstract

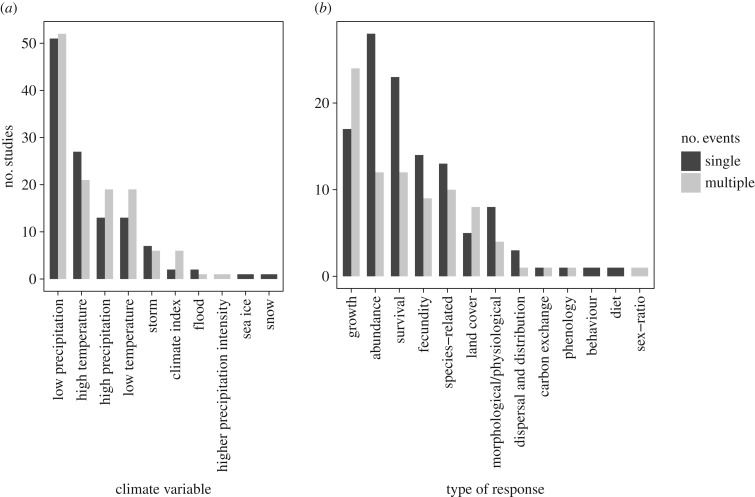
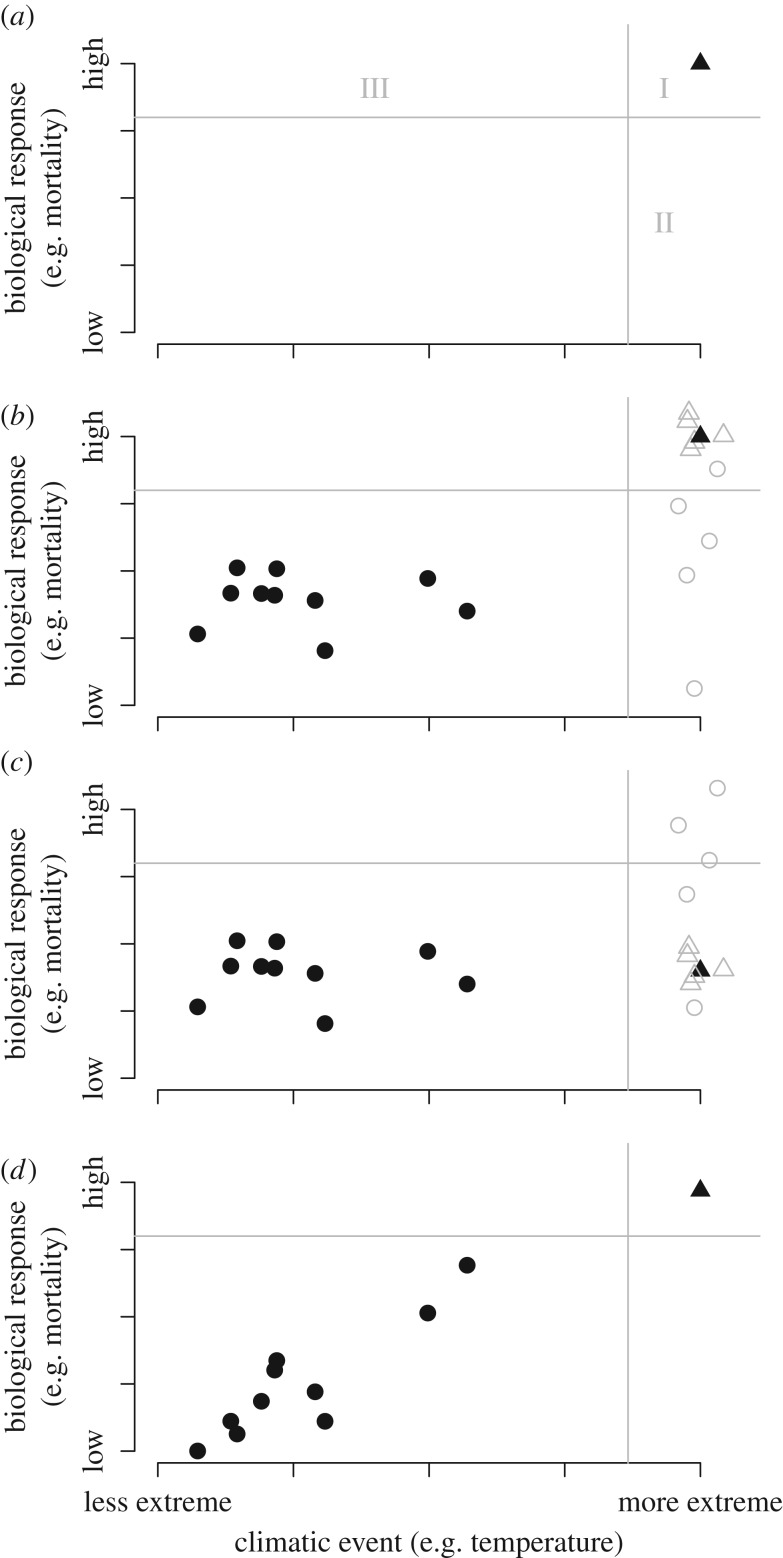
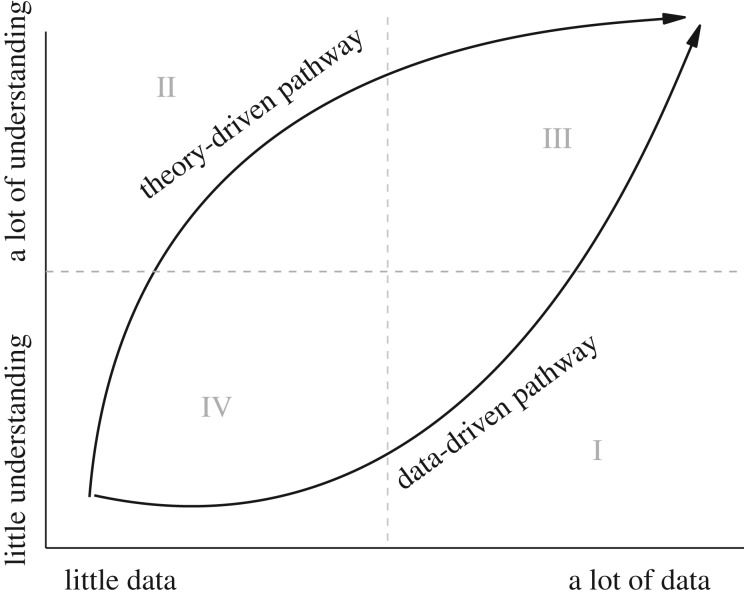
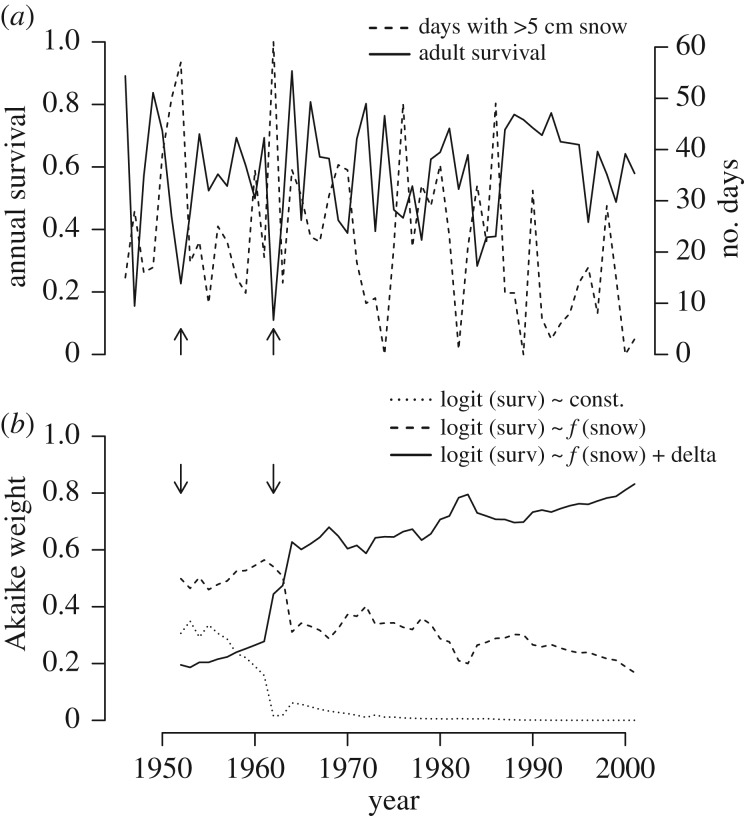
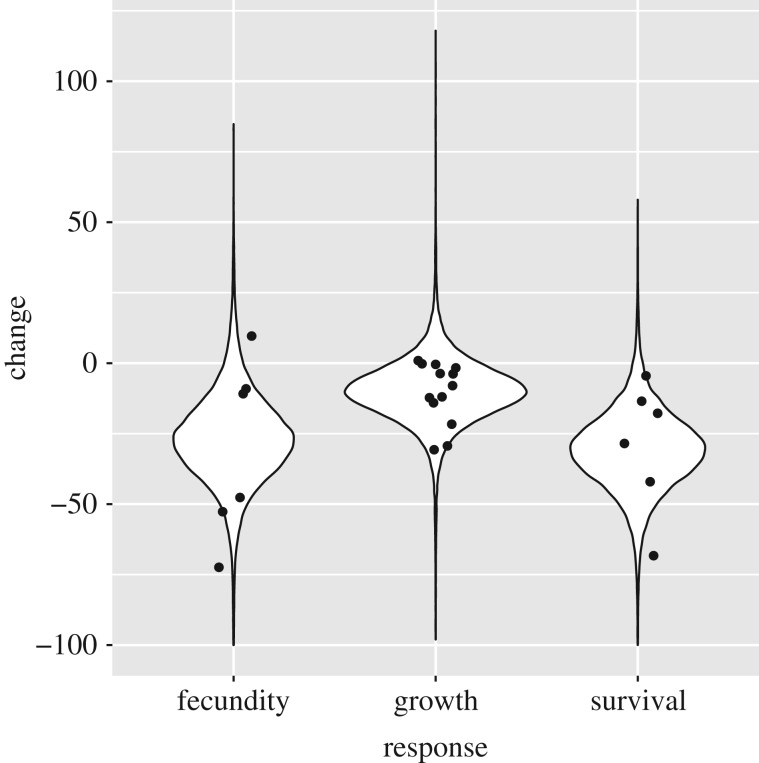
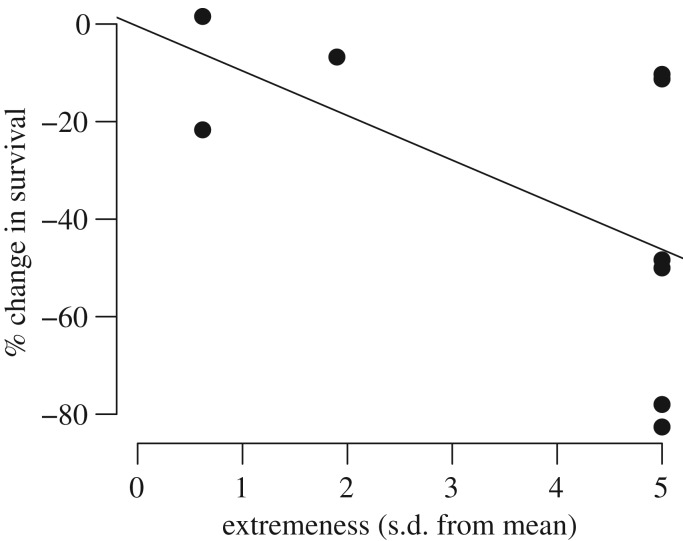
Extreme climatic events (ECEs) have a disproportionate effect on ecosystems. Yet much of what we know about the ecological impact of ECEs is based on observing the effects of single extreme events. We examined what characteristics affect the strength of inference that can be drawn from single-event studies, which broadly fell into three categories: opportunistic observational studies initiated after an ECE, long-term observational studies with data before and after an ECE and experiments. Because extreme events occur rarely, inference from such single-event studies cannot easily be made under the usual statistical paradigm that relies on replication and control. However, single-event studies can yield important information for theory development and can contribute to meta-analyses. Adaptive management approaches can be used to learn from single, or a few, extreme events. We identify a number of factors that can make observations of single events more informative. These include providing robust estimates of the magnitude of ecological responses and some measure of climatic extremeness, collecting ancillary data that can inform on mechanisms, continuing to observe the biological system after the ECE and combining observational data with experiments and models. Well-designed single-event studies are an important contribution to our understanding of biological effects of ECEs.This article is part of the themed issue 'Behavioural, ecological and evolutionary responses to extreme climatic events'.

Keywords: adaptive management; climatic extreme; long-term study; meta-analysis; single observation; value of information.


Conflict of interest statement

We have no competing interests.

Figures

Figure 1.
Figure 1.
Characteristics of a representative sample of observational studies on extreme climatic events (from Bailey & van de Pol [8]). See electronic supplementary material, appendix S1, for details. (a) The types of extreme climatic events investigated (n = 174). (b) The types of ecological responses investigated (n = 170). Bars represent the number of studies in each category and are further subdivided by whether a single extreme event (black) or multiple extreme events (grey) were observed.
Figure 2.
Figure 2.
Hypothetical datasets illustrating different types of single-event studies of extreme climatic events. (a) Opportunistic single-event studies document the ecological response of a single climatic event. These could be defined as extreme events because the climatic event was unusual (vertical grey line: a climatic event to the right of this line, in areas I and II, is defined to be extreme), the ecological response is unusual (horizontal grey line: a response above this line, in areas I and III, is defined as being extreme) or both (area I). (b) A single extreme event (black triangle) is observed as part of a long-term study (black dots are non-extreme events). In this set-up, it is not possible to distinguish whether the extreme climatic event led to an increased mean response (open grey triangles represent unobserved replications of similarly extreme climatic events) or increased variance (grey circles represent unobserved replications of similarly extreme climatic events), as the observed outcome is likely under either scenario. (c) An extreme climatic event led to a response (black triangle) that does not look unusual based on observations under non-extreme events (black dots). Either the extreme climatic event had no effect on the ecological system (open grey triangles), or it increased the variance in the response but we happened to observe a value that would be typical of less extreme conditions (grey circles). (d) An extreme climatic event led to an extreme response (black triangle) that is nevertheless in line with the relationship between the system's response and the environment under non-extreme climatic conditions (black dots).
Figure 3.
Figure 3.
Pathways to knowledge. Accumulating knowledge is a continuous interplay between data accumulation (along the x-axis) and development of a mechanistic understanding of the system under study (along y-axis). In some fields—e.g. some areas of molecular biology, market research—data accumulate rapidly and a data-driven pathway to knowledge is most productive. In other fields—e.g. the study of ecological effects of extreme events—observations are hard to come by. These fields need to rely strongly on theory development that may be based on relatively little data at first. This is what we call the theory-driven pathway. Adapted from Holling [35].
Figure 4.
Figure 4.
(a) Number of days with more than 5 cm of snow measured at a central location (Bern) in Switzerland between 1946 and 2001 and annual survival estimates of adult barn owls (T. alba) in Switzerland, estimated from ringing data [15]. The arrows mark two extreme climatic events (1952, 1962). (b) Akaike weights of three models representing different hypotheses about how survival in barn owls responds to snow. The Akaike weights measure the relative support each model has from the data up to a particular year, and sum to one in a particular year. A change in Akaike weight, as more data are included over time, represents learning.
Figure 5.
Figure 5.
Violin plots of the posterior distributions for the mean change in fecundity, growth and survival in response to the heatwave that affected Europe in 2003, obtained through a Bayesian meta-analysis. The dots show the reported values, slightly jittered.
Figure 6.
Figure 6.
Relationship between the intensity of a heatwave (measured in number of standard deviations from the mean) and change in survival. The dots are the estimates taken from single-event studies, and the black line is the best fitting linear regression line.

References

    1. Bumpus H. 1898. The elimination of the unfit as illustrated by the introduced sparrow, Passer domesticus. Biol. Lect. Deliv. Mar. Biol. Lab. Woods Hole 1898, 209–228.
    1. Keller LF, Arcese P, Smith JNM, Hochachka WM, Stearns SC. 1994. Selection against inbred song sparrows during a natural population bottleneck. Nature 372, 356–357. (10.1038/372356a0) - DOI - PubMed
    1. Ummenhofer CC, Meehl GA. 2017. Extreme weather and climate events with ecological relevance: a review. Phil. Trans. R. Soc. B 372, 20160135 (10.1098/rstb.2016.0135) - DOI - PMC - PubMed
    1. Jentsch A, Beierkuhnlein C. 2008. Research frontiers in climate change: effects of extreme meteorological events on ecosystems. C. R. Geosci. 340, 621–628. (10.1016/j.crte.2008.07.002) - DOI
    1. Smith MD. 2011. An ecological perspective on extreme climatic events: a synthetic definition and framework to guide future research. J. Ecol. 99, 656–663. (10.1111/j.1365-2745.2011.01798.x) - DOI