Processes Underlying a Reproductive Barrier in indica- japonica Rice Hybrids Revealed by Transcriptome Analysis
- PMID: 28483876
- PMCID: PMC5490891
- DOI: 10.1104/pp.17.00093
Processes Underlying a Reproductive Barrier in indica- japonica Rice Hybrids Revealed by Transcriptome Analysis
Abstract
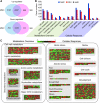
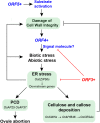
In rice (Oryza sativa), hybrids between indica and japonica subspecies are usually highly sterile, which provides a model system for studying postzygotic reproductive isolation. A killer-protector system, S5, composed of three adjacent genes (ORF3, ORF4, and ORF5), regulates female gamete fertility of indica-japonica hybrids. To characterize the processes underlying this system, we performed transcriptomic analyses of pistils from rice variety Balilla (BL), Balilla with transformed ORF5+ (BL5+) producing sterile female gametes, and Balilla with transformed ORF3+ and ORF5+ (BL3+5+) producing fertile gametes. RNA sequencing of tissues collected before (MMC), during (MEI), and after (AME) meiosis of the megaspore mother cell detected 19,269 to 20,928 genes as expressed. Comparison between BL5+ and BL showed that ORF5+ induced differential expression of 8,339, 6,278, and 530 genes at MMC, MEI, and AME, respectively. At MMC, large-scale differential expression of cell wall-modifying genes and biotic and abiotic response genes indicated that cell wall integrity damage induced severe biotic and abiotic stresses. The processes continued to MEI and induced endoplasmic reticulum (ER) stress as indicated by differential expression of ER stress-responsive genes, leading to programmed cell death at MEI and AME, resulting in abortive female gametes. In the BL3+5+/BL comparison, 3,986, 749, and 370 genes were differentially expressed at MMC, MEI, and AME, respectively. Large numbers of cell wall modification and biotic and abiotic response genes were also induced at MMC but largely suppressed at MEI without inducing ER stress and programed cell death , producing fertile gametes. These results have general implications for the understanding of biological processes underlying reproductive barriers.
© 2017 American Society of Plant Biologists. All Rights Reserved.
Figures


Similar articles
-
Effect analysis of S5-interacting genes on rice hybrid sterility using nontransgenic gamete killer.Plant Sci. 2025 Mar;352:112357. doi: 10.1016/j.plantsci.2024.112357. Epub 2024 Dec 13. Plant Sci. 2025. PMID: 39675386
-
A killer-protector system regulates both hybrid sterility and segregation distortion in rice.Science. 2012 Sep 14;337(6100):1336-40. doi: 10.1126/science.1223702. Science. 2012. PMID: 22984070
-
Genome-wide transcriptome analysis of female-sterile rice ovule shed light on its abortive mechanism.Planta. 2016 Nov;244(5):1011-1028. doi: 10.1007/s00425-016-2563-x. Epub 2016 Jun 29. Planta. 2016. PMID: 27357232
-
Hybrid sterility in plant: stories from rice.Curr Opin Plant Biol. 2010 Apr;13(2):186-92. doi: 10.1016/j.pbi.2010.01.002. Epub 2010 Feb 10. Curr Opin Plant Biol. 2010. PMID: 20153244 Review.
-
Advances on the Study of Diurnal Flower-Opening Times of Rice.Int J Mol Sci. 2023 Jun 26;24(13):10654. doi: 10.3390/ijms241310654. Int J Mol Sci. 2023. PMID: 37445832 Free PMC article. Review.
Cited by
-
Classifying Oryza sativa accessions into Indica and Japonica using logistic regression model with phenotypic data.PeerJ. 2019 Nov 7;7:e7259. doi: 10.7717/peerj.7259. eCollection 2019. PeerJ. 2019. PMID: 31720092 Free PMC article.
-
Recurrent breakdown and rebalance of segregation distortion in the genomes: battle for the transmission advantage.aBIOTECH. 2020 Jul 8;1(4):246-254. doi: 10.1007/s42994-020-00023-0. eCollection 2020 Oct. aBIOTECH. 2020. PMID: 36304131 Free PMC article. Review.
-
Tackling Plant Meiosis: From Model Research to Crop Improvement.Front Plant Sci. 2018 Jun 19;9:829. doi: 10.3389/fpls.2018.00829. eCollection 2018. Front Plant Sci. 2018. PMID: 29971082 Free PMC article. Review.
-
Development and Genome-Wide Analysis of a Blast-Resistant japonica Rice Variety.Plants (Basel). 2023 Oct 11;12(20):3536. doi: 10.3390/plants12203536. Plants (Basel). 2023. PMID: 37896000 Free PMC article.
-
Exploring the Relationships Between Yield and Yield-Related Traits for Rice Varieties Released in China From 1978 to 2017.Front Plant Sci. 2019 May 7;10:543. doi: 10.3389/fpls.2019.00543. eCollection 2019. Front Plant Sci. 2019. PMID: 31134107 Free PMC article.
References
MeSH terms
LinkOut - more resources
Full Text Sources
Other Literature Sources
Molecular Biology Databases

