. 2017 May 23;114(21):5361-5366.
doi: 10.1073/pnas.1618567114. Epub 2017 May 8.

Carbon dioxide sources from Alaska driven by increasing early winter respiration from Arctic tundra

Affiliations

Carbon dioxide sources from Alaska driven by increasing early winter respiration from Arctic tundra

Róisín Commane et al. Proc Natl Acad Sci U S A. .

Abstract

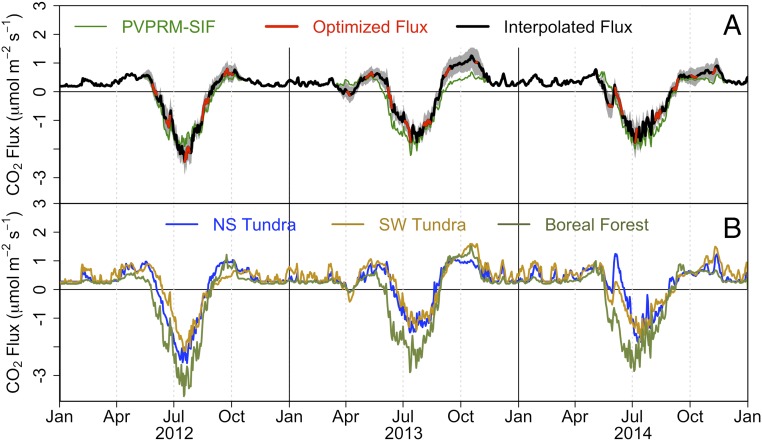
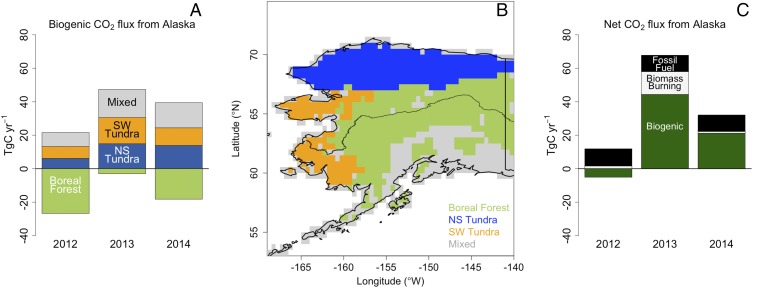
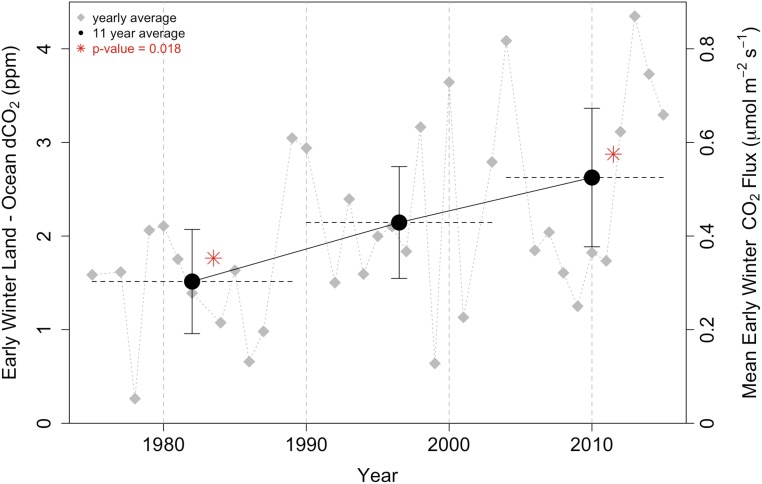
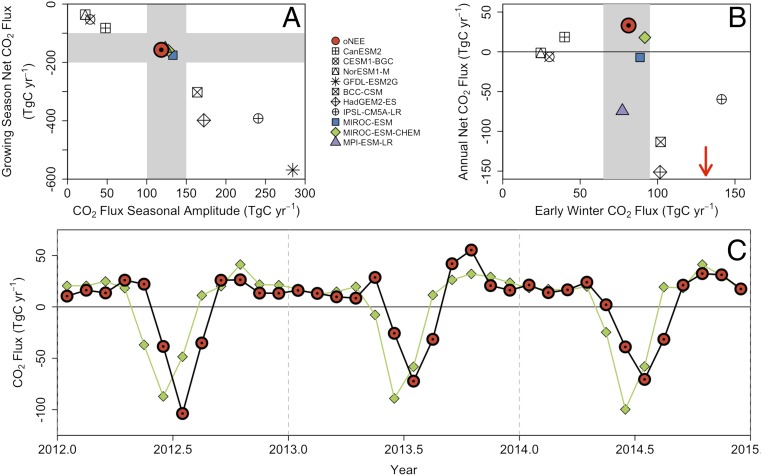
High-latitude ecosystems have the capacity to release large amounts of carbon dioxide (CO2) to the atmosphere in response to increasing temperatures, representing a potentially significant positive feedback within the climate system. Here, we combine aircraft and tower observations of atmospheric CO2 with remote sensing data and meteorological products to derive temporally and spatially resolved year-round CO2 fluxes across Alaska during 2012-2014. We find that tundra ecosystems were a net source of CO2 to the atmosphere annually, with especially high rates of respiration during early winter (October through December). Long-term records at Barrow, AK, suggest that CO2 emission rates from North Slope tundra have increased during the October through December period by 73% ± 11% since 1975, and are correlated with rising summer temperatures. Together, these results imply increasing early winter respiration and net annual emission of CO2 in Alaska, in response to climate warming. Our results provide evidence that the decadal-scale increase in the amplitude of the CO2 seasonal cycle may be linked with increasing biogenic emissions in the Arctic, following the growing season. Early winter respiration was not well simulated by the Earth System Models used to forecast future carbon fluxes in recent climate assessments. Therefore, these assessments may underestimate the carbon release from Arctic soils in response to a warming climate.

Keywords: Alaska; Arctic; carbon dioxide; early winter respiration; tundra.


Conflict of interest statement

The authors declare no conflict of interest.

Figures

Fig. 1.
Fig. 1.
Time series of biogenic CO2 fluxes for Alaska during 2012–2014 calculated from CARVE aircraft data. (A) Mean daily net biogenic CO2 flux for Alaska during 2012–2014, with modeled (PVPRM-SIF) CO2 flux (green) and the aircraft optimized net CO2 flux (red) and interpolated aircraft optimized net CO2 flux (black). Our approach for estimating these fluxes and the uncertainty range (shown with shading) is described in SI Appendix, Calculation of the Additive Flux Correction. (B) Optimized biogenic CO2 fluxes for different regions in Alaska: NS tundra (blue), SW tundra (orange), and boreal forests (green).
Fig. 2.
Fig. 2.
CO2 budget for Alaska 2012–2014. (A) Net biogenic carbon budget for boreal forests (light green), Yukon−Kuskokwim Delta of southwest Alaska and the Seward Peninsula to the west (SW tundra) (orange), NS tundra (blue), and the mixed areas or areas of Alaska not included in other regions (gray) (in teragrams of carbon per year) calculated from the aircraft optimized CO2 flux for 2012, 2013, and 2014. (B) Map of the regional areas described in A. Negative fluxes indicate uptake of CO2 by the biosphere. (C) Net carbon fluxes for Alaska during 2012–2014 from biogenic (dark green), biomass burning (white), and fossil fuel (black) components.
Fig. 3.
Fig. 3.
Early winter (October through December) land−ocean sector CO2 signal (dCO2) measured at the NOAA BRW tower in Barrow, AK, since 1975. The tower is influenced by a large area of the North Slope. The early winter land sector dCO2 has increased by 73.4% ± 10.8% at BRW over 41 y [1.51 ± 0.64 ppm in 1975–1989 to 2.62 ± 0.85 ppm in 2004–2015, a statistically significant increase with P value 0.018, indicated by red asterisks (*)]. Shown are the yearly averaged data (gray diamonds) and 11-y average (black circles) with 95% confidence intervals (error bars) and dashed lines to indicate the years sampled. Using the fluxes calculated as part of the aircraft optimization, the mean flux of CO2 on the North Slope has increased by a comparable amount, from 0.24 μmol⋅m−2⋅s−1 in 1975–1989 to 0.43 μmol⋅m−2⋅s−1 in 2004–2015.
Fig. 4.
Fig. 4.
CMIP5 ESM behavior compared with the monthly mean optimized CO2 flux from our analysis. (A) Growing season net CO2 flux (in teragrams of carbon per year) against the CO2 flux seasonal amplitude (in teragrams of carbon per year) indicate three model groupings. (B) Annual net CO2 flux (in teragrams of carbon per year) against early winter (September through December) CO2 flux. The arrow indicates the early winter flux of the GFDL-ESM2G model (annual net flux is −328 TgC⋅y−1). (C) Time series of CO2 flux for the model with the closest matching carbon fluxes in A and B (MIROC-ESM-CHEM) and the aircraft optimized CO2 flux. The modeled peak carbon uptake in summer is too large and a month too early compared with the aircraft optimized CO2 flux. Negative fluxes represent uptake by the biosphere.

References

    1. Koven CD, et al. Permafrost carbon-climate feedbacks accelerate global warming. Proc Natl Acad Sci USA. 2011;108:14769–14774. - PMC - PubMed
    1. Piao S, et al. Net carbon dioxide losses of northern ecosystems in response to autumn warming. Nature. 2008;451:49–52. - PubMed
    1. McGuire AD, et al. An assessment of the carbon balance of Arctic tundra: Comparisons among observations, process models, and atmospheric inversions. Biogeosciences. 2012;9:3185–3204.
    1. Angert A, et al. Drier summers cancel out the CO2 uptake enhancement induced by warmer springs. Proc Natl Acad Sci USA. 2005;102:10823–10827. - PMC - PubMed
    1. Black TA, et al. Increased carbon sequestration by a boreal deciduous forest in years with a warm spring. Geophys Res Lett. 2000;27:1271–1274.

Publication types

LinkOut - more resources