. 2017 May 23;114(21):E4261-E4270.
doi: 10.1073/pnas.1620761114. Epub 2017 May 8.

mTORC1 promotes proliferation of immature Schwann cells and myelin growth of differentiated Schwann cells

Affiliations

mTORC1 promotes proliferation of immature Schwann cells and myelin growth of differentiated Schwann cells

Bogdan Beirowski et al. Proc Natl Acad Sci U S A. .

Abstract

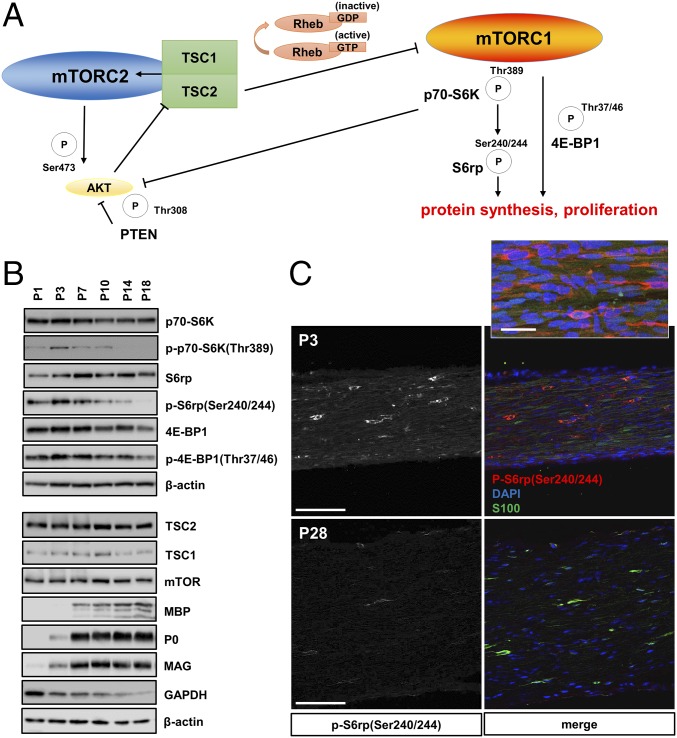
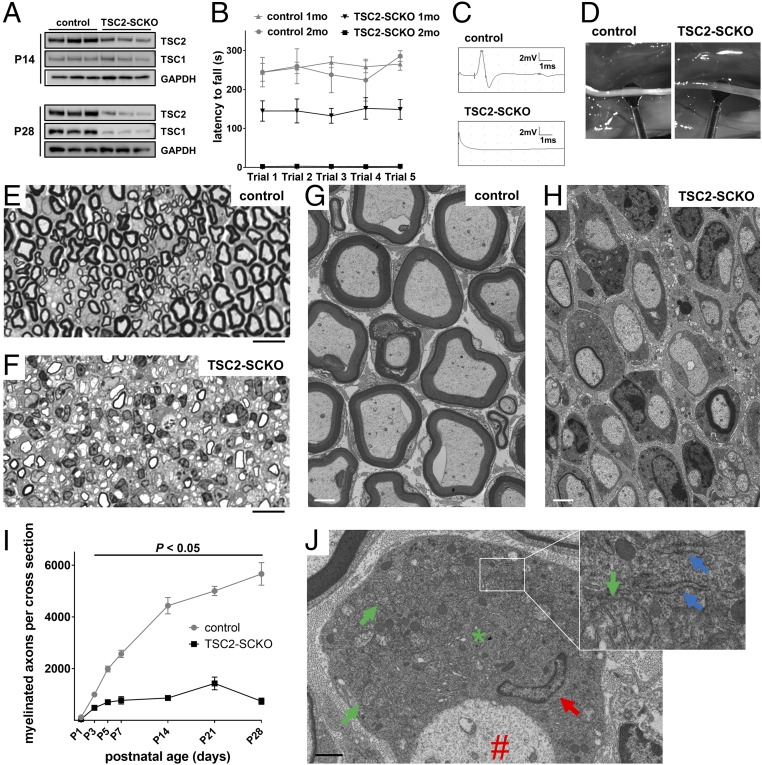
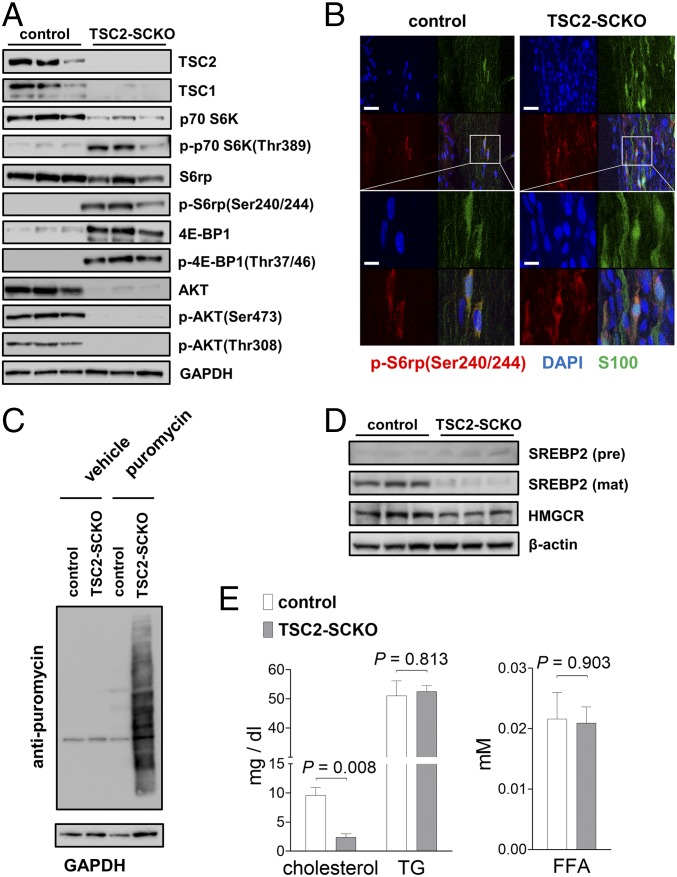
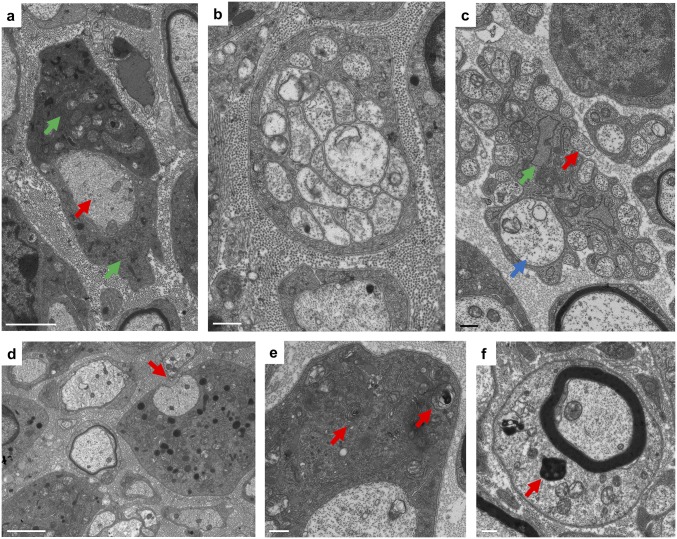
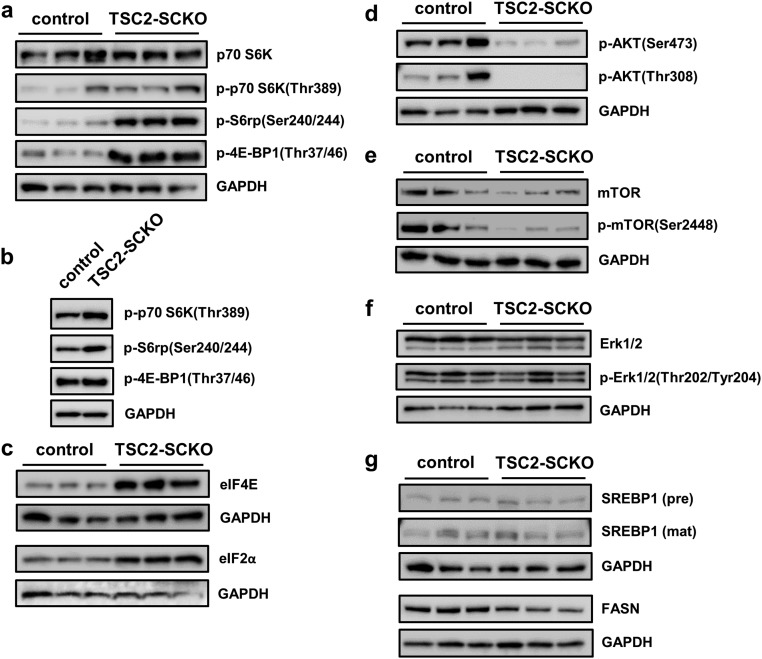
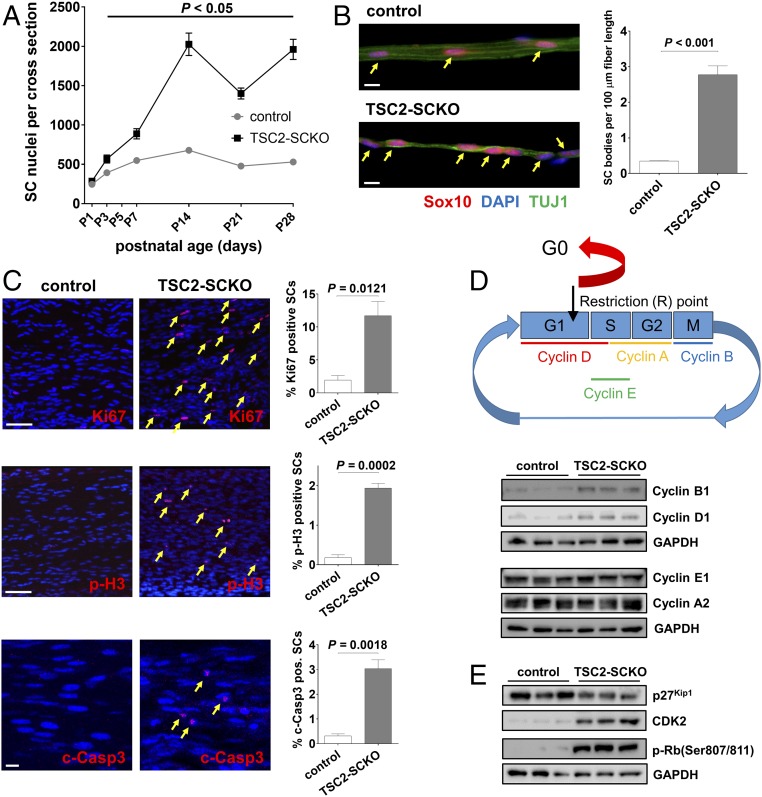
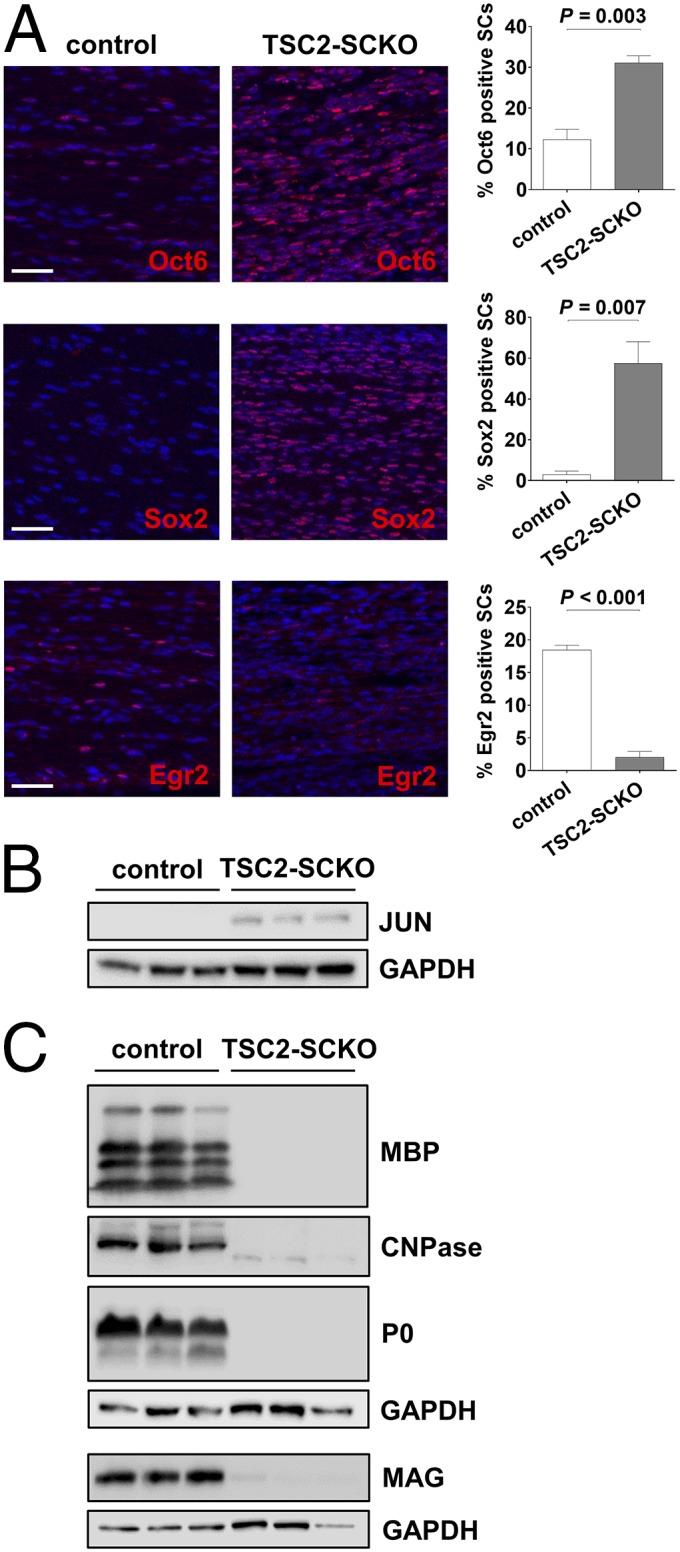
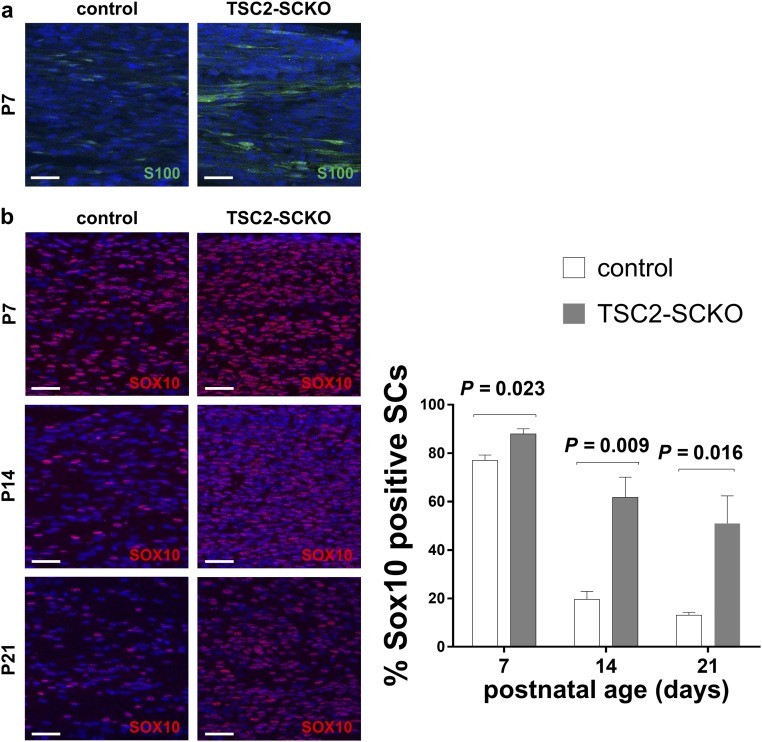
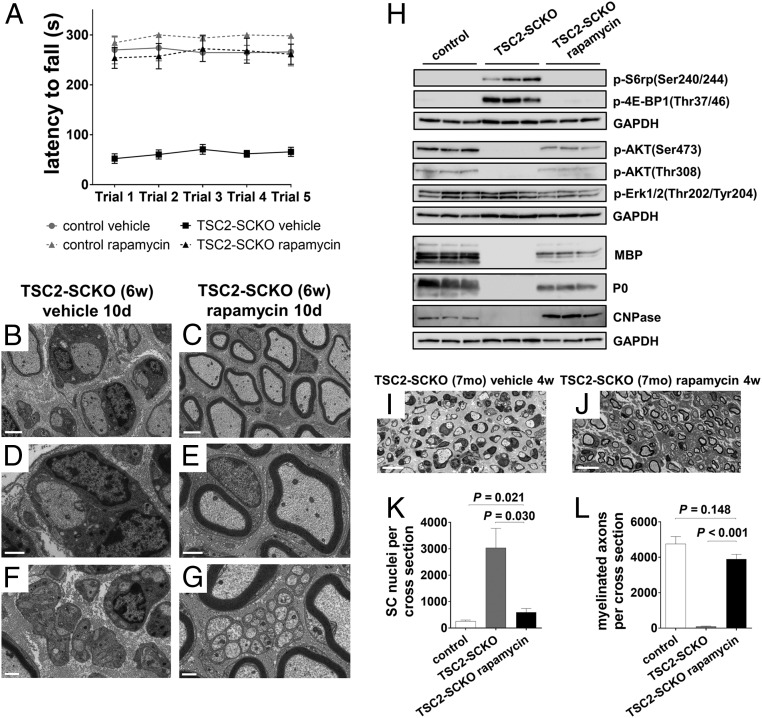
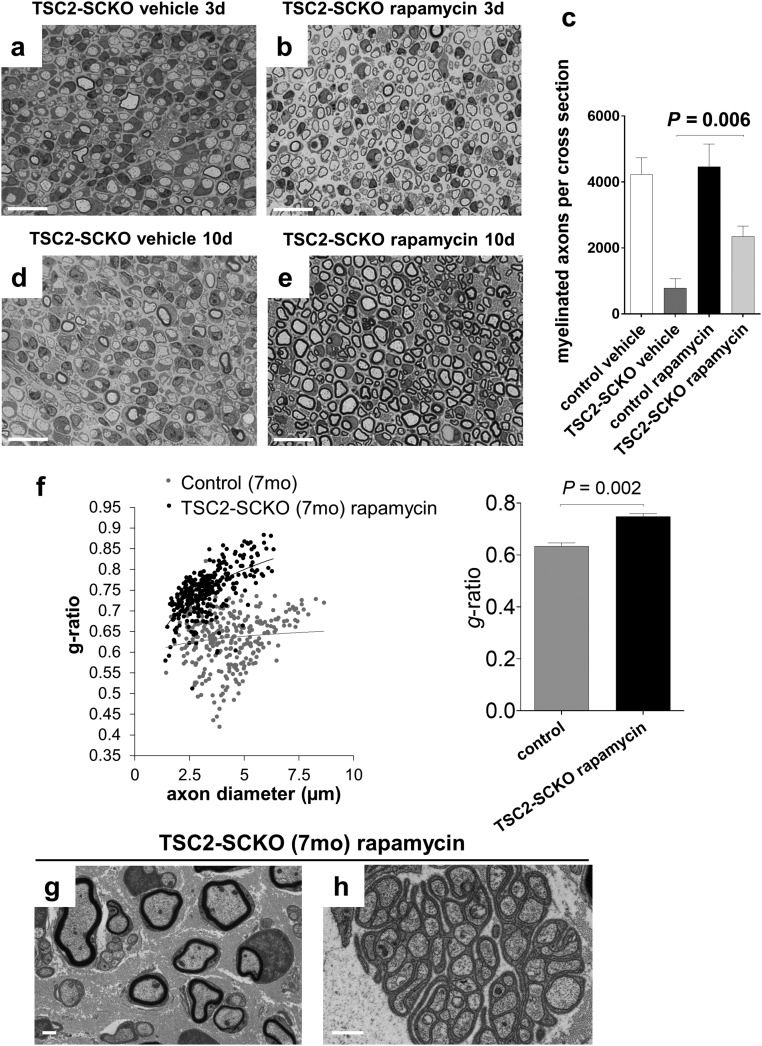
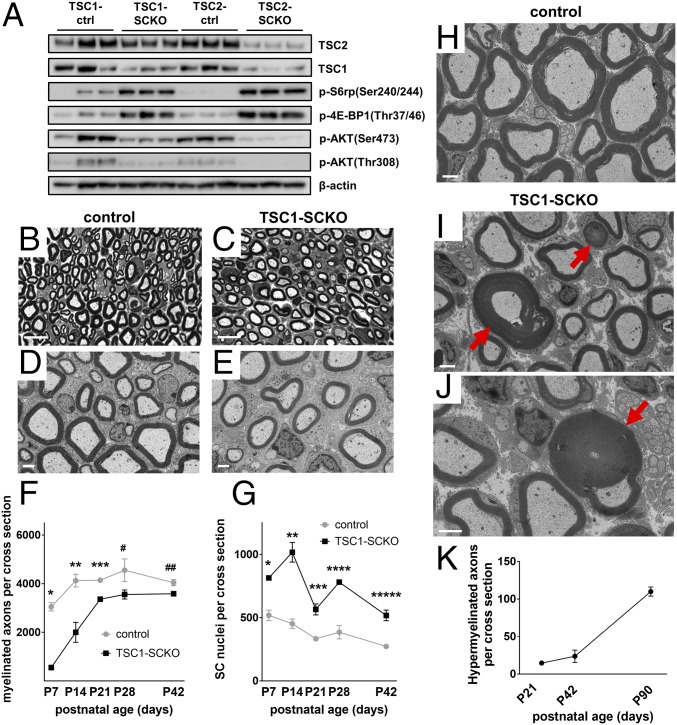
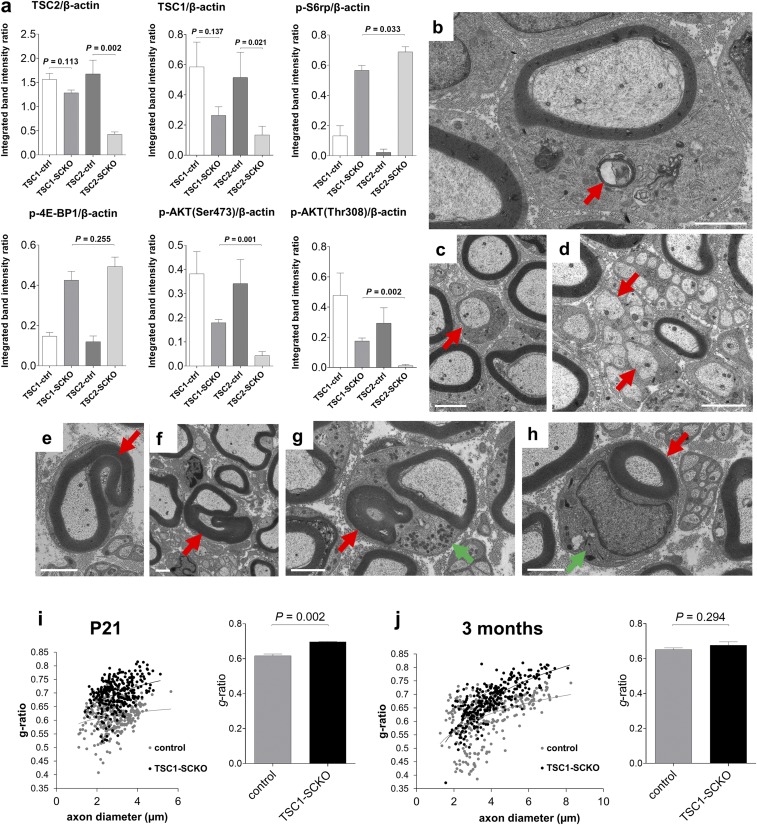
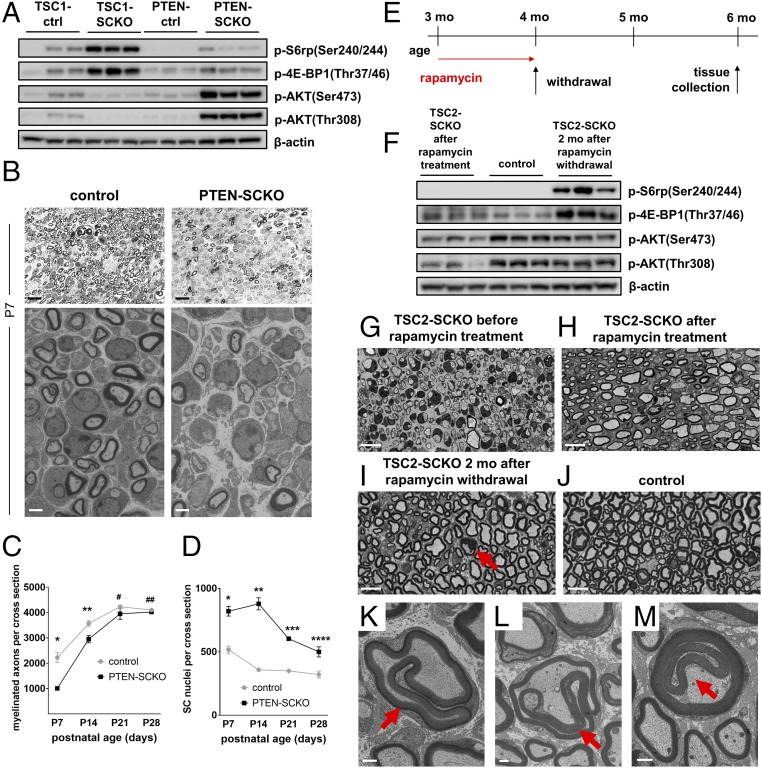
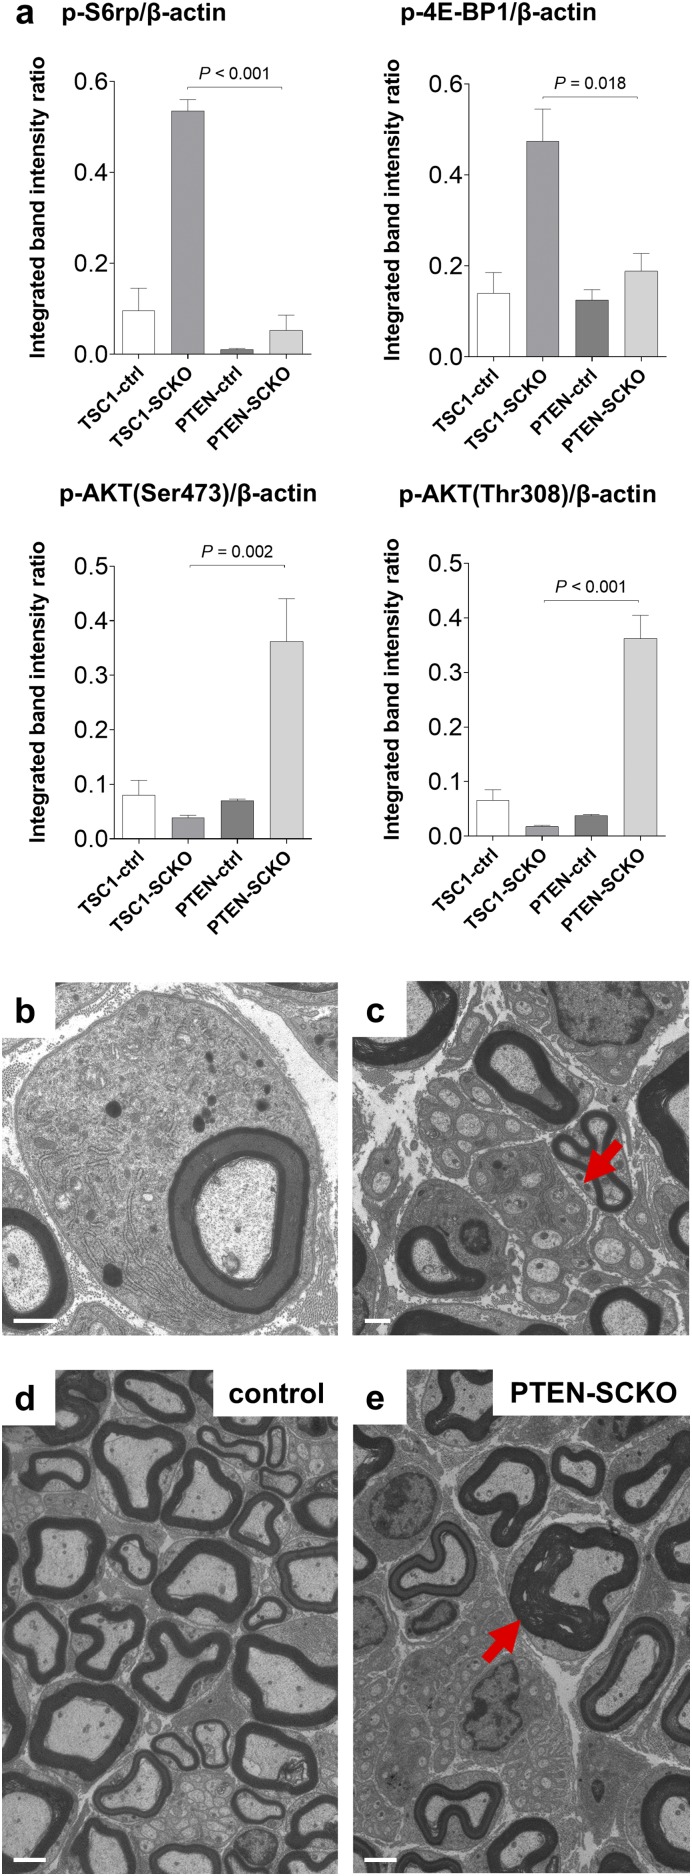
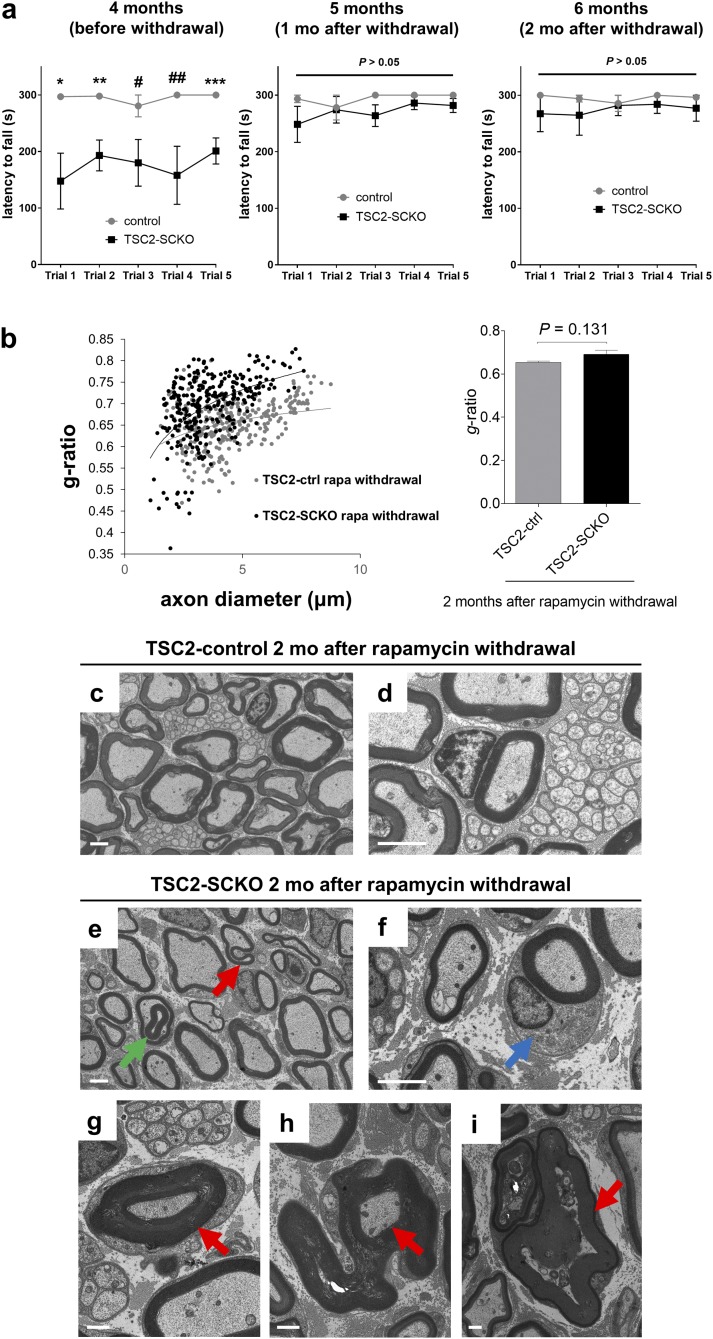
The myelination of axons in peripheral nerves requires precisely coordinated proliferation and differentiation of Schwann cells (SCs). We found that the activity of the mechanistic target of rapamycin complex 1 (mTORC1), a key signaling hub for the regulation of cellular growth and proliferation, is progressively extinguished as SCs differentiate during nerve development. To study the effects of different levels of sustained mTORC1 hyperactivity in the SC lineage, we disrupted negative regulators of mTORC1, including TSC2 or TSC1, in developing SCs of mutant mice. Surprisingly, the phenotypes ranged from arrested myelination in nerve development to focal hypermyelination in adulthood, depending on the level and timing of mTORC1 hyperactivity. For example, mice lacking TSC2 in developing SCs displayed hyperproliferation of undifferentiated SCs incompatible with normal myelination. However, these defects and myelination could be rescued by pharmacological mTORC1 inhibition. The subsequent reconstitution of SC mTORC1 hyperactivity in adult animals resulted in focal hypermyelination. Together our data suggest a model in which high mTORC1 activity promotes proliferation of immature SCs and antagonizes SC differentiation during nerve development. Down-regulation of mTORC1 activity is required for terminal SC differentiation and subsequent initiation of myelination. In distinction to this developmental role, excessive SC mTORC1 activity stimulates myelin growth, even overgrowth, in adulthood. Thus, our work delineates two distinct functions of mTORC1 in the SC lineage essential for proper nerve development and myelination. Moreover, our studies show that SCs retain their plasticity to myelinate and remodel myelin via mTORC1 throughout life.

Keywords: axon; mammalian target of rapamycin; myelination; neuropathy; peripheral nerve.


Conflict of interest statement

The authors declare no conflict of interest.

Figures

Fig. 1.
Fig. 1.
mTORC1 activity decreases in developing SCs. (A) Model for mTORC1 regulation by the TSC1/2 complex via Rheb GTP-loading. The illustration additionally depicts regulation of protein synthesis and cell proliferation by the mTORC1 downstream substrates p70-S6K, S6 ribosomal protein, and the translation inhibitor 4E-BP1. These substrates are phosphorylated (P) at the indicated sites reflecting mTORC1 activation. The activity of AKT is controlled by two phosphorylation sites regulated by mTORC2 and p70-S6K (the latter representing negative feedback inhibition by mTORC1). The activity of mTORC2 is promoted by the TSC1/2 complex. (B) Western blots of sciatic nerve lysates from mice at different postnatal ages, probed with the indicated antibodies, show progressive down-regulation of markers for mTORC1 activity (p70 S6 kinase, ribosomal protein S6, eukaryotic initiation factor 4E-BP1), inversely correlated with the expression of key structural myelin proteins (myelin basic protein: MBP, myelin protein P0, myelin associated glycoprotein: MAG). In contrast, protein levels of TSC2, TSC1, and the mTOR core kinase remain constant during postnatal development, whereas the levels of the glycolysis enzyme GAPDH decrease. (C) Immunofluorescence of longitudinal frozen sciatic nerve sections (confocal z-series projections) from C57BL/6J mice using the indicated markers shows markedly reduced p-S6(Ser240/244) signals in SCs at P28 vs. P3. For better visualization of the staining intensity differences, the left column shows monochrome p-S6(Ser240/244) signals only. Inset in Upper portion depicts p-S6+/S100+ SCs at higher magnification. (Scale bars, 100 µm; Inset, 30 µm.)
Fig. 2.
Fig. 2.
Arrest of myelination in TSC2-SCKO mice. (A) Western blots of sciatic nerve lysates from control and TSC2-SCKO mice (three mice per group), probed with the indicated antibodies, showing decreases in TSC2 and TSC1 from P14 to P28. (B) Accelerated rotarod analysis of 1- and 2-mo-old control and TSC2-SCKO mice. Note significantly reduced rotarod performance of 1-mo-old TSC2-SCKO mice, whereas the mutants were not able to sustain themselves on the rotarod apparatus at 2 mo of age. n = 3–7 mice per genotype at each age. P < 0.05 for each point comparison between control and TSC2-SCKO at one and 2 mo of age. (C) Representative traces of sciatic nerve compound muscle action potentials recorded from a foot muscle after proximal stimulation in 2-mo-old mice showing complete conduction block in TSC2-SCKO mutants. (D) Compared with control sciatic nerves, TSC2-SCKO nerves appear translucent at age P21. (E–H) Light (E and F) and electron microscopy (G and H) of sciatic nerves from control and TSC2-SCKO mice at age P28 reveal dysmyelination in the mutant. (Scale bars, 10 µm in E and F; 2 µm in G and H.) (I) Quantification of myelinated axons in sciatic nerves from control and TSC2-SCKO mice at the indicated postnatal time-points. Note drastic reductions in myelinated fiber numbers in mutant mice. n = 3–6 mice per genotype at each age. (J) Electron microscopy of SC body (*) from TSC2-SCKO mouse at age P28 in association with its amyelinated axon (#). Note large size of mutant SC cytoplasm with accumulations of mitochondria (green arrows depict examples), RER (blue arrows in Inset), and a variety of vesicular particles. Red arrow depicts SC nucleus. (Scale bar, 1 µm.)
Fig. 3.
Fig. 3.
Abnormalities in key signaling pathways in TSC2-SCKO mutants. (A) Western blots of sciatic nerve lysates from 7-mo-old control and TSC2-SCKO mice (three mice per group), probed with the indicated antibodies, showing marked up-regulation of mTORC1 activity markers, and down-regulation of AKT signaling. (B) Representative immunofluorescence of longitudinal frozen sciatic nerve sections (confocal z-series projections) from control and TSC2-SCKO mice (age P28) showing elevated p-S6 (marker of mTORC1 activity) in S100+ SCs in the mutants. (Scale bars, 30 µm; Insets, 10 µm.) (C) Western blotting analysis of the rate of new protein synthesis in sciatic nerves from 6-wk-old control and TSC2-SCKO mice intraperitoneally injected with the aminoacyl-tRNA analog puromycin. Puromycin incorporation was detected with anti-puromycin antibody, and GAPDH was used as loading control. Note the dramatically increased rate of newly generated proteins with puromycin incorporation in the TSC2-SCKO nerve compared with control samples. (D) Western blots of sciatic nerve lysates from P14 control and TSC2-SCKO mice (three mice per group) probed with the indicated antibodies. Note the decreased levels of the cleaved mature form of SREBP2 and downstream cholesterol-synthesis enzyme HMGCR in the mutant. (E) Analysis of sciatic nerve lipid extracts from 7-mo-old control and TSC2-SCKO mice (n = 3 mice per genotype) showing decreased levels of cholesterol in the mutant samples but no significant changes in the relative levels of triglycerides (TG) and free fatty acids (FFA).
Fig. S1.
Fig. S1.
Ultrastructural abnormalities during TSC2-SCKO nerve development. Electron microscopy of transverse sciatic nerve sections from TSC2-SCKO mice at P28 (A, C, and D) and P21 (B, E, and F). (A) Note abnormal association of large-caliber amyelinated axon (red arrow) with inflated SC bodies (green arrows). (B and C) Ultrastructure of abnormal small-caliber axon bundles. Note lack of SC cytoplasm between individual axons (B), incomplete engulfment of axons (C, red arrow), presence of larger caliber axons (C, blue arrow), as well as abnormally dilated SC RER (C, green arrow). (D) Incomplete engulfment of large caliber axon with partially exposed axon area (arrow). (E and F) Presence of spirally enwrapped or electron dense membranous structures reminiscent of myelin fragments (red arrows) in the cytoplasm of mutant SCs. (Scale bars: 500 nm in B, C, E, and F; 2 µm in A and D).
Fig. S2.
Fig. S2.
Signaling abnormalities in TSC2-SCKO mutants. (A and B) Western blots of sciatic nerve lysates from control and TSC2-SCKO mice at P28 (A, three mice per genotype) and P3 (B, pooled samples using four to six mice per genotype) probed with the indicated antibodies demonstrating increased phosphorylation of mTORC1 effectors p70 S6K, S6rp, and 4E-BP1 at P28, but less-accentuated increases of these markers at P3. (C) Western blots of sciatic nerve lysates from control and TSC2-SCKO mice (three mice per group) at age P28 probed with the indicated antibodies showing increased levels of eIF4E and eIF2α in the mutant, consistent with elevated protein synthesis machinery. (D) Western blots of sciatic nerve lysates from control and TSC2-SCKO mice at P28 (three mice per genotype) probed with the indicated antibodies showing decreased phosphorylation of AKT by PDK1 and mTORC2 in the mutant. (E) Western blots of sciatic nerve lysates from 7-mo-old control and TSC2-SCKO mice (three mice per genotype) showing decreased AKT-dependent phosphorylation of the mTOR core kinase in the mutant. (F) Western blots of sciatic nerve lysates from 7-mo-old control and TSC2-SCKO mice (three mice per genotype) showing no substantial differences in Erk1/2 phosphorylation. (G) Western blots of sciatic nerve lysates from control and TSC2-SCKO mice (three mice per group) at age P14 probed with the indicated antibodies showing no differences in the protein levels the precursor and cleaved mature form of SREBP1. Note slight decrease in the levels of the downstream enzyme fatty acid synthase (FASN) in the mutant.
Fig. 4.
Fig. 4.
Proliferative defects in TSC2-SCKO nerves. (A) Quantification of glial nuclei in sciatic nerve semithin cross-sections from control and TSC2-SCKO mice at the indicated postnatal ages reveals progressively increasing numbers of developing SCs in the mutant nerves. n = 3 mice per genotype at each age. (B, Left) Fluorescence microscopy analysis of immunostained teased fiber preparations from tibial nerves of P28 control and TSC2-SCKO mice using the indicated markers. Note increased numbers of SOX10+ SCs (arrows) associated with axon segments in TSC2-SCKO nerves compared with control. (Scale bars, 10 µm.) (Right) Quantification of SOX10+ SCs along TUJ1+ axons (n = 3 mice per genotype). (C) Quantitative immunofluorescence of longitudinal sciatic nerve sections (confocal z-series projections) from control and TSC2-SCKO mice at ages P14 (c-Casp3) and P21 (Ki67, p-H3) to demonstrate increased cell cycling (Top; arrows depict Ki67+ cells) and mitotic events (Middle; arrows depict p-H3+ cells), and induction of SC apoptosis (Bottom; arrows depcit c-Casp3+ cells) in the mutant (n = 3 mice per genotype at each age). (Scale bars, 50 µm.) (D, Upper) Schematic illustrating cyclin expression during cell cycle, and checkpoint control by the restriction (R) point. (Lower) Western blots of sciatic nerve lysates from control and TSC2-SCKO mice at age P7 (three mice per group), probed with the indicated antibodies, demonstrating that TSC2-deficient SCs bear elevated levels of cyclin B1 (marker for M-phase) and D1 (marker for G1/S-phase). (E) Western blots of sciatic nerve lysates from control and TSC2-SCKO mice at age P7 (three mice per group) probed with the indicated antibodies, demonstrating hyperphosphorylation and thus inactivation of Rb in the mutant allowing uncontrolled passage through the G1 restriction (R) point of the cell cycle.
Fig. 5.
Fig. 5.
Defective terminal differentiation of TSC2-deficient SC glia. (A) Quantitative immunofluorescence analysis of longitudinal sciatic nerve sections (confocal z-series projections) from P21 control and TSC2-SCKO mice demonstrating significantly increased numbers of OCT6+ and SOX2+ SCs, and dramatically decreased numbers of EGR2+ SCs in the mutant (n = 3 mice per genotype). (Scale bars, 50 µm.) (B) Western blots of sciatic nerve lysates from control and TSC2-SCKO mice at age P21 (three mice per group) probed with the indicated antibodies demonstrating elevated levels of JUN in the mutant. (C) Western blot analysis of sciatic nerve lysates from 7-mo-old control and TSC2-SCKO mice (three mice per group) probed with the indicated antibodies indicating near absence of structural myelin proteins (MBP, CNPase, P0, MAG) in mutant nerves.
Fig. S3.
Fig. S3.
Abnormal expression of S100 and SOX10 in TSC2-ablated SCs. (A) Confocal immunofluorescence (z-series projections) of longitudinal frozen sciatic nerve sections from control and TSC2-SCKO mice at age P7 demonstrating increased S100 immunoreactivity in the mutant sample. (Scale bars, 25 µm.) (B) Quantitative immunofluorescence analysis of longitudinal frozen sciatic nerve sections (confocal z-series projections) from control and TSC2-SCKO mice at the indicated ages demonstrating significantly increased proportions of SOX10+ SCs in the mutant (n = 3 mice per genotype). (Scale bars, 25 µm.)
Fig. 6.
Fig. 6.
Dysmyelination in TSC2-SCKO mice is reversed by rapamycin treatment. (A) Accelerated rotarod analysis in control and TSC2-SCKO mice after 3 d of rapamycin or vehicle treatment (daily intraperitoneal administration starting at 1 mo of age). Note the significantly improved sensorimotor rotarod performance of rapamycin-treated TSC2-SCKO mice compared with vehicle-treated TSC2-SCKO mutants (P < 0.05 for all trials; n = 3–4 mice per group). Rapamycin treatment had no impact on rotarod performance of control mice. (B–G) Electron microscopy of transverse sections of sciatic nerves from TSC2-SCKO mice treated with vehicle (B, D, and F) or rapamycin (C, E, and G) for 10 d (daily intraperitoneal administration starting at 1 mo of age). Note drastic increase in the number of myelinated fibers in the rapamycin-treated mouse (C, E, and G), reduced SC hypertrophy (E and G), and rescue of Remak bundle structure (G). (Scale bars, 2 µm in B and C; 1 µm in D–G). (H) Western blot analysis of sciatic nerve lysates from 7-mo-old control and untreated or rapamycin-treated TSC2-SCKO mice (4-wk-long daily intraperitoneal rapamycin treatment regimen) probed with the indicated antibodies (lysates from three mice per group shown). Note normalization of p-S6rp and p-4E-BP1 signals in TSC2-SCKO nerves after rapamycin treatment. Note recovery of AKT signaling and reexpression of structural myelin proteins MBP, P0, and CNPase following rapamycin administration. (I and J) Representative semithin light microscopy of sciatic nerve transverse sections from 7-mo-old untreated and rapamycin-treated TSC2-SCKO mice. Note improved myelination in TSC2-SCKO nerve after 4-wk-long daily intraperitoneal rapamycin treatment regime. (Scale bars, 10 µm.) (K and L) Quantification of SC nuclei (K) and myelinated axons (L) in sciatic nerve semithin cross-sections from 7-mo-old control and untreated or rapamycin-treated (4 wk) TSC2-SCKO mice. Note reduction of SC numbers and increase in myelinated axons to near control levels in TSC2-SCKO nerves after rapamycin treatment. n = 3–4 mice per group.
Fig. S4.
Fig. S4.
Effects of rapamycin treatment in TSC2-SCKO mice. (A, B, D, and E) Semithin light microscopy of transverse sections of sciatic nerves from TSC2-SCKO mice that were treated with vehicle or rapamycin for 3 d (A and B) or 10 d (D and E) with treatment starting at 1 mo of age. Note increase in the number of thinly myelinated fibers in the rapamycin-treated mutants. (Scale bars, 30 µm.) (C) Quantification of myelinated axons in sciatic nerve semithin cross-sections from control and TSC2-SCKO mice treated with vehicle or rapamycin for 3 d with treatment starting at 1 mo of age. Note increase in the number of thinly myelinated axons in TSC2-SCKO nerves after short rapamycin treatment. n = 4 mice per group. (F, Left) Scatter plot showing sciatic nerve g-ratios of individual myelinated fibers as a function of axon diameter. Note increased g-ratios especially in large caliber axons in rapamycin-treated mutants compared with control mice. (Right) Cumulative g-ratio analysis of sciatic nerves from 7-mo-old control and rapamycin-treated TSC2-SCKO mice shows overall hypomyelination (increased cumulative g-ratio) in the mutant. n = 3 mice per group. (G and H) Representative electron microscopy of sciatic nerve transverse section from 7-mo-old TSC2-SCKO mouse after 4 wk of daily rapamycin treatment. Note formation of thin myelin sheaths on most large caliber axons (G), and grossly normal Remak bundle structure (H). (Scale bars, 1 µm.)
Fig. 7.
Fig. 7.
Delayed initiation of myelination followed by focal hypermyelination in TSC1-SCKO nerves. (A) Western blot analysis of sciatic nerve lysates from TSC1-SCKO and TSC2-SCKO mutants and respective control mice at age P28 (three mice per genotype) probed with indicated antibodies. Note less-induced mTORC1 and less-repressed AKT signaling in TSC1-SCKO samples. (B–E) Representative light (B and C) and electron microscopy (D and E) of sciatic nerves from control and TSC1-SCKO mice at P28 (B and C) and P21 (D and E) showing minor hypomyelination in the mutant. (Scale bars, 10 µm in B and C; 2 µm in D and E). (F and G) Quantification of myelinated axons (F) and glial nuclei (G) in sciatic nerve semithin cross-sections from control and TSC1-SCKO mice at the indicated ages. Note statistically significant reductions of myelinated axon numbers in TSC1-SCKO nerves at P7-21, but not at P28 and P42 (F: *P < 0.001; **P = 0.035; ***P = 0.004; #P = 0.116; ##P = 0.070). The number of glial nuclei in TSC1-SCKO nerves is significantly increased at each tested age (G: *P = 0.002; **P = 0.003; ***P = 0.006; ****P = 0.002; *****P = 0.005). n = 3 mice per genotype at each age. (HJ) Electron microscopy of sciatic nerve transverse sections from 5-mo-old control (H) and TSC1-SCKO mice (I and J) showing hypermyelination in the form of redundant myelin and tomacula-like structures (red arrows) in the mutant. (Scale bars, 2 µm.) (K) Quantification of axons showing focal hypermyelination features (comma shaped outfoldings, recurrent myelin loops, tomacula) using transverse sciatic nerve sections from TSC1-SCKO mice at the indicated ages. n = 3 mice per age group.
Fig. S5.
Fig. S5.
Further analysis of TSC1-SCKO mice. (A) Densitometric quantification of Western blotting from Fig. 7A. Note less-induced mTORC1 and less repressed AKT signaling in TSC1-SCKO mice compared with TSC2-SCKO mutants. (B–D) Electron microscopy of sciatic nerve transverse sections from TSC1-SCKO mouse at P21 showing inflation of SC bodies with accumulation of diverse organelles and particles including RER, mitochondria, and material resembling compact myelin in the cytoplasm (B, arrow), amyelinated axon (C, arrow), and abnormal Remak bundle with mislocalization of larger axons (D, arrows). (Scale bars, 2 µm.) (E–H) Ultrastructural appearance of redundant myelination in transverse sciatic nerve sections from 5-mo-old TSC1-SCKO mice. Hypermyelination appears as comma-shaped outfoldings of different extent (E and F, arrows), recurrent myelin loops (G, red arrow), and hypermyelination of small diameter axons (H, red arrow). Note inflated SC cytoplasm with accumulation of mitochondria and other subcellular material (G and H, green arrows). (Scale bars, 2 µm.) (I and J) Scatter plots and cumulative g-ratio analysis with the former showing sciatic nerve g-ratios of individual myelinated fibers as a function of axon diameter in control and TSC1-SCKO mice at the indicated ages. Note convergence of g-ratio trend lines in the scatter plots as mice become older. Accordingly, there is overall hypomyelination with significantly increased cumulative g-ratios in the mutant at P21 (I), but no significant difference between control and mutant at 3 mo of age (J). n = 3 mice per genotype and age.
Fig. 8.
Fig. 8.
Delayed initiation of myelination in PTEN-SCKO mice and induction of focal hypermyelination in TSC2-SCKO nerves. (A) Western blot analysis of sciatic nerve lysates from TSC1-SCKO and PTEN-SCKO mutants and the respective control mice at age P28 (three mice per genotype) probed with the indicated antibodies. Note reduced phosphorylation of S6rp and 4E-BP1 in PTEN-SCKO compared with TSC1-SCKO samples. In contrast to TSC1-SCKO nerves, AKT signaling is drastically elevated in PTEN-SCKO nerves as reflected by increased site-specific phosphorylation of AKT. (B) Representative light (Upper) and electron microscopy (Lower) of transverse sciatic nerve sections from control and PTEN-SCKO mice at age P7. Note markedly reduced numbers of myelinated axons in the PTEN-SCKO nerve. [Scale bars: 10 µm (light microscopy) and 2 µm (electron microscopy).] (C and D) Quantification of myelinated axons (C) and glial nuclei (D) in sciatic nerve semithin cross-sections from control and PTEN-SCKO mice at the indicated ages. Note statistically significant reductions of myelinated axon numbers in PTEN-SCKO nerves at P7 and P14, but not at P21 and P28, indicating delayed initiation of myelination (C: *P < 0.001; **P = 0.027; #P = 0.270; ##P = 0.227). The number of glial nuclei in PTEN-SCKO nerves is significantly increased at each investigated age (D: *P = 0.001; **P < 0.001; ***P < 0.001; ****P = 0.021). n = 3–5 mice per genotype at each age. (E) Treatment scheme used to dose 3-mo-old TSC2-SCKO mice with rapamycin. Treatment was initiated at 3 mo and continued for 4 wk. Rapamycin treatment was then discontinued and the mice were killed 8 wk later (at 6 mo of age). (F) Western blot analysis of sciatic nerve lysates from TSC2-SCKO and control mice prepared immediately after rapamycin treatment or 2 mo after rapamycin withdrawal (lysates from three mice per group shown). Note constitutive activation of mTORC1 as assessed by downstream substrate phosphorylation in TSC2-SCKO nerves after withdrawal of rapamycin. (G–J) Semithin light microscopy of transverse sciatic nerve sections from TSC2-SCKO mice before rapamycin treatment (G; at 3 mo of age), directly after rapamycin treatment (H; at 4 mo of age), and 2 mo after rapamycin withdrawal (I; at 6 mo of age). (J) Control nerve 2 mo after rapamycin withdrawal. Note dramatically improved myelination status and nerve integrity in TSC2-SCKO nerve following rapamycin withdrawal, and parallel occurrence of focal hypermyelination (example depicted by arrow). (Scale bars, 10 µm.) (K–M) Ultrastructural appearance of focal hypermyelination in transverse sciatic nerve sections from 6-mo-old TSC2-SCKO mice, 2 mo after rapamycin withdrawal. The depicted examples of focal hypermyelination include myelin outfoldings of different extend (K and L, arrows) and recurrent myelin loops (M, arrow). (Scale bars, 1 µm.)
Fig. S6.
Fig. S6.
Further analysis of PTEN-SCKO mice. (A) Densitometric quantification of Western blotting from Fig. 8A. Note less-induced mTORC1 and strongly stimulated AKT signaling in PTEN-SCKO mice compared with TSC1-SCKO mutants. (B and C) Representative electron microscopy of sciatic nerve transverse sections from PTEN-SCKO mouse at age P28 showing inflation of SC bodies with accumulation of RER, mitochondria, and electron dense vesicles (B), and abnormal Remak bundles with hypertrophic SC cytoplasm (C, arrow). (Scale bars, 1 µm.) (D and E) Representative electron microscopy of transverse sciatic nerve sections from control and PTEN-SCKO mice at age P28. Note occurrence of focally hypermyelinated axon (arrow) among grossly normal appearing myelinated fibers. (Scale bars, 2 µm.)
Fig. S7.
Fig. S7.
Further analysis of TSC2-SCKO mice following withdrawal of rapamycin treatment. (A) Accelerated rotarod analysis of control and TSC2-SCKO mice before and after rapamycin withdrawal at the indicated ages. Note significantly improved sensorimotor rotarod performance, indistinguishable from control mice, already 1 mo following rapamycin withdrawal (*P = 0.039; **P = 0.018; ***P = 0.013; #P = 0.092; ##P = 0.051). n = 3 mice per group. (B, Left) Scatter plot showing sciatic nerve g-ratios of individual myelinated fibers as a function of axon diameter. (Right) Corresponding cumulative g-ratio analysis of sciatic nerves from 6-mo-old control and TSC2-SCKO mice 2 mo after rapamycin withdrawal shows no significant difference between control and mutant preparations. n = 3 mice per genotype. (C–F) Representative electron microscopy of transverse sciatic nerve sections from 6-mo-old control and TSC2-SCKO mice, 2 mo following withdrawal of rapamycin treatment. Focal hypermyelination in form of comma-shaped outfoldings (E, red arrow) and recurrent myelin loops (E, green arrow) is depicted in the mutant. Myelinated axons show hypertrophy of the SC body (F, blue arrow) compared with the control preparation. (Scale bars, 2 µm.) (G–I) Focal hypermyelination in transverse sciatic nerve sections from 6-mo-old TSC2-SCKO mice, 2 mo after withdrawal of rapamycin treatment. (G) Depiction of hypermyelination of small caliber axon. Note compression of axonal profiles (G and H, arrows), which can lead to Wallerian-like axon degeneration (I, arrow). (Scale bars, 1 µm.)

Comment in

Similar articles

Cited by

References

    1. Jessen KR, Mirsky R. The origin and development of glial cells in peripheral nerves. Nat Rev Neurosci. 2005;6:671–682. - PubMed
    1. Scherer SS, Wrabetz L. Molecular mechanisms of inherited demyelinating neuropathies. Glia. 2008;56:1578–1589. - PMC - PubMed
    1. Zenker J, Ziegler D, Chrast R. Novel pathogenic pathways in diabetic neuropathy. Trends Neurosci. 2013;36:439–449. - PubMed
    1. Sherman DL, et al. Arrest of myelination and reduced axon growth when Schwann cells lack mTOR. J Neurosci. 2012;32:1817–1825. - PMC - PubMed
    1. Norrmén C, et al. mTORC1 controls PNS myelination along the mTORC1-RXRγ-SREBP-lipid biosynthesis axis in Schwann cells. Cell Reports. 2014;9:646–660. - PubMed

Publication types

MeSH terms

Substances

LinkOut - more resources