. 2017 May 23;114(21):E4184-E4192.
doi: 10.1073/pnas.1702086114. Epub 2017 May 8.

Ectopic protein interactions within BRD4-chromatin complexes drive oncogenic megadomain formation in NUT midline carcinoma

Affiliations

Ectopic protein interactions within BRD4-chromatin complexes drive oncogenic megadomain formation in NUT midline carcinoma

Artyom A Alekseyenko et al. Proc Natl Acad Sci U S A. .

Abstract

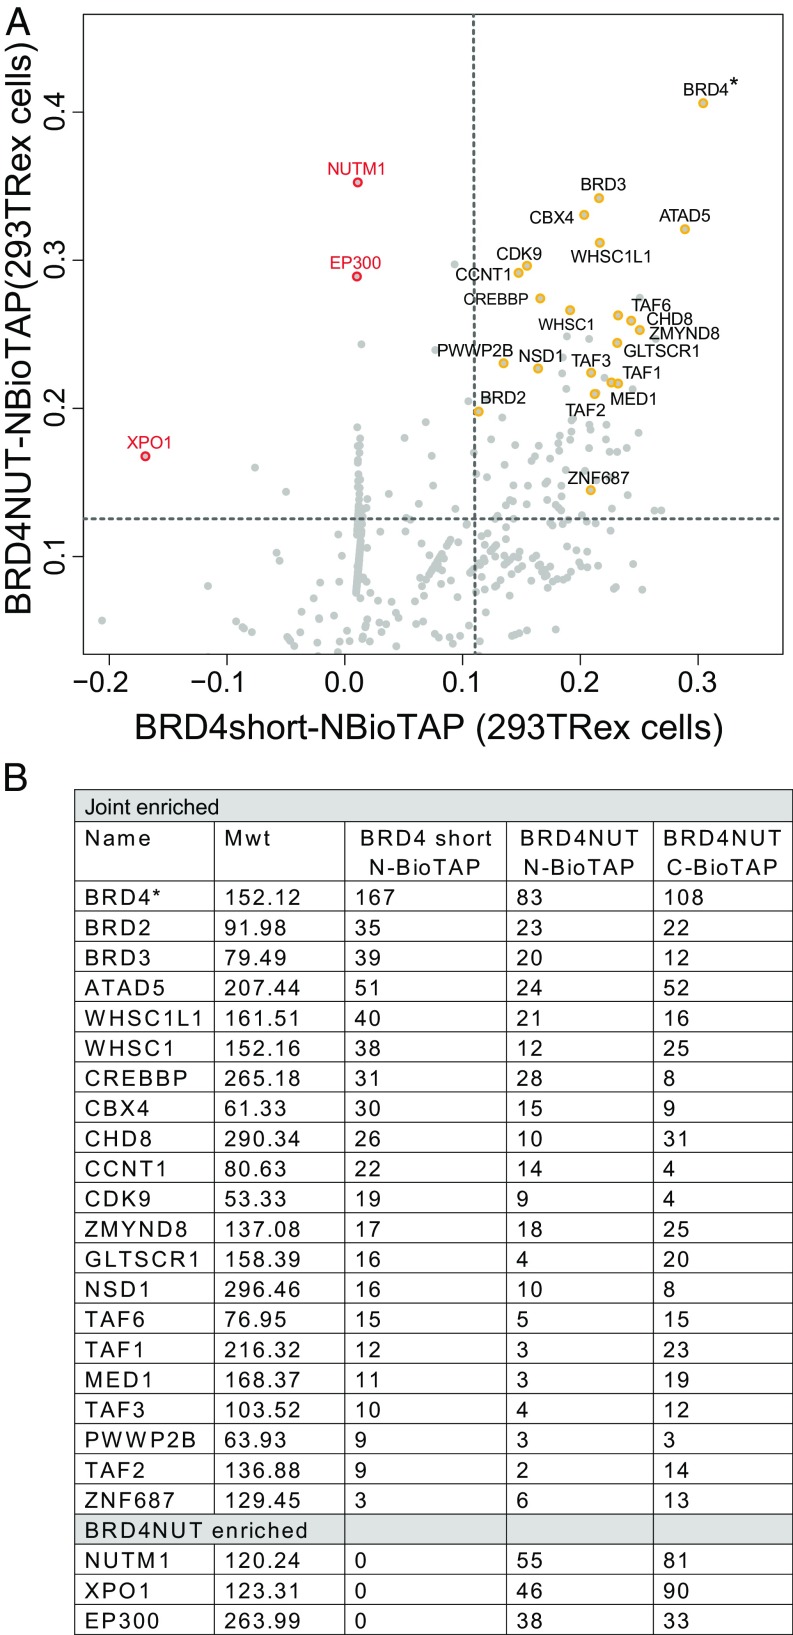
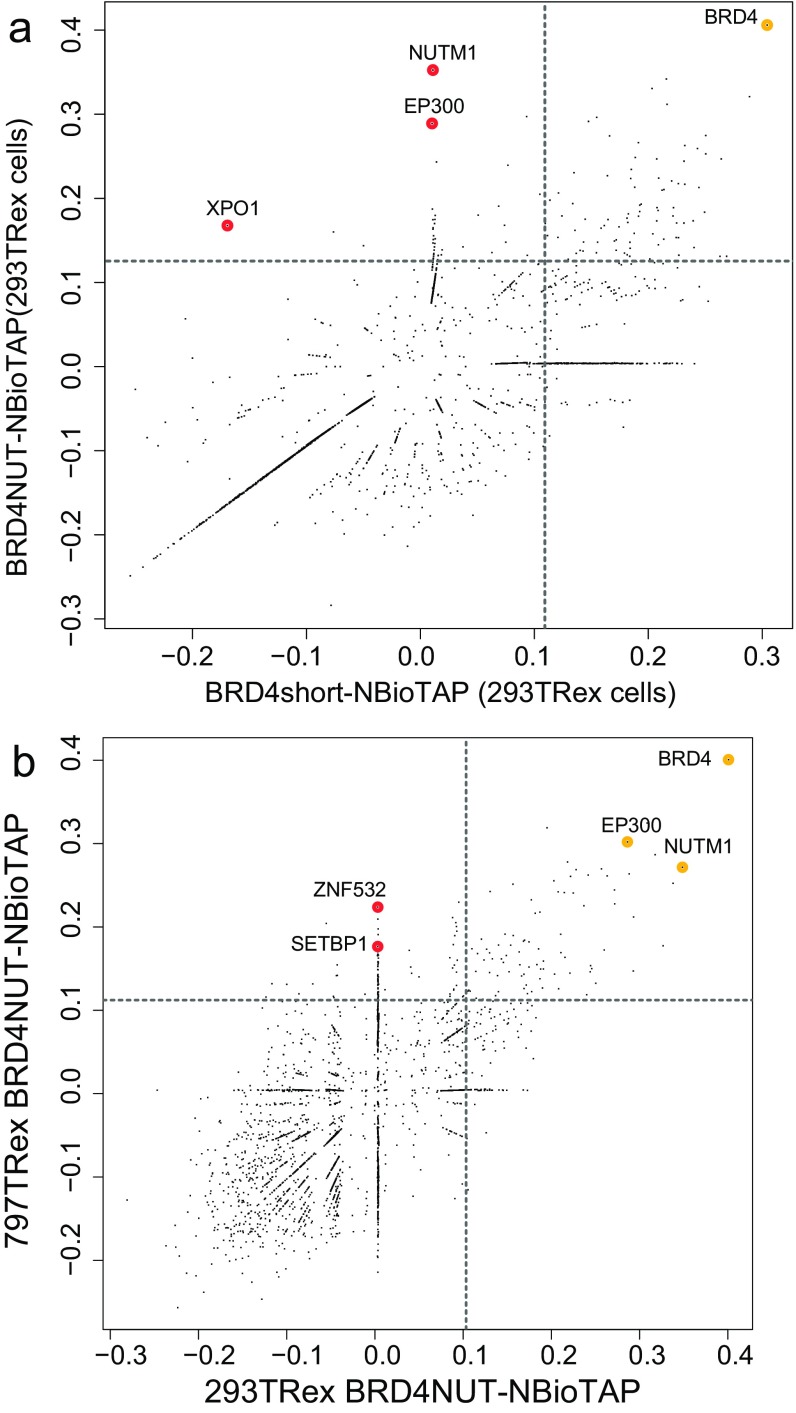
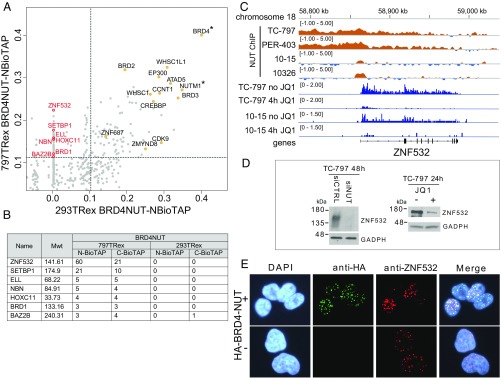
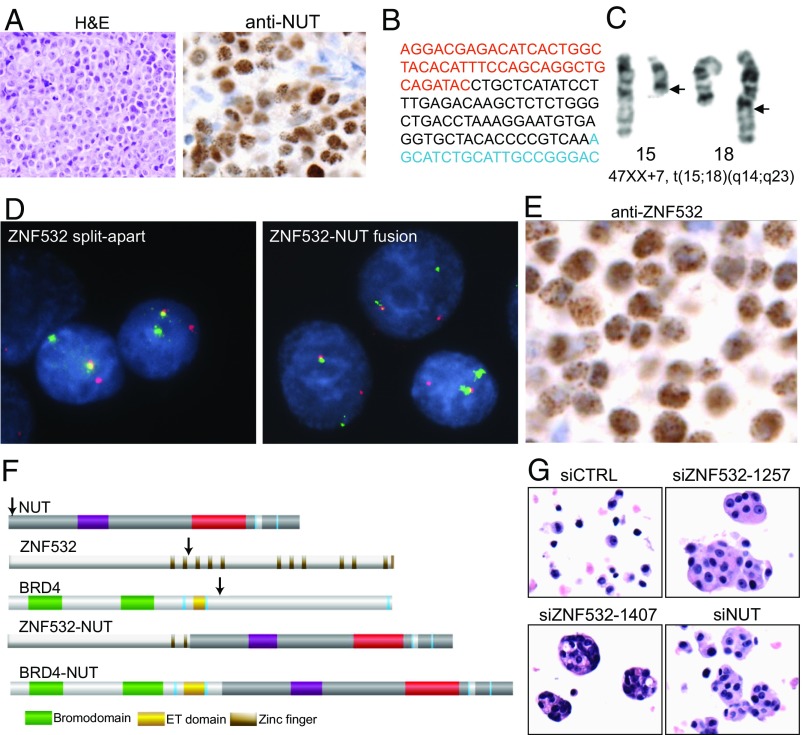
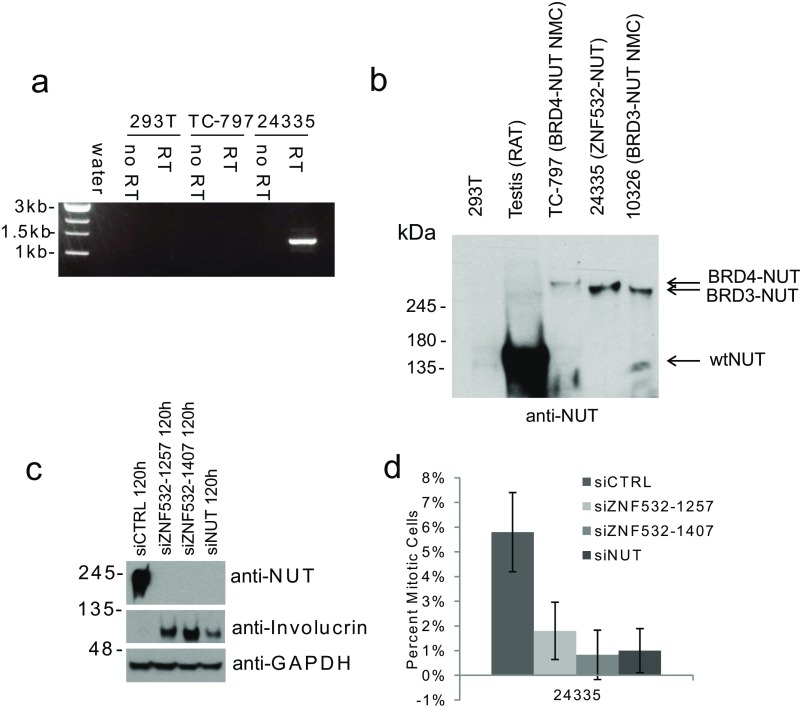
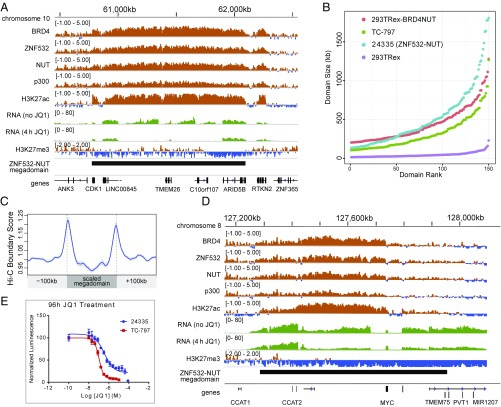
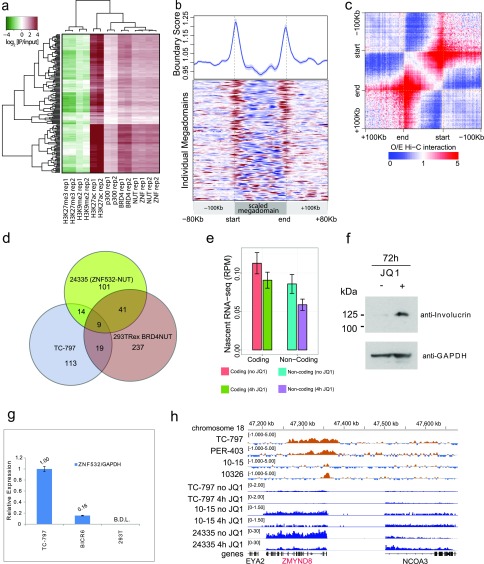
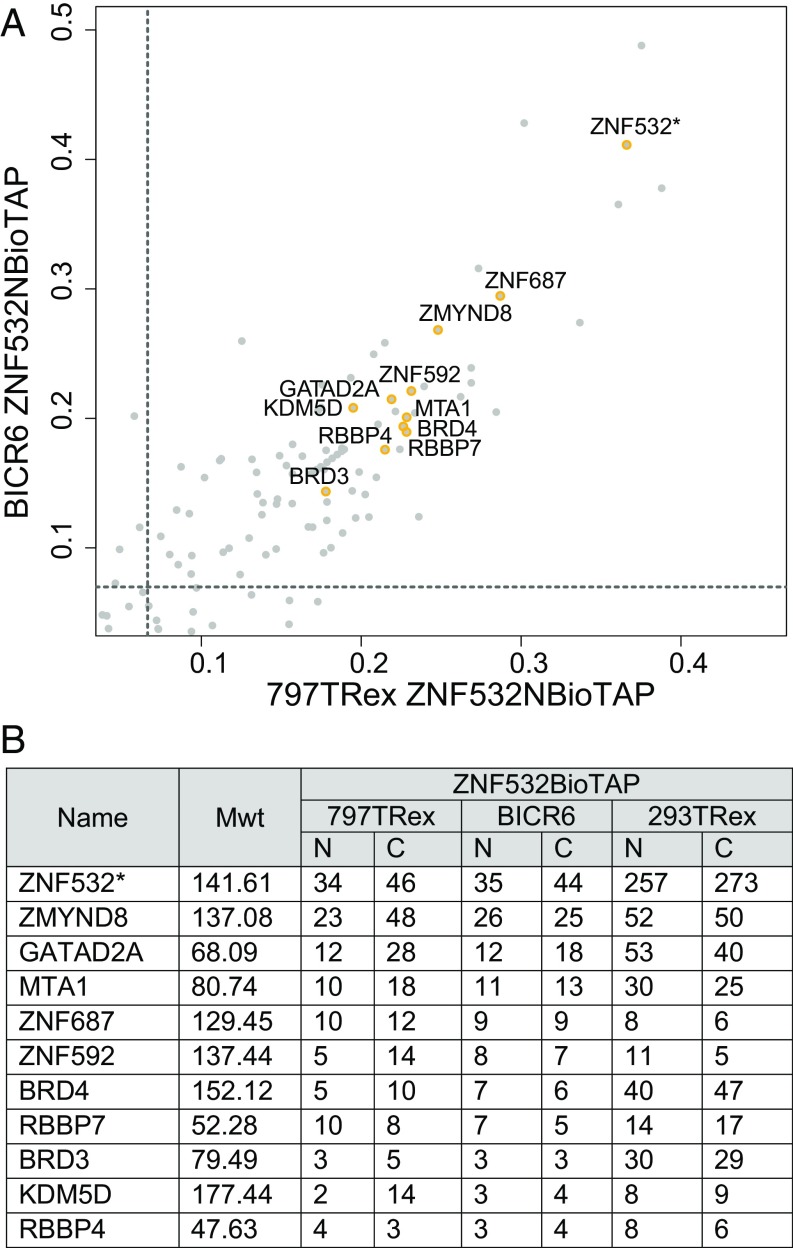
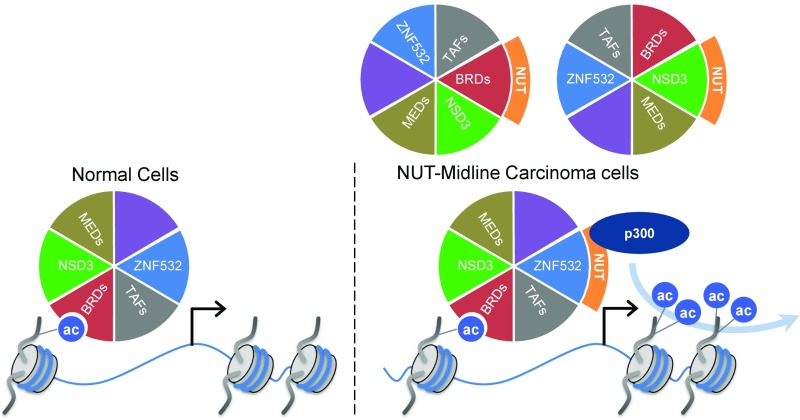
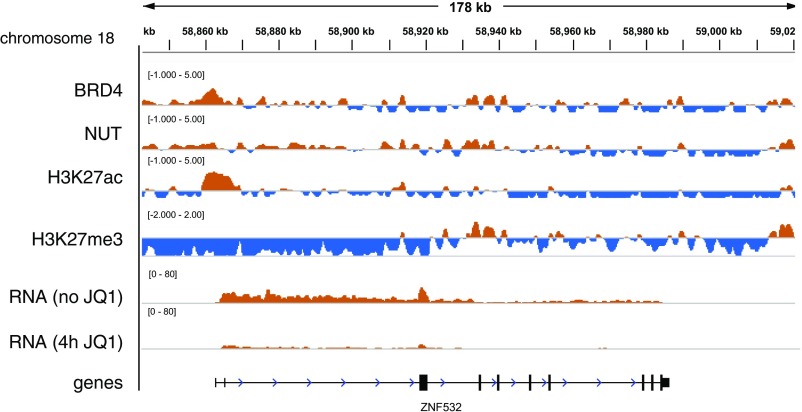
To investigate the mechanism that drives dramatic mistargeting of active chromatin in NUT midline carcinoma (NMC), we have identified protein interactions unique to the BRD4-NUT fusion oncoprotein compared with wild-type BRD4. Using cross-linking, affinity purification, and mass spectrometry, we identified the EP300 acetyltransferase as uniquely associated with BRD4 through the NUT fusion in both NMC and non-NMC cell types. We also discovered ZNF532 associated with BRD4-NUT in NMC patient cells but not detectable in 293T cells. EP300 and ZNF532 are both implicated in feed-forward regulatory loops leading to propagation of the oncogenic chromatin complex in BRD4-NUT patient cells. Adding key functional significance to our biochemical findings, we independently discovered a ZNF532-NUT translocation fusion in a newly diagnosed NMC patient. ChIP sequencing of the major players NUT, ZNF532, BRD4, EP300, and H3K27ac revealed the formation of ZNF532-NUT-associated hyperacetylated megadomains, distinctly localized but otherwise analogous to those found in BRD4-NUT patient cells. Our results support a model in which NMC is dependent on ectopic NUT-mediated interactions between EP300 and components of BRD4 regulatory complexes, leading to a cascade of misregulation.

Keywords: BRD4; BioTAP-XL; ZNF532–NUT; hyperacetylation; topological domains.


Conflict of interest statement

Conflict of interest statement: T.A.I. has a pending patent application relating to the OCMI-E medium.

Figures

Fig. 1.
Fig. 1.
BRD4 vs. BRD4–NUT protein interactions. (A) Scatterplot comparing BioTAP–BRD4short and BioTAP–BRD4–NUT pull-down enrichments in 293TRex cells. Each point represents an individual protein with coordinates (x, y) corresponding to its enrichment in each respective pulldown relative to input. Dashed lines represent the 85th percentile of BioTAP–BRD4short enrichment (vertical line) and 95th percentile of BioTAP–BRD4–NUT enrichment (horizontal line). See Dataset S1 for full results. (B, Top) Joint enriched: The top proteins and the number of peptides recovered in both the BRD4 and BRD4–NUT pulldowns, based on reproducibility and the total peptide enrichment over input. Note that both N- and C-terminally tagged BRD4–NUT were analyzed. (Bottom) BRD4–NUT enriched: The top three proteins and the number of peptides recovered uniquely in BRD4–NUT vs. BRD4 pulldowns. Asterisks denote bait used for pulldown. Mwt, molecular weight of protein in kilodaltons.
Fig. S1.
Fig. S1.
Full view of BRD4–NUT protein interactions. (A) Scatterplot comparing log enrichment of proteins identified in the NBioTAP–BRD4 pulldown and in the NBioTAP–BRD4–NUT pulldown from 293TRex cells. The same data as shown in Fig. 1A, but with an expanded view of the entire protein set. (B) Scatterplot comparing log enrichment of proteins identified in the NBioTAP–BRD4–NUT pulldown from 293TRex cells and in the NBioTAP–BRD4–NUT pulldown from 797TRex cells. The same data as shown in Fig. 2A, but with an expanded view of the entire protein set.
Fig. 2.
Fig. 2.
BRD4–NUT interactions in 293TRex cells vs. 797TRex NMC patient cells. (A) Scatterplot of affinity pull-down enrichments comparing BioTAP–BRD4–NUT from 293TRex and 797TRex cells. Thresholds for enrichment in both pulldowns are at the 95th percentile. Commonly enriched hits are depicted as yellow dots in the upper right quadrant, whereas hits enriched in 797TRex patient cells are depicted as red dots in the upper left quadrant. Asterisks denote bait used for pulldown. (B) Top hits unique to 797TRex patient cells that were enriched in both N- and C-terminally tagged BRD4–NUT pulldowns. Mwt, molecular weight of protein in kilodaltons. (C) BRD4–NUT (NUT ChIP) binds the 5′ promoter region of the ZNF532 gene in different NMC patient-derived cells. ZNF532 transcription is strongly reduced after 4 h of 0.5 μM JQ1 treatment as measured by nascent RNA-seq (3). (D) Immunoblot of siRNA (48 h) (Left) or JQ1-treated (24 h) (Right) TC-797 lysates with ZNF532 antibody. GAPDH was used as a loading control for protein normalization. (E) Immunofluorescence of 797TRex NMC cells induced to express HA-tagged BRD4–NUT. Antibodies used were anti-HA and anti-ZNF532. (Magnification: 400×.)
Fig. 3.
Fig. 3.
Discovery and characterization of a human NMC harboring a ZNF532–NUT fusion oncogene. (A) H&E stain (Left) and diagnostic anti-NUT immunohistochemical stain (Right) of a resected NMC of the lung of a 64-y-old woman. (Magnification: 340×, Left; 700× Right.) (B) cDNA sequence of the patient’s tumor cell line, 24335, reveals the fusion of ZNF532 (red) to NUT intron 1 (black) and NUT exon 2 (blue). (C) Partial karyotype taken from 24335 was 47, XX, +7 t(15;18)(q14;q23). Arrows denote breakpoints. (Magnification: 4,700×.) (D) Dual-color FISH split-apart assay of ZNF532 (red, centromeric 5′; green, telomeric 3′) and fusion assay of ZNF532 (red) to NUT (green). (Magnification: 3,230×.) (E) Immunohistochemical stain of the patient’s primary tumor using anti-ZNF532 antibodies. (Magnification: 1,380×.) (F) Schematic of NUT fusions with ZNF532 and BRD4 (arrows denote fusion breakpoints). (G) H&E staining of 24335 cells 120 h following duplicate sequential siRNA transfection at 0 and 48 h. (Magnification: 400×.)
Fig. S2.
Fig. S2.
Characterization of an NMC patient cell line, 24335, harboring a ZNF532–NUT fusion oncogene. (A) RT-PCR using ZNF532 forward and NUT reverse primers. 293T and TC-797 serve as negative control cell lines. RT, reverse transcription. (B) Immunoblot of wild-type NUT (rat testis) and NMCs with different fusions. (C) Immunoblot of 24335 lysates harvested after 120 h from the start of sequential siRNA transfections at 0 and 48 h. Involucrin is a marker of squamous differentiation. GAPDH is the loading control. (D) Quantification of mitotic cells, treated as in C, by anti–phospho-histone H3 (Ser10) immunohistochemistry (rabbit polyclonal; Cell Signaling Technology). Three hundred cells were counted per transfection in technical triplicates. Error bars represent the standard deviation of each technical triplicate.
Fig. 4.
Fig. 4.
ZNF532–NUT forms megadomains and is JQ1-sensitive. (A) An example of a ZNF532–NUT domain in proximity to the CDK1 locus in the 24335 cell line. The domain shows strong enrichment for ZNF532, BRD4, NUT, EP300, and H3K27ac. H3K27me3 depletion is shown for contrast. Nascent RNA read density with and without the JQ1 treatment is in green. (B) ZNF532–NUT domain size in 24335 cells, compared with BRD4–NUT megadomains in TC-797 and 293TRex cells. The dot plots show the top 150 enhancer-state domains (as defined by continuous regions of H3K27ac enrichment; Materials and Methods) in the different cell lines. 293TRex is representative of a normal cell state, lacking a NUT-fusion protein. 293TRex BRD4–NUT shows the extent of megadomains formed after 7 h of BRD4–NUT induction. (C) Hi-C boundary score (Materials and Methods) shows pronounced peaks at the megadomain boundaries, indicating that they tend to coincide with topologically associating domain boundaries (see also Fig. S3 B and C). Hi-C data from the GM12878 cell line were used. (D) MYC locus megadomain in 24335 ZNF532–NUT cells. The RNA tracks illustrate the difference in nascent transcription following a 4-h JQ1 treatment. (E) Dose–response curve of 24335 and TC-797 cells to JQ1 scored by CellTiter-Glo (Promega Biosciences) 96 h following treatment with JQ1 was performed in biologic triplicates. The results are representative of one experiment; error bars are the standard deviation of quadruplet technical replicates for each concentration of JQ1. IC50, half-maximal inhibitory concentration, was 357 nM for 24335 cells and 104 nM for TC-797 cells.
Fig. S3.
Fig. S3.
ZNF532–NUT megadomains are depleted for H3K27me3 and delimited by TADs. (A) Average ChIP enrichment within ZNF532–NUT megadomains in 24335 cells. In addition to prominent enrichment for BRD4, NUT, H3K27ac, and EP300, the ZNF532–NUT megadomains show marked depletion of histone marks H3K27me3 and H3K9me2 that are associated with epigenetic silencing. (B) An extended version of Fig. 4C; the Hi-C boundary score profiles for the individual domains are shown as a heatmap under the average plot, with red colors marking high boundary scores and blue colors marking low scores. Hi-C data from GM12878 were used. (C) A combined observed/expected (O/E) Hi-C interaction frequency plot for the ZNF532–NUT megadomains. Rescaled megadomains and 100-kb flanking regions are shown. (D) The number of overlapping megadomains is shown for the ZNF532–NUT domains in 24335 cells and BRD4–NUT domains in TC-797 cells and 293TRex cells after 7 h of BRD4–NUT induction. (E) The average levels of nascent transcription (y axis, RPM) drop in 24335 cells following JQ1 treatment. Different bars show genic and intergenic nascent transcription rates before and after a 4-h JQ1 treatment. The error bars show the 95% error of the mean. RPM, reads per million. (F) Immunoblot of 24335 cells treated with 500 nM JQ1 BET inhibitor. (G) Quantitative RT-PCR of ZNF532 RNA in TC-797 NMC cells and BICR6, a non-NMC head and neck squamous cancer cell line. ZNF532 RNA was below detection limits (B.D.L.) in 293T cells. Error bars represent standard deviation. (H) BRD4–NUT (NUT ChIP) binds the 5′ promoter region of the ZMYND8 gene in different NMC patient-derived cells, along with levels of nascent transcription (blue tracks) with and without JQ1 treatment. In all tested cell lines, the rate of ZMYND8 transcription was decreased following JQ1 treatment.
Fig. 5.
Fig. 5.
BioTAP–ZNF532 pulldowns enrich for BET bromodomain proteins and additional conserved interactions. (A) Scatterplot of affinity pull-down enrichments, comparing BioTAP–ZNF532 in 797TRex NMC patient cells and in BICR6 non-NMC cells. Thresholds for enrichment from both pulldowns were set at the 95th percentile. (B) A list of the common hits, showing results from both N- and C-terminally tagged ZNF532 pulldowns in 797TRex, BICR6, and 293TRex cells. Asterisks denote bait used for pulldown. Mwt, molecular weight of protein in kilodaltons.
Fig. 6.
Fig. 6.
Model for how NUT-fusion proteins drive oncogenic megadomain formation. BRD complexes function at gene-specific locations to facilitate transcription in normal cells. In contrast, NMC patients harbor NUT translocations to BRD4, BRD3, NSD3, or ZNF532 that form large megadomains, often filling whole TADs. This is postulated to occur through NUT recruitment of EP300 to the aberrant BRD regulatory complexes, leading to iterative histone acetylation and NUT-fusion protein recruitment to newly acetylated chromatin. NUT fusions to a variety of BRD-complex members result in an analogous mechanism for megadomain formation. MEDs, mediator complex subunits; TAFs, TATA box-binding protein-associated factors.
Fig. S4.
Fig. S4.
Transcription of the ZNF532 locus is JQ1-sensitive in 24335 cells. Moderate enrichment for BRD4, NUT, and H3K27ac together with exclusion of the silencing mark H3K27me3 at the 5′ promoter region correlate with a transcriptionally active state of the ZNF532 gene in 24335 cells. Transcription is strongly reduced after 4 h of 10 μM JQ1 treatment as measured by nascent RNA-seq.

References

    1. Wang R, et al. Activation of SOX2 expression by BRD4-NUT oncogenic fusion drives neoplastic transformation in NUT midline carcinoma. Cancer Res. 2014;74:3332–3343. - PMC - PubMed
    1. Grayson AR, et al. MYC, a downstream target of BRD-NUT, is necessary and sufficient for the blockade of differentiation in NUT midline carcinoma. Oncogene. 2014;33:1736–1742. - PMC - PubMed
    1. Alekseyenko AA, et al. The oncogenic BRD4-NUT chromatin regulator drives aberrant transcription within large topological domains. Genes Dev. 2015;29:1507–1523. - PMC - PubMed
    1. French CA. Pathogenesis of NUT midline carcinoma. Annu Rev Pathol. 2012;7:247–265. - PubMed
    1. French C. NUT midline carcinoma. Nat Rev Cancer. 2014;14:149–150. - PubMed

Publication types

MeSH terms