. 2017 Jun 5;214(6):1769-1785.
doi: 10.1084/jem.20161674. Epub 2017 May 8.

Intrinsic antiproliferative activity of the innate sensor STING in T lymphocytes

Affiliations

Intrinsic antiproliferative activity of the innate sensor STING in T lymphocytes

Silvia Cerboni et al. J Exp Med. .

Abstract

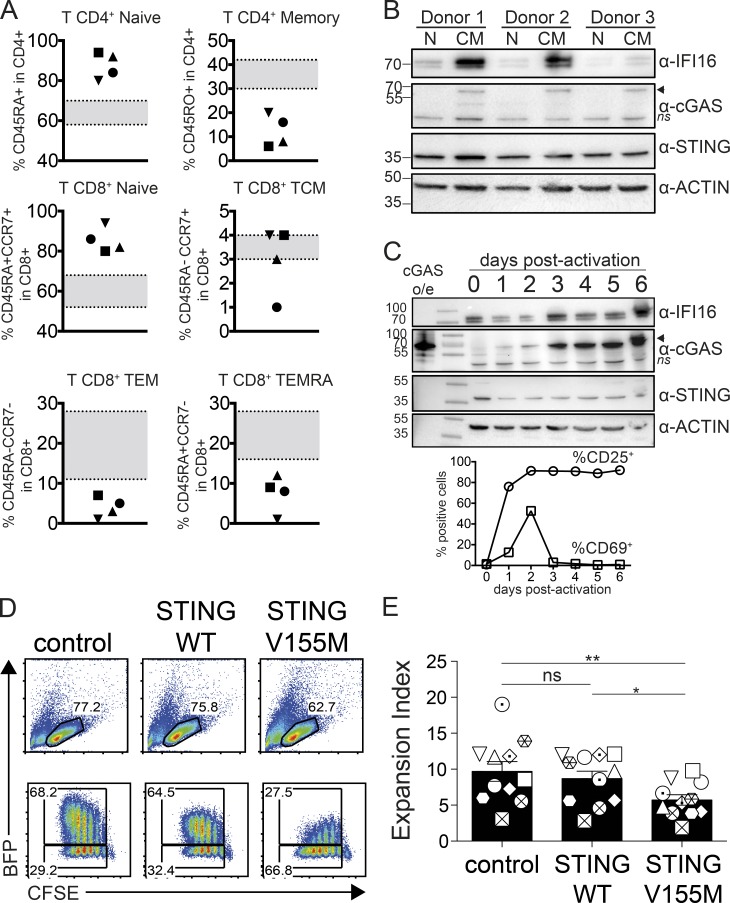
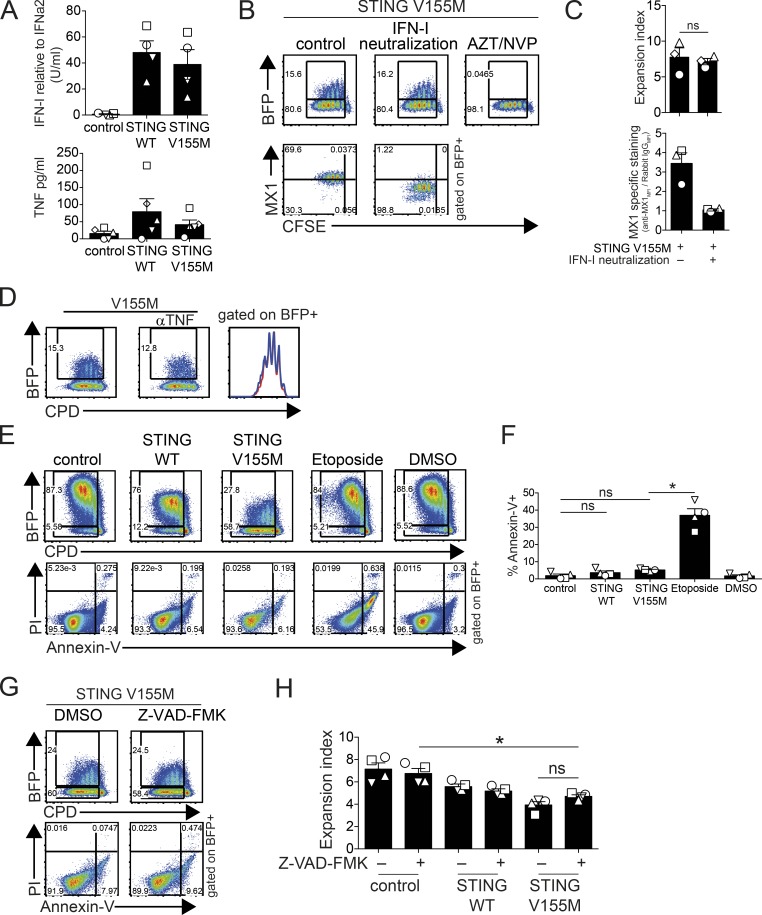
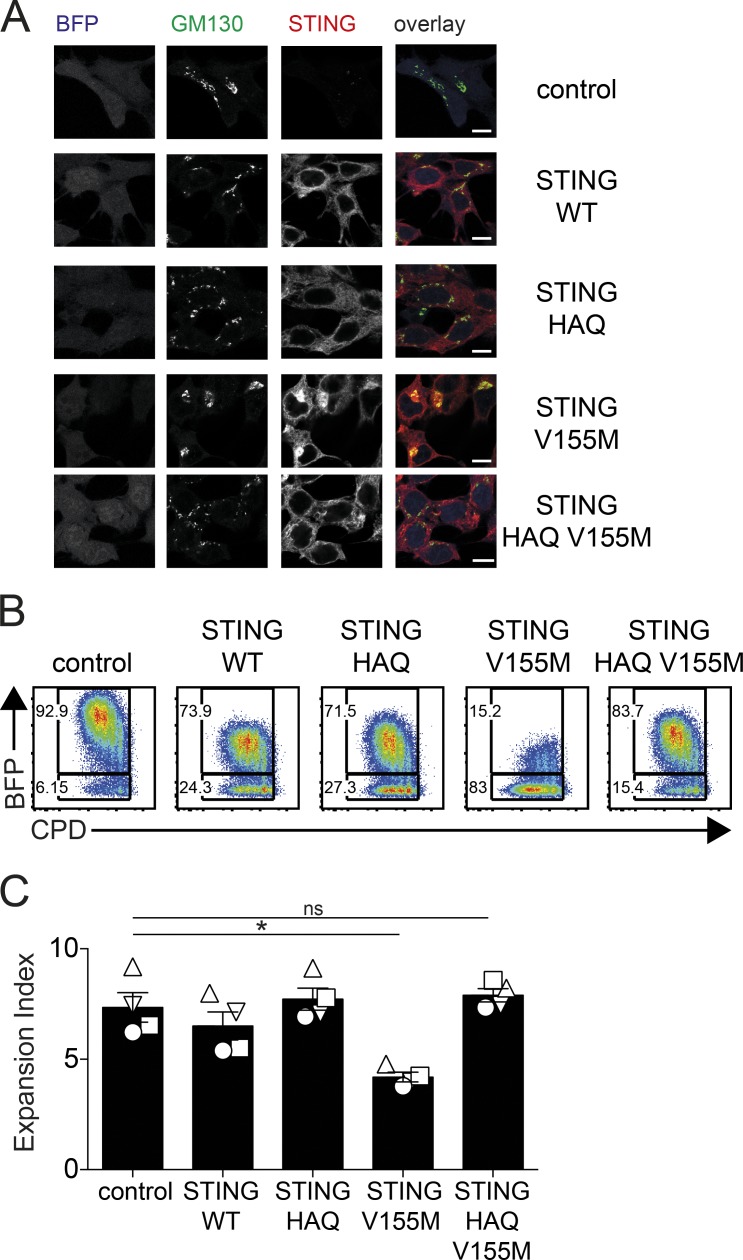
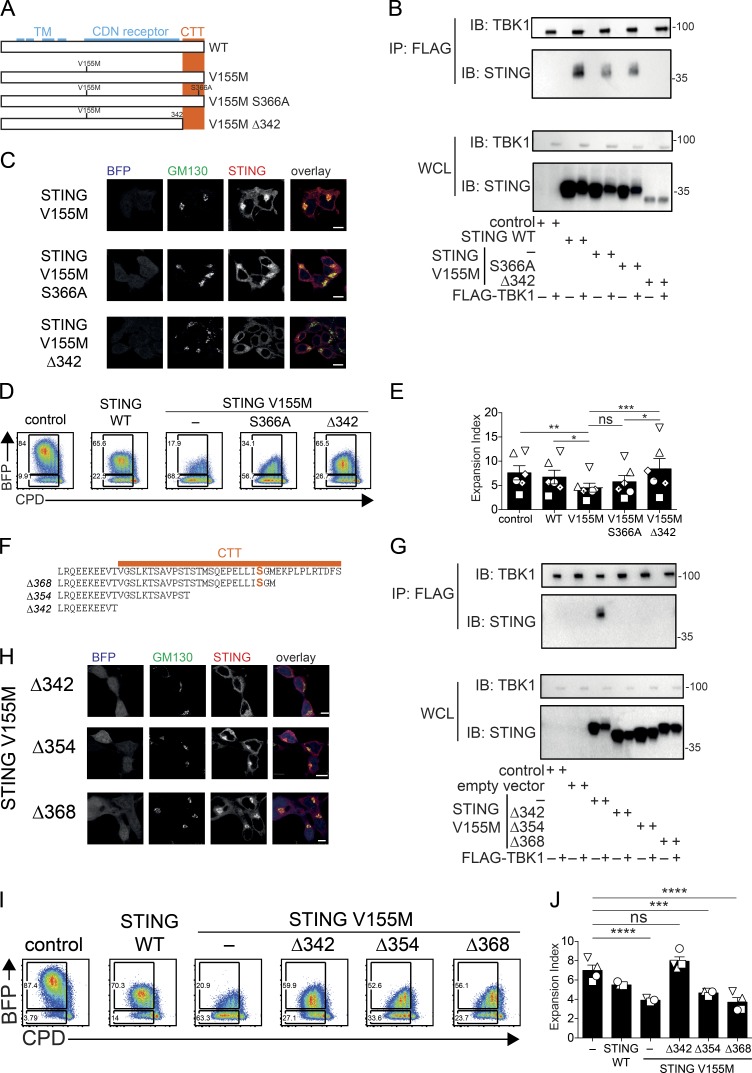
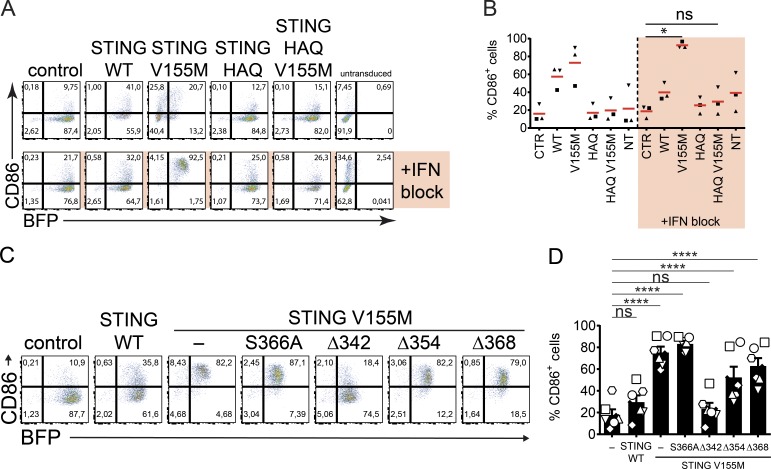
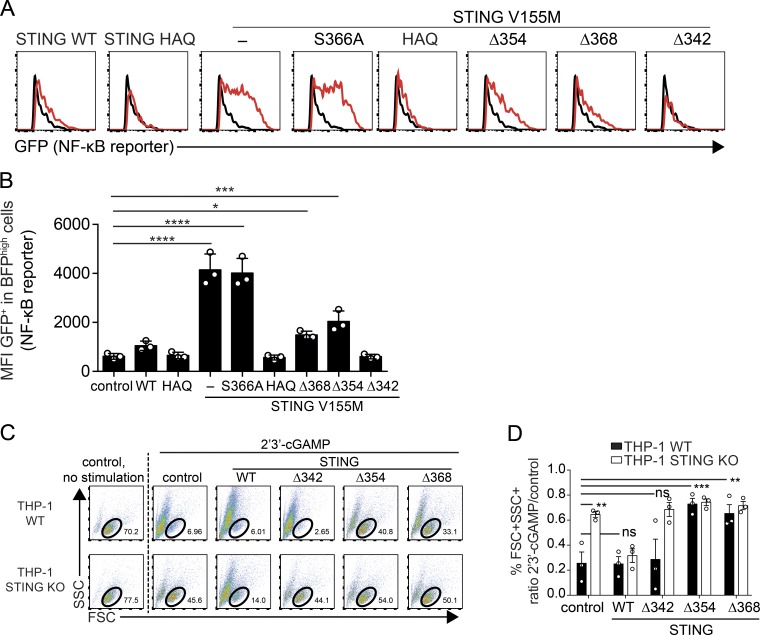
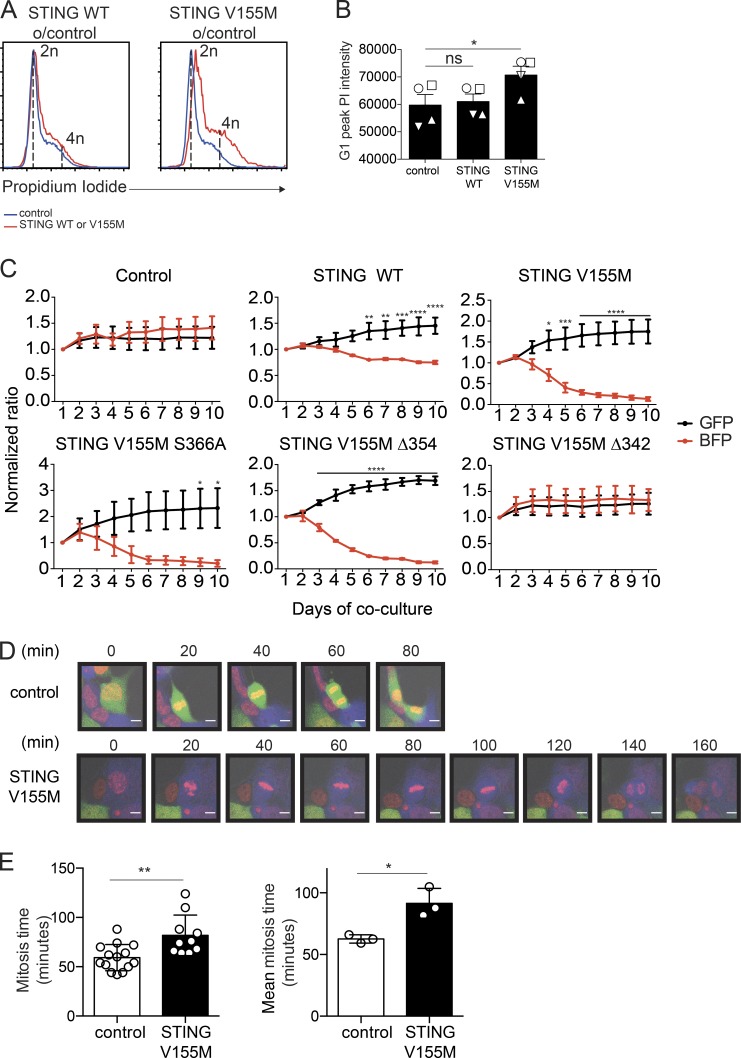
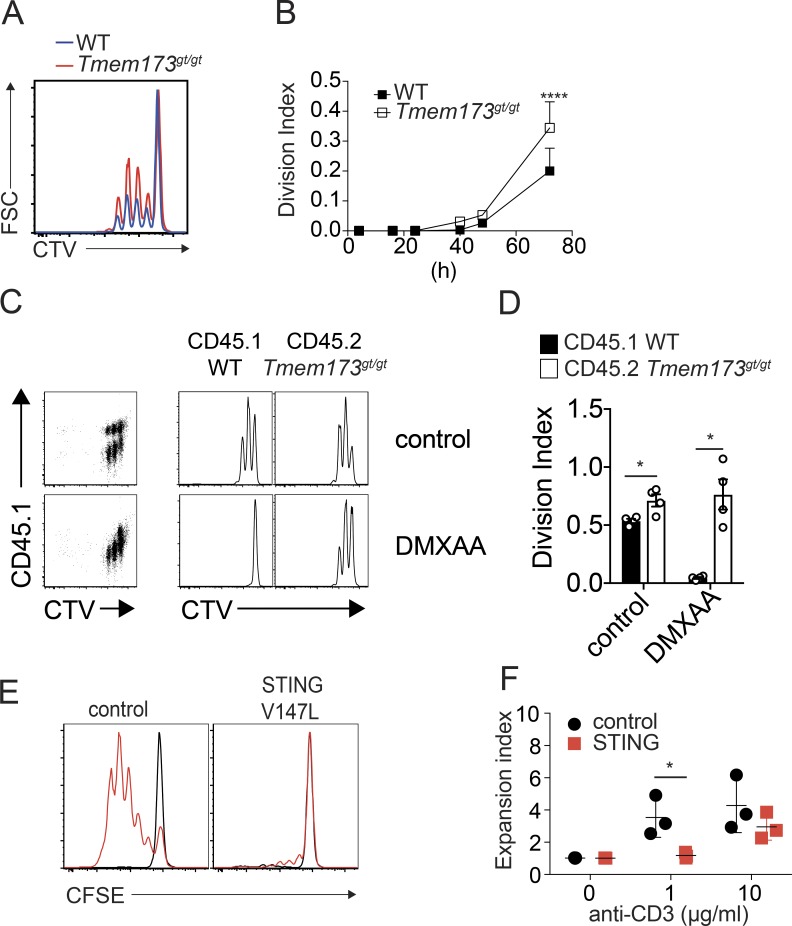
Activation of the cyclic dinucleotide sensor stimulator of interferon (IFN) genes (STING) is critical for IFN and inflammatory gene expression during innate immune responses. However, the role of STING in adaptive immunity is still unknown. In this study, we show that STING activation reduces the proliferation of T lymphocytes. This activity was independent of TBK1 and IRF3 recruitment and of type I IFN but required a distinct C-terminal domain of STING that activates NF-κB. Inhibition of cell proliferation by STING required its relocalization to the Golgi apparatus and caused mitotic errors. T lymphocytes from patients carrying constitutive active mutations in TMEM173 encoding STING showed impaired proliferation and reduced numbers of memory cells. Endogenous STING inhibited proliferation of mouse T lymphocytes. Therefore, STING, a critical innate sensor, also functions intrinsically in cells of the adaptive immune system to inhibit proliferation.


Figures

Figure 1.
Figure 1.
T cell imbalance induced by constitutive active STING. (A) Frequency of naive and memory CD4+ and CD8+ T cell compartments in patients carrying activating TMEM173 mutations. Each symbol represents an individual donor. n = 4 donors. TCM, T central memory; TEM, T effector memory; TEMRA, T effector memory CD45RA+. Age-matched expected values are indicated in gray. (B) Immunoblot of cGAS, STING, IFI16, and actin expression in resting naive (N) or central memory (CM) CD4+ T cells from blood of healthy donors. n = 3 donors. The arrowhead indicates the specific cGAS band, and ns indicates the non-specific band. (C) Immunoblot of cGAS, STING, IFI16, and actin (top) and surface expression of CD25 and CD69 (bottom) in naive CD4 T cells from day 0 to day 6 after activation with PHA and IL-2. Data are representative of n = 2 donors. o/e, overexpression. (B and C) Molecular mass is shown in kilodaltons. (D) Proliferation profile of naive CD4+ T cells 4 d after transduction with BFP lentivectors coding for control, STING WT, or STING V155M. (E) Expansion index in BFP-positive and proliferating cells as in D. n = 11. Data are mean ± SEM. One-way ANOVA with Tukey’s correction was used. *, P < 0.05; **, P < 0.01.
Figure 2.
Figure 2.
STING has an intrinsic antiproliferative activity in T cells. (A) Type I IFN activity (top; n = 4 donors) and TNF concentration (bottom; n = 5 donors) in supernatants of naive CD4+ T cells 4 d after transduction with control, STING WT, or STING V155M BFP lentivectors. (B) BFP and intracellular MX1 expression and proliferation profile (CFSE) after type I IFN neutralization or azidothymidine (AZT)/nevirapine (NVP) treatment (BFP only) in naive CD4+ T cells transduced with STING V155M BFP lentivectors. (C) Expansion index (top) and MX1-specific intracellular staining (bottom) in proliferating BFP-positive cells as in B. n = 3. MFI, mean fluorescence intensity. (D) BFP expression and proliferation profile (CPD) after TNF neutralization in naive CD4+ T cells transduced with STING V155M BFP lentivectors. (E) Annexin V and PI staining in naive CD4+ T cells transduced with control, STING WT, or STING V155M BFP lentivectors or treated with 25 µM etoposide or DMSO. (F) Frequency of annexin V–positive cells in BFP-positive cells as in E. n = 4. (G) BFP expression, proliferation profile, and annexin V and PI staining in naive CD4+ T cells transduced with STING V155M BFP lentivectors after treatment with 50 µM Z-VAD-FMK or DMSO. (H) Expansion index in BFP-positive naive CD4+ T cells transduced with control, STING WT, or STING V155M BFP lentivectors after treatment with Z-VAD-FMK or DMSO. n = 4. Data are mean ± SEM. One-way ANOVA test with Tukey’s correction was used. *, P < 0.05.
Figure 3.
Figure 3.
STING signaling activity is required to inhibit T cell proliferation. (A) Staining for STING and GM130 and BFP expression in 293FT cells transduced with control, STING WT, STING HAQ, STING V155M, or STING HAQ V155M lentivectors (portion of one field out of four fields, representative of three independent experiments). Bars, 10 µM. (B) Naive CD4+ T cell proliferation profile (CPD) 4 d after transduction with BFP lentivectors coding for control, STING WT, STING HAQ, STING V155M, or STING HAQ V155M. (C) Expansion index in BFP-positive cells as in B. n = 4. Data are mean ± SEM. One-way ANOVA with Dunnett’s correction was used. *, P < 0.05.
Figure 4.
Figure 4.
miniCTT, a functional domain of STING distinct from TBK1 and IRF3 binding sites that inhibits T cell proliferation. (A) Schematics of STING S366A and Δ342 mutants. TM denotes the transmembrane domains, CDN denotes the cyclic dinucleotide receptor domain, and the CTT is also shown (Kranzusch et al., 2015). (B) Immunoprecipitation (IP) of STING mutants by TBK1. 293FT cells were transfected with control, STING WT, V155M, V155M S366A, or V155M Δ342 plasmids and FLAG-TBK1 plasmid for 24 h. Cell lysates were prepared and immunoprecipitated with anti-FLAG beads. Input cell lysates and immunoprecipitates were analyzed by Western blot with the indicated antibodies. IB, immunoblot; WCL, whole-cell lysate. Molecular mass is shown in kilodaltons. (C) Staining for STING and GM130 and BFP expression in 293FT cells transduced with STING V155M, V155M S366A, or V155M Δ342 BFP lentivectors (portion of one field out of four fields, representative of three independent experiments). Bars 10 µM. (D) Naive CD4+ T cell proliferation profile (CPD) 4 d after transduction with control, STING WT, V155M, V155M S366A, or V155M Δ342 BFP lentivectors. (E) Expansion index in BFP-positive cells as in D. n = 6. Data are mean ± SEM. One-way ANOVA with Tukey’s correction was used. *, P < 0.05; **, P < 0.01; ***, P < 0.005. (F) Schematics of STING CTT deletion mutants Δ342, Δ354, and Δ368. Serine 366 is indicated in bold orange. (G) Immunoprecipitation of STING mutants by TBK1. 293FT cells were transfected with control, STING V155M, V155M Δ342, V155M Δ354, or V155M Δ368 plasmids and FLAG-TBK1 plasmid for 24 h. Cell lysates were prepared and immunoprecipitated with anti-FLAG beads. Input cell lysates and immunoprecipitates were analyzed by Western blotting with the indicated antibodies. Molecular mass is shown in kilodaltons. (H) Staining for STING and GM130 and BFP expression in 293FT cells transduced with STING V155M Δ342, V155M Δ354, or V155M Δ368 BFP lentivectors (portion of one field out of four fields). Bar, 10 µM. (I) Cell proliferation profile in naive CD4+ T cells transduced with control, STING WT, V155M, V155M Δ342, V155M Δ354, or V155M Δ368 BFP lentivectors. (J) Expansion index in BFP-positive cells as in I. n = 4. Data are mean ± SEM. One-way ANOVA with Dunnett’s correction was used. ***, P < 0.001; ****, P < 0.0001.
Figure 5.
Figure 5.
miniCTT mediates activation of DCs. (A) BFP and CD86 expression in DCs 4 d after transduction with control, STING WT, STING HAQ, STING V155M, or STING HAQ V155M BFP lentivectors and neutralization of type I IFN. (B) CD86 expression as in A. n = 3 independent donors combined from two experiments. One-way ANOVA with Tukey’s posthoc test was used. *, P < 0.05. CTR, control; NT, not transduced. (C) CD86 and BFP expression in DCs transduced with control, STING WT, V155M, V155M S366A, V155M Δ342, V155M Δ354, and V155M Δ368 BFP lentivectors with type I IFN neutralization. (D) CD86 and BFP expression as in C. n = 6 independent donors combined from three independent experiments. One-Way ANOVA with Dunnett’s multiple comparisons test was used. Data are mean ± SEM. ****, P < 0.0001.
Figure 6.
Figure 6.
Signaling mediated by STING miniCTT. (A) GFP expression after NF-κB reporter activation in 293FT cells transduced with the indicated STING constructs. (B) GFP expression as in A. n = 3 independent experiments. One-Way ANOVA with Dunnett’s multiple comparison test was used. Data are mean ± SD. *, P < 0.05; ***, P < 0.0005; ****, P < 0.0001. MFI, mean fluorescence intensity. (C) Induction of cell death by 2′3′-cGAMP with Lipofectamine in THP-1 WT or THP-1 STING KO cells, transduced by the indicated BFP lentivector. FSC, forward scatter; SSC, side scatter. (D) Ratio of live cells (FSC+SSC+ live-cell gate) after 2′3′-cGAMP stimulation versus no stimulation is shown, as in C. n = 3 independent experiments. Data are mean ± SEM. One-Way ANOVA with Tukey's multiple comparisons test was used. **, P < 0.01; ***, P < 0.001.
Figure 7.
Figure 7.
STING V155M induces mitotic errors. (A) PI staining in naive CD4+ T cells 4 d after transduction with control, STING WT, or STING V155M BFP lentivectors. o/control, over control. (B) PI intensity of G1 peak (mode of linear PE) as in A. n = 4. Data are mean ± SEM. One-way ANOVA with Dunnett’s correction was used. (C) Competition between GFP control-transduced cells and the indicated BFP control or the indicated BFP-2A–STING–transduced cells. n = 3 independent experiments. Data are mean ± SEM. Two-way ANOVA with Sidak’s multiple comparison test was used. (D) Snapshots of a representative control cell expressing GFP (top) or STING V155M (bottom) and undergoing cell division. DNA (red), BFP-2A–V155M (blue), and control cells expressing GFP (green) are shown. Bars, 10 µM. (E, left) Mitosis time calculated in 293FT cells expressing STING V155M or control (GFP or untransduced). (Right) Mean mitosis time from three independent experiments. n = 3. Data are mean ± SD. Unpaired Student’s t test was used. *, P < 0.05; **, P < 0.005; ***, P < 0.0005; ****, P < 0.0001.
Figure 8.
Figure 8.
STING inhibits T cell proliferation in normal and pathological conditions. (A) Proliferation profile (CTV) of WT (blue) or Tmem173gt/gt (red) mouse CD4+ T cells 72 h after activation with 1 µg/ml αCD3/αCD28. FSC, forward scatter. (B) Division index as in A. n = 4 mice combined from two independent experiments. Data are mean + SEM. Two-way ANOVA with Sidak’s multiple comparison test was used. (C) Proliferation profile of mixed CD45.1+ WT or CD45.2+ Tmem173gt/gt CD4+ T cells cultured for 48 h in the presence of 10 µg/ml αCD3/αCD28 with or without 12.5 µM DMXAA. Live cells were gated. (D) Division index as in C. n = 4 mice combined from two independent experiments. Data are mean ± SEM. One-way ANOVA with Tukey correction was used. (E) Proliferation profile (CFSE) of CD3+ T cells from a patient carrying an activating TMEM173 mutation (V147M) or from a healthy control upon PBMC stimulation with 1 µg/ml anti-CD3 and 1 µg/ml anti-CD28 for 4 d. Black peaks indicate unstimulated cells, and red peaks correspond to the stimulated condition. (F) Expansion index as in E for two patients carrying the V155M mutation and one patient carrying the V147M mutation in TMEM173. n = 3 donors. Data are mean ± SEM. Two-Way ANOVA with Sidak’s multiple comparison test was used. *, P < 0.05; ****, P < 0.0001.

References

    1. Abe T., and Barber G.N.. 2014. Cytosolic-DNA-mediated, STING-dependent proinflammatory gene induction necessitates canonical NF-κB activation through TBK1. J. Virol. 88:5328–5341. 10.1128/JVI.00037-14 - DOI - PMC - PubMed
    1. Bruchard M., Rebé C., Derangère V., Togbé D., Ryffel B., Boidot R., Humblin E., Hamman A., Chalmin F., Berger H., et al. . 2015. The receptor NLRP3 is a transcriptional regulator of TH2 differentiation. Nat. Immunol. 16:859–870. 10.1038/ni.3202 - DOI - PubMed
    1. Burdette D.L., Monroe K.M., Sotelo-Troha K., Iwig J.S., Eckert B., Hyodo M., Hayakawa Y., and Vance R.E.. 2011. STING is a direct innate immune sensor of cyclic di-GMP. Nature. 478:515–518. 10.1038/nature10429 - DOI - PMC - PubMed
    1. Chien Y., Scuoppo C., Wang X., Fang X., Balgley B., Bolden J.E., Premsrirut P., Luo W., Chicas A., Lee C.S., et al. . 2011. Control of the senescence-associated secretory phenotype by NF-κB promotes senescence and enhances chemosensitivity. Genes Dev. 25:2125–2136. 10.1101/gad.17276711 - DOI - PMC - PubMed
    1. Ching L.M., Cao Z., Kieda C., Zwain S., Jameson M.B., and Baguley B.C.. 2002. Induction of endothelial cell apoptosis by the antivascular agent 5,6-dimethylxanthenone-4-acetic acid. Br. J. Cancer. 86:1937–1942. 10.1038/sj.bjc.6600368 - DOI - PMC - PubMed