. 2017 May 8;7(1):1576.
doi: 10.1038/s41598-017-01747-8.

Characterizing microglia activation: a spatial statistics approach to maximize information extraction

Affiliations

Characterizing microglia activation: a spatial statistics approach to maximize information extraction

Benjamin M Davis et al. Sci Rep. .

Abstract

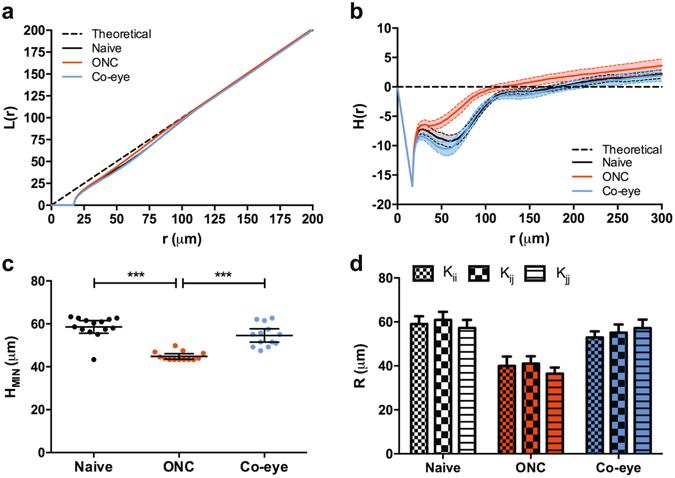
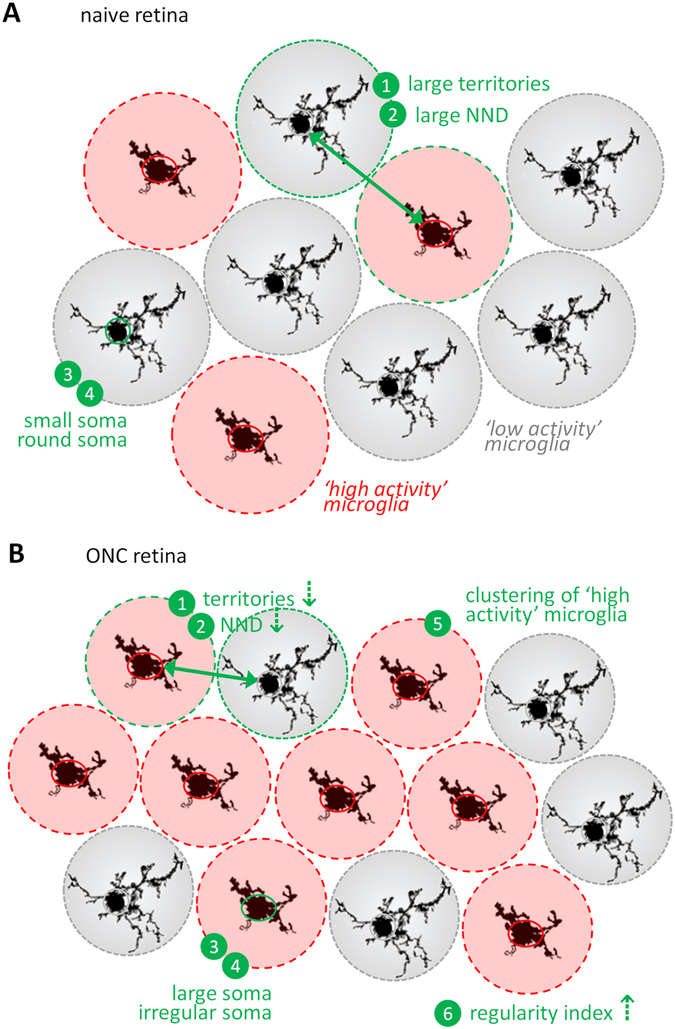
Microglia play an important role in the pathology of CNS disorders, however, there remains significant uncertainty about the neuroprotective/degenerative role of these cells due to a lack of techniques to adequately assess their complex behaviour in response to injury. Advancing microscopy techniques, transgenic lines and well-characterized molecular markers, have made histological assessment of microglia populations more accessible. However, there is a distinct lack of tools to adequately extract information from these images to fully characterise microglia behaviour. This, combined with growing economic pressures and the ethical need to minimise the use of laboratory animals, led us to develop tools to maximise the amount of information obtained. This study describes a novel approach, combining image analysis with spatial statistical techniques. In addition to monitoring morphological parameters and global changes in microglia density, nearest neighbour distance, and regularity index, we used cluster analyses based on changes in soma size and roundness to yield novel insights into the behaviour of different microglia phenotypes in a murine optic nerve injury model. These methods should be considered a generic tool to quantitatively assess microglia activation, to profile phenotypic changes into microglia subpopulations, and to map spatial distributions in virtually every CNS region and disease state.


Conflict of interest statement

The authors declare that they have no competing interests.

Figures

Figure 1
Figure 1
Algorithm optimization. (a) Linear fit of the mean operator counts versus the numbers of microglia detected by the automated algorithm, reveals a strong correlation (y = 1.007x; R2 = 0.843) and validates our algorithm. (b) This is confirmed by the Bland-Altman plot, which shows a bias of 4.20%. For comparison, bias for three observers was −8.35%, 4.33% and 3.50%. Data are depicted as mean ± 95% confidence intervals.
Figure 2
Figure 2
Microglia numbers and distribution. (a) A significant increase in overall microglia density is seen when comparing naive versus ONC retinas (4 days post injury). The microglia density of microglia is not significantly different between naive retinas and retinas from the contralateral eye of the ONC animals (one-way ANOVA with Tukey’s post hoc test). (b) Nearest neighbour distance (NDD) is significantly higher in ONC retinas, but not in the contralateral eye (one-way ANOVA with Tukey’s post hoc test). (c) Plotting cumulative microglia density, depicted as a percentage of the total microglia number, reveals that retinal microglia density is higher in the central regions of retina in ONC and contralateral eyes versus naive eyes. This can be observed as a left-shift of the ONC and Co-eye curves (arrow). (d) Distribution analysis of NND, in relation to the distance from the ONH, indicates that overall NND decreases in ONC eyes in comparison to naive eyes. However, NND disproportionally increases in the peripheral retina, a pattern that can also be discerned in the retinas of contralateral eyes (arrows). (e) Pseudocolor images of microglia NND/density in retinal whole-mounts. Red-to-blue pseudocolour representation of microglia distribution, ranging from small NND (15 μm, red tones) to large NND (70 μm, blue tones). (f) The regularity index of the microglia population increases upon ONC (one-way ANOVA with Tukey’s post hoc test). (g) A probability function of the NND points out that both the mean NND and NND standard deviation decrease after ONC, which explains the increase in regularity index. Data are depicted as mean ± 95% confidence intervals.
Figure 3
Figure 3
Microglia soma size and roundness. (a) Microglial activity following ONC is associated with an increase in average cell body area; while (b) roundness of the cell soma decreases (one-way ANOVA with Tukey’s post hoc test). These signs of microglial activation are not seen in the retina of the contralateral ONC eyes. (c) Distribution analysis of soma area shows a shift from small to larger cell body sizes after ONC; and (d) distribution analysis of circularity indicates that these cells are more likely to be more irregularly shaped (i.e., to have a lower roundness index). Data are depicted as mean ± 95% confidence intervals.
Figure 4
Figure 4
K-means clustering into ‘low activity’ and ‘high activity’ microglia subpopulations. (a) Two subpopulations of microglia were defined via K-means cluster analysis of a total of 123.868 cells (i.e., the sum of microglia from 14 naive retinas, 14 ONC retinas and 14 contralateral retinas), based on their roundness and soma size. (b) Images of representative retinal whole-mounts from naive, ONC and contralateral eyes, showing the distribution of ‘high activity’ (red) and ‘low activity’ (black) microglia. Each dot represents a microglia cell. (c) Absolute numbers of ‘low activity’ and ‘high activity’ microglia in the retina reveal that microgliosis after ONC merely presents as an increase in the number of ‘high activity’ microglia (one-way ANOVA with Tukey’s post hoc test). (d) This results in an increased proportion of ‘high activity’ versus ‘low activity’ microglia at day 4 post ONC, in comparison to naive retinas. No significant changes were observed in the contralateral eye. Data are depicted as mean ± 95% confidence intervals.
Figure 5
Figure 5
Ripley’s K-statistics, analysing spatial clustering of microglia subtypes. (a) For all treatment groups, L(r) and H(r) derivatives of Ripley’s K-function are negative for small values of r, indicating that retinal microglia have a dispersed topographical organisation. (b) Upon ONC, defined as the minimum of H(r), the domain radius of microglia decreases in size (one-way ANOVA with Tukey’s post hoc test). (c) Comparison of cross-K (K ij) and self-K functions (K ii and K jj) shows that ‘low activity’ and ‘high activity’ microglia subpopulations evenly decrease their domain radius after ONC injury (two-way ANOVA with Tukey’s post hoc test). Data are depicted as mean ± 95% confidence intervals.
Figure 6
Figure 6
Summary figure integrating all findings from this study. (a) In a naive retina, microglia typically have small somata and large territories, corresponding to a ‘low activity’ status (grey). They are regularly interspersed with a minority of ‘high activity’ cells (red). (b) At day 4 post ONC, microglia density has increased and the majority of the microglia has adopted a ‘high activity’ phenotype, characterized by a reduction in their territory, enlargement of their cell body and a more irregular cell shape. Furthermore, although ‘low activity’ and ‘high activity’ microglia are regularly spaced, ‘high activity’ microglia tend to self-associate.

References

    1. Nayak D, Roth TL, McGavern DB. Microglia Development and Function. Annl Rev Immunol. 2014;32:367–402. doi: 10.1146/annurev-immunol-032713-120240. - DOI - PMC - PubMed
    1. Wake H, Moorhouse AJ, Nabekura J. Functions of microglia in the central nervous system–beyond the immune response. Neuron glia biol. 2011;7:47–53. doi: 10.1017/s1740925x12000063. - DOI - PubMed
    1. Karperien A, Ahammer H, Jelinek HF. Quantitating the subtleties of microglial morphology with fractal analysis. Frontiers Cell Neurosci. 2013;7:3. doi: 10.3389/fncel.2013.00003. - DOI - PMC - PubMed
    1. Tang Y, Le W. Differential Roles of M1 and M2 Microglia in Neurodegenerative Diseases. Mol Neurobiol. 2015 doi: 10.1007/s12035-014-9070-5. - DOI - PubMed
    1. London, A., Cohen, M. & Schwartz, M. Microglia and monocyte-derived macrophages: functionally distinct populations that act in concert in CNS plasticity and repair. Front Cell Neurosci7, doi:10.3389/fncel.2013.00034 (2013). - PMC - PubMed

Publication types