. 2017 May 8;7(1):1555.
doi: 10.1038/s41598-017-01518-5.

Inferring the evolutionary mechanism of the chloroplast genome size by comparing whole-chloroplast genome sequences in seed plants

Affiliations

Inferring the evolutionary mechanism of the chloroplast genome size by comparing whole-chloroplast genome sequences in seed plants

Zheng Xiao-Ming et al. Sci Rep. .

Abstract

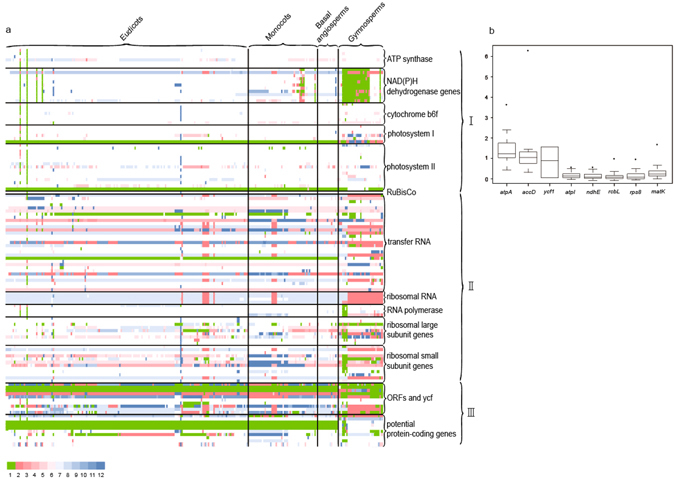
The chloroplast genome originated from photosynthetic organisms and has retained the core genes that mainly encode components of photosynthesis. However, the causes of variations in chloroplast genome size in seed plants have only been thoroughly analyzed within small subsets of spermatophytes. In this study, we conducted the first comparative analysis on a large scale to examine the relationship between sequence characteristics and genome size in 272 seed plants based on cross-species and phylogenetic signal analysis. Our results showed that inverted repeat regions, large or small single copies, intergenic regions, and gene number can be attributed to the variations in chloroplast genome size among closely related species. However, chloroplast gene length underwent evolution affecting chloroplast genome size in seed plants irrespective of whether phylogenetic information was incorporated. Among chloroplast genes, atpA, accD and ycf1 account for 13% of the variation in genome size, and the average Ka/Ks values of homologous pairs of the three genes are larger than 1. The relationship between chloroplast genome size and gene length might be affected by selection during the evolution of spermatophytes. The variation in chloroplast genome size may influence energy generation and ecological strategy in seed plants.


Conflict of interest statement

The authors declare that they have no competing interests.

Figures

Figure 1
Figure 1
Variations in chloroplast genome size and the sequence characteristics of chloroplast genomes within seed plants. The box plots of chloroplast genome size and sequence characteristics of chloroplast genome are shown for each order. The complete order names are in Supplementary Table S1. The box plots represent the median (central line), first and third quartiles (black box), and outliers (black circles). TL, IRL, LSCL, SSCL, GRL, IGRL, and GN indicate the total length of the chloroplast genome, length of the inverted repeat region, large single copy, small single copy, gene region, intergenic region, and gene number, respectively. Red triangles in TL indicate there were no inverted repeat regions in these species. The numbers below order names are the number of species collected in each order. The number in the brackets indicates the number of species without an inverted repeat region. The three lines from the top to bottom represent the first quartiles, the median, and the third quartiles of the sequence characteristics of all seed plants examined in this study, respectively.
Figure 2
Figure 2
Variations in chloroplast genome size and the sequence characteristics of chloroplast genome in gymnosperms (pink), basal angiosperms (blue), monocots (yellow), and eudicots (green). The box plots represent the median (central line), first and third quartiles (black box), and outliers (black circles).
Figure 3
Figure 3
Relationship between chloroplast genome size and chloroplast gene length. (a) Heat maps of standardized contrast (SC) values for each gene. SCs were obtained by dividing the raw contrasts between gene length and the average gene length by the standard deviation. Green indicates that the gene was lost in the species. White indicates that SC is zero, which indicates that the sequence characteristics of this species were equal to the average of the sequence characteristics of all seed plants collected for this study. Red stands for an SC larger than zero, blue stands for an SC smaller than zero, and larger absolute values of SC are indicated by darker colors. I indicates genes for the photosynthetic apparatus, II comprises RNA genes and genes for the genetic apparatus, and III represents potential genes. (b) The box plots of Ka/Ks values of atpA, accD, ycf1 atpI, ndhE, rbcL, rps8, and matK in the homologous genes of plants.

References

    1. Grime JP, Mowforth MA. Variation in genome size-an ecological interpretation. Nature. 1982;299:151–153. doi: 10.1038/299151a0. - DOI
    1. Petrov DA, Sangster TA, Johnston JS, Hartl DL, Shaw KL. Evidence for DNA Loss as a Determinant of Genome Size. Science. 2000;287:1060–1062. doi: 10.1126/science.287.5455.1060. - DOI - PubMed
    1. Feng P, Zhao HB, Lu X. Evolution of mitochondrial DNA and its relation to basal metabolic rate. Mitochondrial DNA. 2015;26:566–571. doi: 10.3109/19401736.2013.873895. - DOI - PubMed
    1. Bennett DR, Gorzinski SJ, LeBeau JE. Structure-activity relationships of oral organosiloxanes on the male reproductive system. Toxicology and Applied Pharmacology. 1972;21:55–67. doi: 10.1016/0041-008X(72)90027-0. - DOI - PubMed
    1. Lane N, Martin W. The energetics of genome complexity. Nature. 2010;467:929–934. doi: 10.1038/nature09486. - DOI - PubMed

Publication types