. 2017 May 8;7(1):1578.
doi: 10.1038/s41598-017-01822-0.

Tyrosine kinase inhibitors of Ripk2 attenuate bacterial cell wall-mediated lipolysis, inflammation and dysglycemia

Affiliations

Tyrosine kinase inhibitors of Ripk2 attenuate bacterial cell wall-mediated lipolysis, inflammation and dysglycemia

Brittany M Duggan et al. Sci Rep. .

Abstract

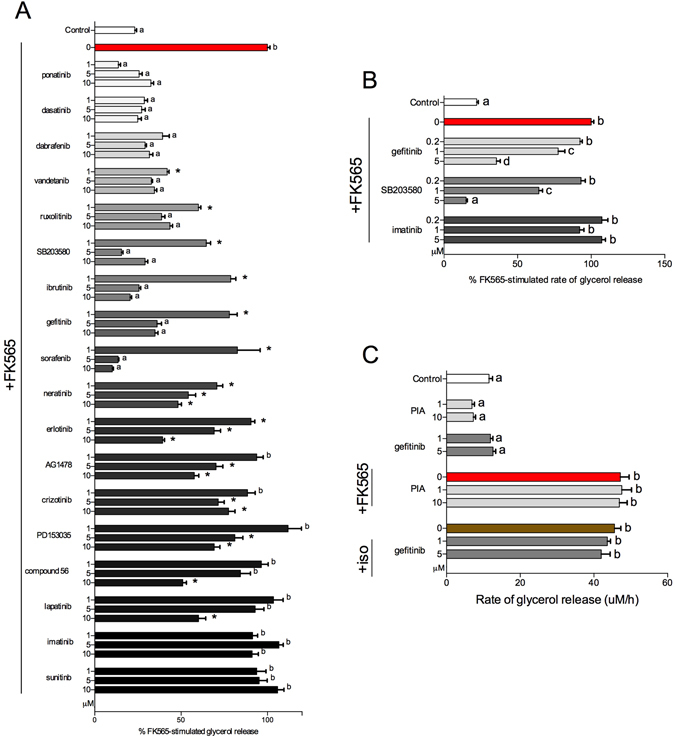
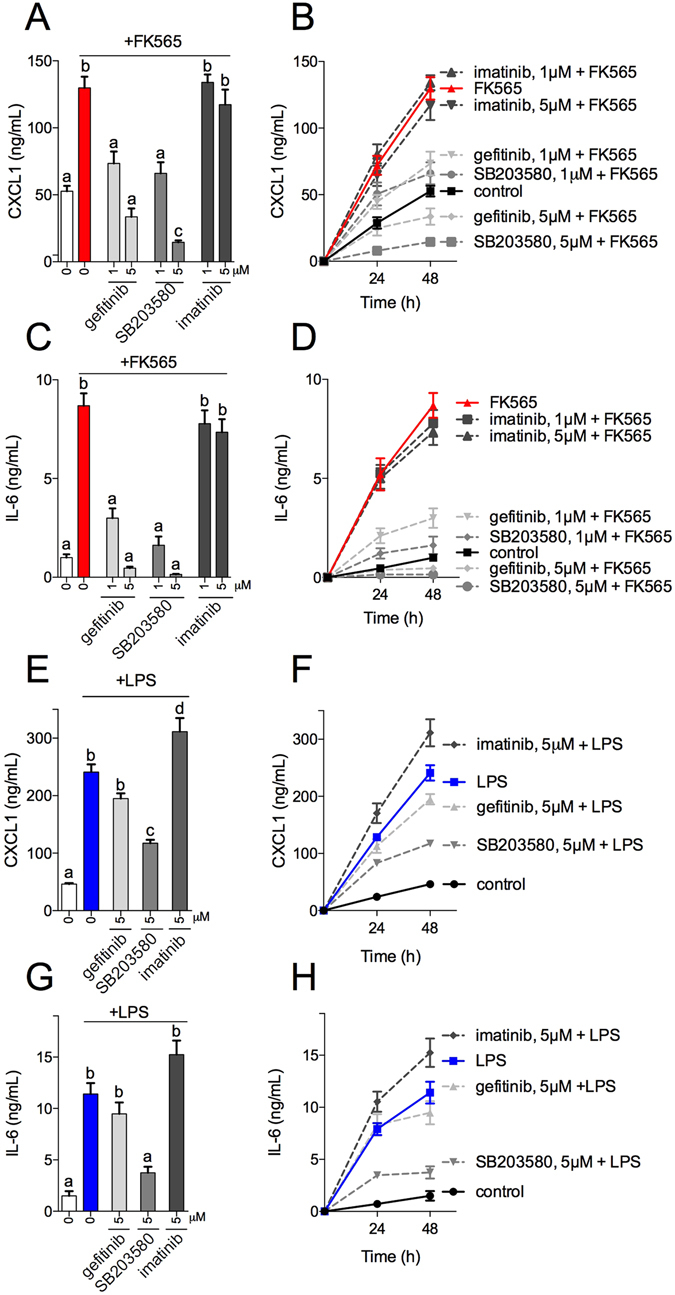
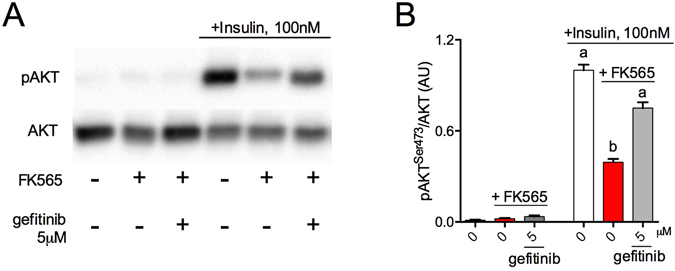
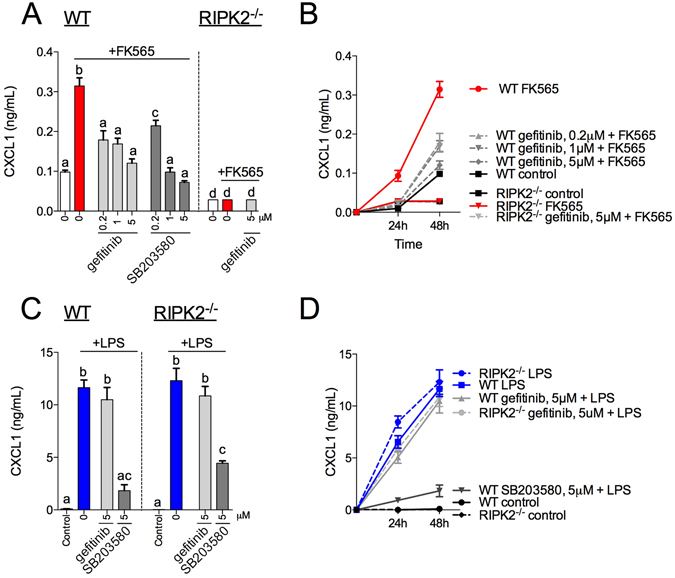
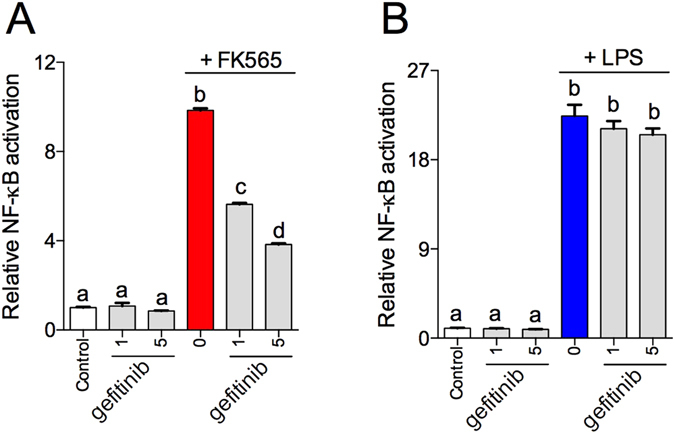
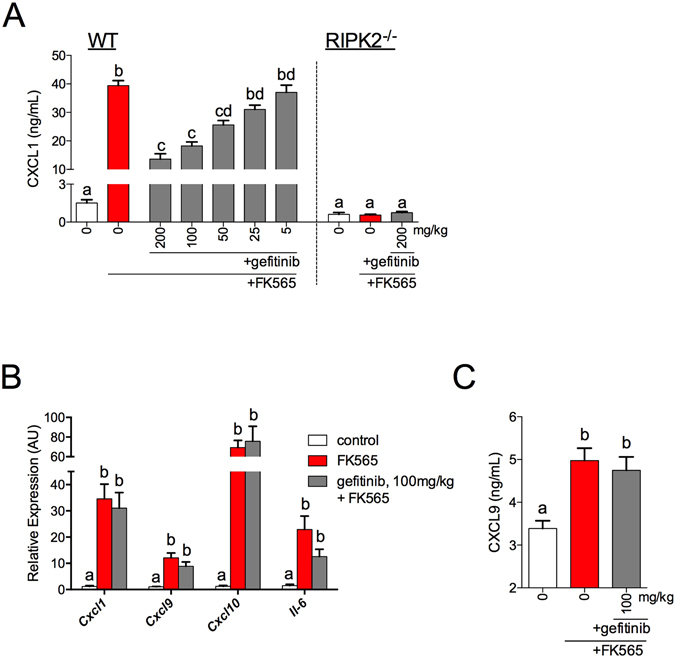
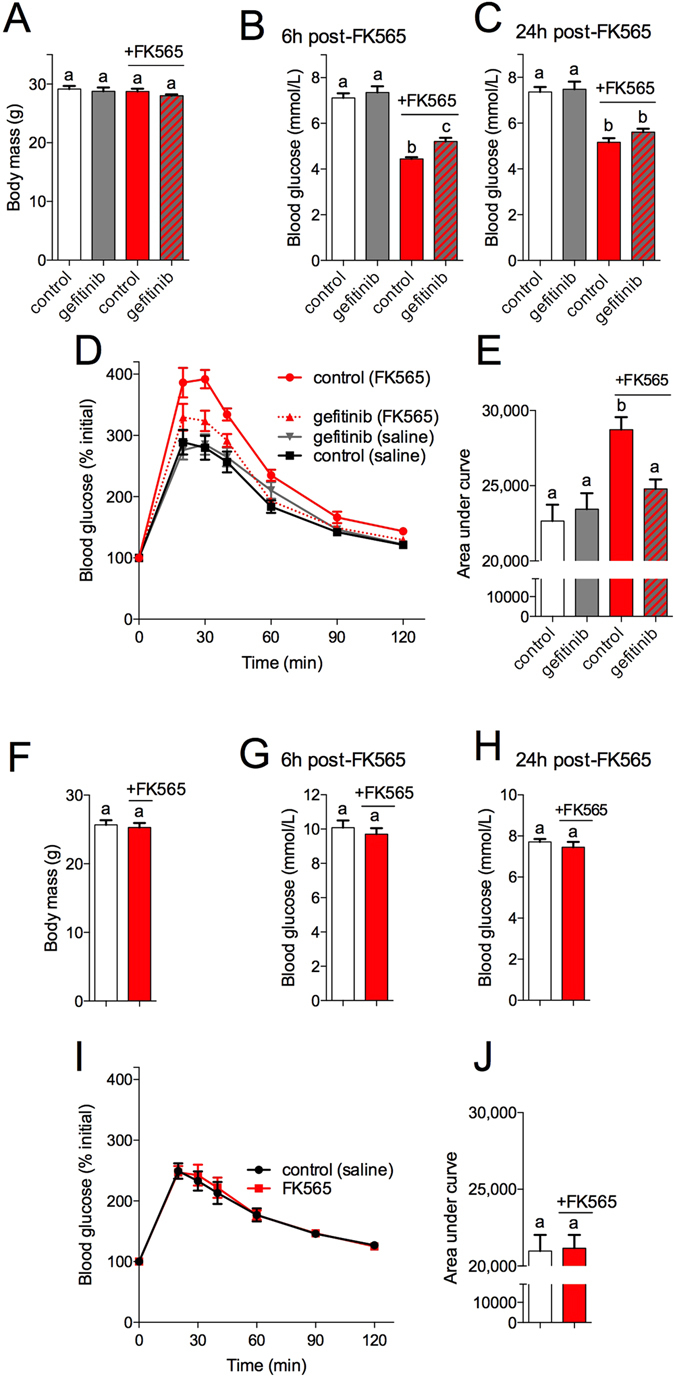
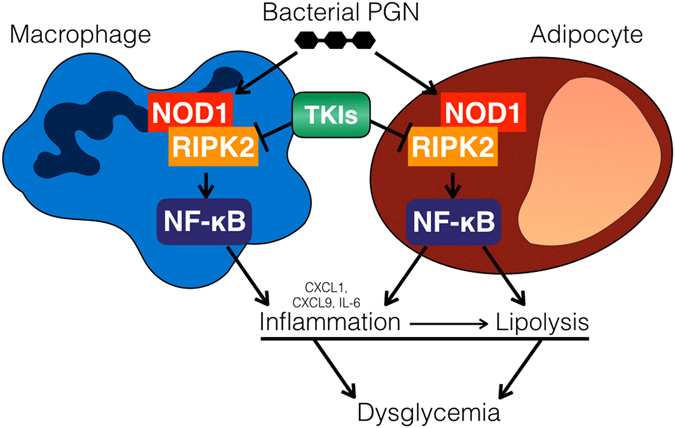
Inflammation underpins aspects of insulin resistance and dysglycemia. Microbiota-derived cell wall components such as muropeptides or endotoxin can trigger changes in host immunity and metabolism. Specific peptidoglycan motifs promote metabolic tissue inflammation, lipolysis and insulin resistance via Nucleotide-binding oligomerization domain-containing protein 1 (Nod1). Receptor-interacting serine/threonine-protein kinase 2 (Ripk2) mediates Nod1-induced immunity, but the role of Ripk2 in metabolism is ill-defined. We hypothesized that Ripk2 was required for Nod1-mediated inflammation, lipolysis and dysglycemia. This is relevant because certain tyrosine kinase inhibitors (TKIs) inhibit Ripk2 and there is clinical evidence of TKIs lowering inflammation and blood glucose. Here, we showed that only a subset of TKIs known to inhibit Ripk2 attenuated Nod1 ligand-mediated adipocyte lipolysis. TKIs that inhibit Ripk2 decreased cytokine responses induced by Nod1-activating peptidoglycan, but not endotoxin in both metabolic and immune cells. Pre-treatment of adipocytes or macrophages with the TKI gefitinib inhibited Nod1-induced Cxcl1 and Il-6 secretion. Furthermore, treatment of mice with gefitinib prevented Nod1-induced glucose intolerance in vivo. Ripk2 was required for these effects on inflammation and metabolism, since Nod1-mediated cytokine and blood glucose changes were absent in Ripk2-/- mice. Our data show that specific TKIs used in cancer also inhibit Nod1-Ripk2 immunometabolism responses indicative of metabolic disease.


Conflict of interest statement

The authors declare that they have no competing interests.

Figures

Figure 1
Figure 1
Selected TKIs inhibit bacterial cell wall-mediated lipolysis in adipocytes. Relative levels of glycerol released from 3T3-L1 adipocytes after stimulation with the Nod1 ligand FK565 (10 μg/mL) for 48 h and pre-incubated for 1 h with 1, 5 or 10 μM of various TKIs (A) n = 6–69. Rate of glycerol release over 48 h in 3T3-L1 adipocytes pre-incubated for 1 h with 0.2, 1 or 5 μM gefitinib, SB203580, and imatinib (B) n = 8–49. Rate of glycerol release over 48 h in 3T3-L1 adipocytes pre-incubated for 1 h with PIA (1 or 10 μM) and stimulated with FK565 (10 μg/mL), or pre-incubated with gefitinib (1 or 5 μM) and stimulated with isoproterenol (2 μM) respectively (C) n = 6–10. Values are mean ± SEM. Conditions with different letters (a, b, c) denote a statistical difference compared to all other conditions without the same letter (P < 0.05). *Denotes partial inhibition that is statistically lower than FK565-stimulated glycerol release, but significantly higher than basal glycerol release for a given TKI (p < 0.05).
Figure 2
Figure 2
Selected TKIs inhibit cytokine responses in adipocytes induced by bacterial cell wall-mediated components, but not endotoxin. Levels of Cxcl1 released from 3T3-L1 adipocytes after stimulation with the Nod1 ligand FK565 (10 μg/mL) for 48 h and pre-incubated for 1 h with 1 or 5 μM of the TKIs gefitinib, SB203580 or imatinib (A) n = 6. Time course of FK565-stimulated Cxcl1 secretion in 3T3-L1 adipocytes (B) n = 6. Levels of Il6 released from 3T3-L1 adipocytes after stimulation with the Nod1 ligand FK565 (10 μg/mL) for 48 h and pre-incubated for 1 h with 1 or 5 μM of the TKIs gefitinib, SB203580 or imatinib (C) n = 5. Time course of FK565-stimulated Il6 secretion in 3T3-L1 adipocytes (D) n = 5. Levels of Cxcl1 released from 3T3-L1 adipocytes after stimulation with the Tlr4 ligand LPS (0.5 μg/mL) for 48 h and pre-incubated for 1 h with 1 or 5 μM of the TKIs gefitinib, SB203580 or imatinib (E) n = 6. Time course of LPS-stimulated Cxcl1 secretion in 3T3-L1 adipocytes (F) n = 6. Levels of Il6 released from 3T3-L1 adipocytes after stimulation with the Tlr4 ligand LPS (0.5 μg/mL) for 48 h and pre-incubated for 1 h with 1 or 5 μM of the TKIs gefitinib, SB203580 or imatinib (G) n = 5. Time course of LPS-stimulated Il-6 secretion in 3T3-L1 adipocytes (H) n = 5. Values are mean ± SEM. Different letters assigned to each condition (a, b, c) denote statistical differences between groups (p < 0.05).
Figure 3
Figure 3
TKI gefitinib attenuates bacterial cell wall-mediated insulin resistance in adipocytes. Representative immunoblots (A) and quantification (B) of basal (i.e. no insulin) and 100 nM insulin-stimulated pAKT (Ser473) relative to total AKT in 3T3-L1 adipocytes after 1 h pre-incubation with gefitinib (5 μM) and treatment with FK565 (10 μg/mL) for 48 h. Quantitative comparison was conducted between samples from 4 different blots derived from the same experiment and processed in parallel. (n = 8 total (n = 2/condition per blot). Cropped images are displayed and tull images of all immunoblots are presented in Supplementary Fig. 3. Values are mean ± SEM. Different letters assigned to each condition (a, b) denote statistical differences between groups (p < 0.05).
Figure 4
Figure 4
Selected TKIs inhibit RIPK2-mediated cytokine responses in macrophages induced by bacterial cell wall components, but not endotoxin. Levels of Cxcl1 released from WT (left panel) or RIPK2−/− (right panel) bone marrow-derived macrophages (BMDMs) after stimulation with the Nod1 ligand FK565 (10 μg/mL) for 48 h and pre-incubated for 1 h with 0.2, 1 or 5 μM gefitinib or SB203580 (A) n = 4–12. Time course of FK565-stimulated Cxcl1 secretion in BMDMs (B) n = 4–12. Levels of Cxcl1 released from WT (left panel) or RIPK2−/− (right panel) BMDMs after stimulation with the Tlr4 ligand LPS (0.5 μg/mL) for 48 h and pre-incubated for 1 h with 0.2, 1 or 5 μM gefitinib or SB203580 (C) n = 4–12. Time course of LPS-stimulated Cxcl1 secretion in BMDMs (D) n = 4–12. Values are mean ± SEM. Different letters assigned to each condition (a, b, c) denote statistical differences between groups (p < 0.05).
Figure 5
Figure 5
TKI gefitinib inhibits NF-κB activity induced by bacterial cell wall components, but not endotoxin. Relative NF-κB activity in HEK293 cells stably expressing Nod1, pre-incubated with gefitinib (1 or 5 μM) and stimulated with FK565 (10 μg/mL) (A), or in HEK293 cells stably expressing Tlr4, pre-incubated with gefitinib (1 or 5 μM) and stimulated with LPS (0.5 μg/mL) (B) n = 12. Values are mean ± SEM. Different letters assigned to each condition (a, b, c) denote statistical differences between groups (p < 0.05).
Figure 6
Figure 6
TKI gefitinib inhibits RIPK2-mediated inflammation in vivo. Cxcl1 secretion 2 h after injection with the Nod1 ligand FK565 (10 μg, i.p.) in WT or RIPK2−/− mice that were pre-treated with various doses of gefitinib (5–200 mg/kg) or methylcellulose vehicle for 4 days (A) n = 4–60 per group. Transcript analysis of Cxcl1, Cxcl9, Cxcl10 and Il-6 in adipose tissue 6 h after injection of FK565 (10 μg, i.p.) in mice pre-treated with 100 mg/kg gefitinib or vehicle (B) n = 7–9. Protein levels of Cxcl9 in adipose tissue tissue 6 h after injection of FK565 (10 μg, i.p.) in mice pre-treated with 100 mg/kg gefitinib or vehicle (C) n = 8–9. Values are mean ± SEM. Different letters assigned to each condition (a, b, c) denote statistical differences between groups (p < 0.05).
Figure 7
Figure 7
TKI gefitinib inhibits RIPK2-mediated dysglycemia in vivo. WT mice pre-treated with TKI gefitinib (100 mg/kg) or methylcellulose vehicle for 4 days before injection of a NOD1 ligand and metabolic testing. Body Mass (A) and fasting blood glucose at 6 h (B) and 24 h (C) after injection of WT mice with FK565 (10 μg, i.p.) in gefitinib and vehicle pretreated mice, n = 9–12. Percentage change in blood glucose over time (D) and area under the curve (E) of a glucose tolerance test (2.0 g/kg glucose, i.p.) 24 h after injection of WT mice with FK565 (10 μg, i.p.) in gefitinib and vehicle pretreated mice, n = 12. Body Mass (F) and fasting blood glucose at 6 h (G) and 24 h (H) after injection of RIPK2−/− mice with FK565 (10 μg, i.p.), n = 6–9. Percentage change in blood glucose over time (I) and area under the curve (J) of a glucose tolerance test (2.0 g/kg glucose, i.p.) 24 h after injection of RIPK2−/− mice with FK565 (10 μg, i.p.), n = 9. Values are mean ± SEM. Different letters assigned to each condition (a, b, c) denote statistical differences between groups (p < 0.05).
Figure 8
Figure 8
Inflammatory and metabolic effects of TKIs that inhibit RIPK2 in adipocytes and macrophages. RIPK2 is required for increased inflammatory cytokine production and lipolysis induced by bacterial peptidoglycan that acts on NOD1. Certain tyrosine kinase inhibitors (TKIs) inhibit RIPK2 in both macrophages and adipocytes thereby suppressing lipolysis, reducing inflammation and attenuating poor glucose control (dysglycemia) caused by bacterial cell wall components.

Similar articles

Cited by

References

    1. Wu P, Nielsen TE, Clausen MH. FDA-approved small-molecule kinase inhibitors. Trends Pharmacol. Sci. 2015;36:422–439. doi: 10.1016/j.tips.2015.04.005. - DOI - PubMed
    1. Brooks MB. Erlotinib appears to produce prolonged remission of insulin-requiring type 2 diabetes associated with metabolic syndrome and chronic kidney disease. Br. J. Diabetes Vasc. Dis. 2012;12:87–90. doi: 10.1177/1474651412442694. - DOI
    1. Agostino NM, et al. Effect of the tyrosine kinase inhibitors (sunitinib, sorafenib, dasatinib, and imatinib) on blood glucose levels in diabetic and nondiabetic patients in general clinical practice. J. Oncol. Pharm. Pract. 2011;17:197–202. doi: 10.1177/1078155210378913. - DOI - PubMed
    1. Breccia M, et al. Fasting glucose improvement under dasatinib treatment in an accelerated phase chronic myeloid leukemia patient unresponsive to imatinib and nilotinib. Leuk. Res. 2008;32:1626–8. doi: 10.1016/j.leukres.2008.01.015. - DOI - PubMed
    1. Breccia M, Muscaritoli M, Aversa Z, Mandelli F, Alimena G. Imatinib mesylate may improve fasting blood glucose in Ph+ Chronic Myelogenous Leukemia patients responsive to treatment. J. Clin. Oncol. 2004;22:4653–4654. doi: 10.1200/JCO.2004.04.217. - DOI - PubMed

Publication types

MeSH terms