. 2017 May 8;7(1):1541.
doi: 10.1038/s41598-017-01784-3.

Measuring nanoscale viscoelastic parameters of cells directly from AFM force-displacement curves

Affiliations

Measuring nanoscale viscoelastic parameters of cells directly from AFM force-displacement curves

Yuri M Efremov et al. Sci Rep. .

Abstract

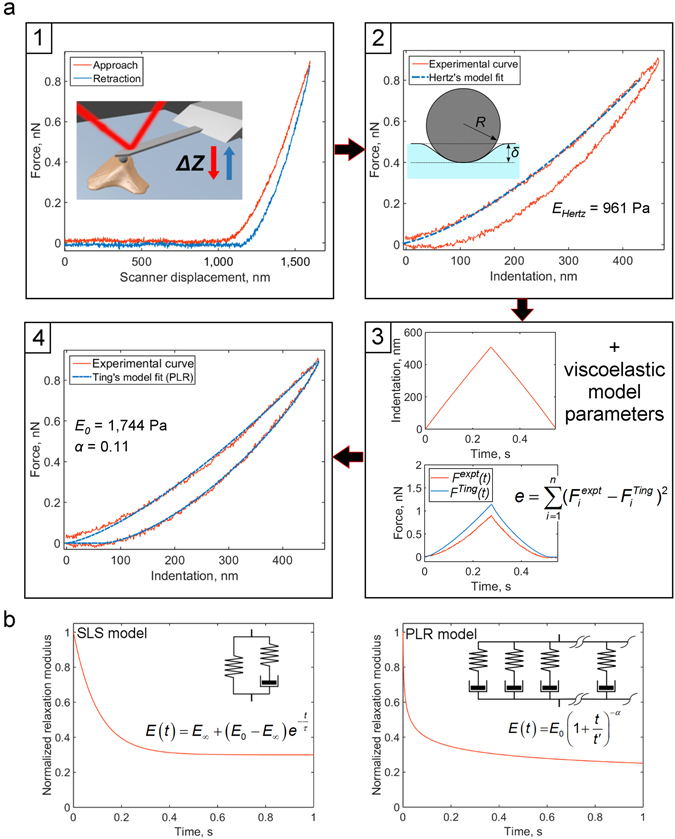
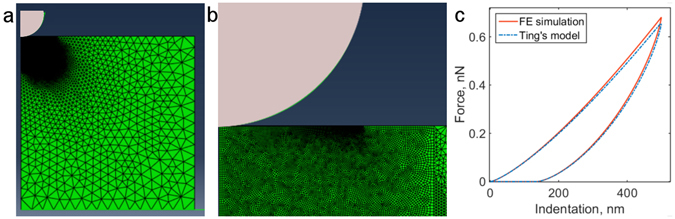
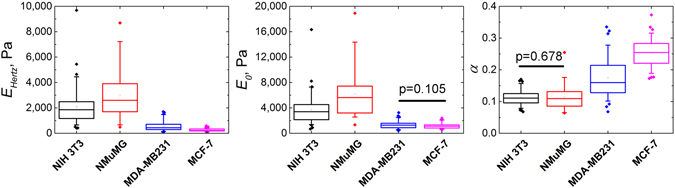
Force-displacement (F-Z) curves are the most commonly used Atomic Force Microscopy (AFM) mode to measure the local, nanoscale elastic properties of soft materials like living cells. Yet a theoretical framework has been lacking that allows the post-processing of F-Z data to extract their viscoelastic constitutive parameters. Here, we propose a new method to extract nanoscale viscoelastic properties of soft samples like living cells and hydrogels directly from conventional AFM F-Z experiments, thereby creating a common platform for the analysis of cell elastic and viscoelastic properties with arbitrary linear constitutive relations. The method based on the elastic-viscoelastic correspondence principle was validated using finite element (FE) simulations and by comparison with the existed AFM techniques on living cells and hydrogels. The method also allows a discrimination of which viscoelastic relaxation model, for example, standard linear solid (SLS) or power-law rheology (PLR), best suits the experimental data. The method was used to extract the viscoelastic properties of benign and cancerous cell lines (NIH 3T3 fibroblasts, NMuMG epithelial, MDA-MB-231 and MCF-7 breast cancer cells). Finally, we studied the changes in viscoelastic properties related to tumorigenesis including TGF-β induced epithelial-to-mesenchymal transition on NMuMG cells and Syk expression induced phenotype changes in MDA-MB-231 cells.


Conflict of interest statement

The authors declare that they have no competing interests.

Figures

Figure 1
Figure 1
Flowchart of the method and used viscoelastic models. (a) The flowchart. At the first step, a force-displacement curve obtained with a standard indentation protocol is pre-processed to determine zero force level and corrected for hydrodynamic drag (if needed). At the second step, the contact point is located and F-Z curve is transformed to the force-indentation coordinates. Apparent Young’s modulus E Hertz is calculated with the Hertz’s model. Inset: scheme of a spherical probe indenting a half-space. At the third step, the indentation time history is used to model the force curve with the Ting’s model and prescribed viscoelastic model. The difference between the modelled and experimental force curves (e) is minimized with the fitting algorithm. Viscoelastic parameters providing the lowest e value are acquired as the output. At the final step, contact point position could be adjusted and the step 3 repeated to obtain the best fit. Details of the processing are given in the text. (b) Normalized relaxation modulus (E/E 0) for standard linear solid (SLS) and power-law rheology (PLR) relaxation models. Insets: schematic spring-dashpot representation and equation for the relaxation modulus. The SLS model is a spring in parallel with a spring-dashpot combination, leading to an exponential relaxation with a single relaxation time τ. The PLR model can be imagined as an infinite number of spring-dashpot combinations in parallel, leading to a continuous relaxation spectrum and power-law decay (α is the power law exponent).
Figure 2
Figure 2
Validation of the developed algorithms with FE simulations. (a) Axisymmetric FE model, consisting of the rigid spherical indenter with 2 μm radius and viscoelastic sample with 15 μm height and radius. (b) Magnified view of the contact area, there the sample was meshed more finely. (c) Result of FE simulation and the F-δ curve modelled using Ting’s model with the same input parameters (SLS model with E 0 = 2 kPa, E  = 1 kPa, and τ = 0.1 s).
Figure 3
Figure 3
Comparison of SLS and PLR models in experiments with PAAm hydrogels and NIH 3T3 fibroblasts. (a) Experimental F-δ curve obtained on a fibroblast with both PLR and SLS model fits. (b) Normalized relaxation functions for PRL and SLS models with adjusted parameters on a logarithmic scale, inset – same functions on a linear scale. (c,d) Modelled F-δ curves with different indentation times. Left – SLS (τ = 0.1 s), right – PLR (α = 0.15). (e,f) Experimental F-δ curves obtained on PAAm hydrogel (left) and fibroblast (right) with different indentation times. The offset is added to the force for clarity. Black lines are SLS (e) or PLR (f) model fits. (g,h) Viscoelastic parameters α and τ for PAAm hydrogels (left, combined data for experiments on 3 gels, mean ± s.d.) and NIH 3T3 fibroblasts (right, combined data for experiments on 12 cells, mean ± s.d.) as a function of piezo displacement speed.
Figure 4
Figure 4
Force curves obtained on different cell lines: NIH 3T3, NMuMG, MDA-MB-231, MCF-7. The fit with PLR model; E Hertz, short-term modulus E 0 and power-law exponent α values are shown.
Figure 5
Figure 5
Viscoelastic parameters of studied cell lines. Box plots of apparent Young’s modulus E Hertz, short-term modulus E 0 and power-law exponent α. Difference between all distribution except those marked is significant at the p < 0.01 level. All cell lines were at 60–80% confluence during the experiment.

References

    1. Lekka M, et al. Cancer cell recognition–Mechanical phenotype. Micron. 2012;43:1259–1266. doi: 10.1016/j.micron.2012.01.019. - DOI - PubMed
    1. Rother J, Nöding H, Mey I, Janshoff A. Atomic force microscopy-based microrheology reveals significant differences in the viscoelastic response between malign and benign cell lines. Open Biol. 2014;4:140046. doi: 10.1098/rsob.140046. - DOI - PMC - PubMed
    1. van Zwieten RW, et al. Assessing dystrophies and other muscle diseases at the nanometer scale by atomic force microscopy. Nanomedicine. 2014;9:393–406. doi: 10.2217/nnm.12.215. - DOI - PubMed
    1. Darling EM, Topel M, Zauscher S, Vail TP, Guilak F. Viscoelastic properties of human mesenchymally-derived stem cells and primary osteoblasts, chondrocytes, and adipocytes. J. Biomech. 2008;41:454–464. doi: 10.1016/j.jbiomech.2007.06.019. - DOI - PMC - PubMed
    1. Hochmuth RM. Micropipette aspiration of living cells. J. Biomech. 2000;33:15–22. doi: 10.1016/S0021-9290(99)00175-X. - DOI - PubMed

Publication types

LinkOut - more resources