

A physical description of the adhesion and aggregation of platelets
- PMID: 28484643
- PMCID: PMC5414280
- DOI: 10.1098/rsos.170219
A physical description of the adhesion and aggregation of platelets
Abstract
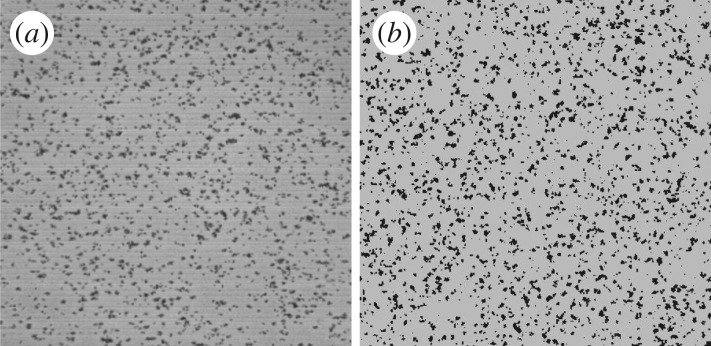
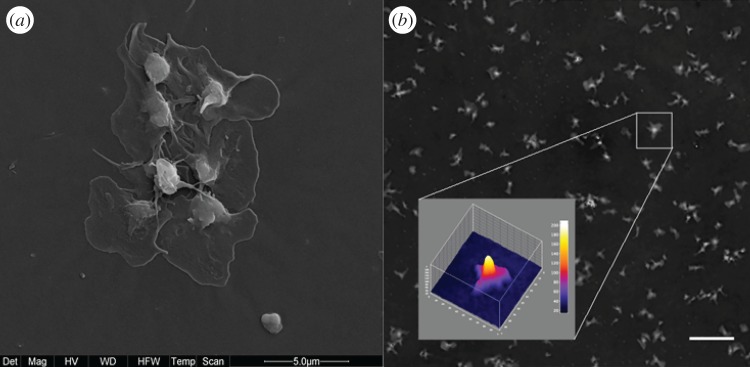
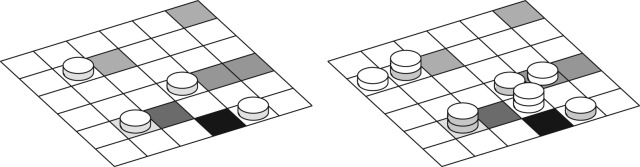
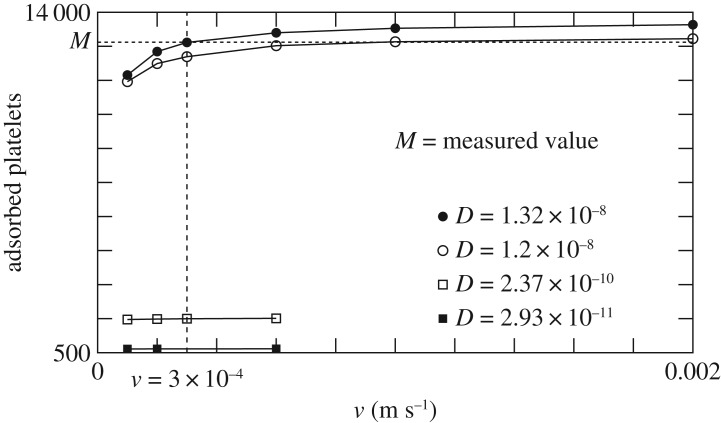
The early stages of clot formation in blood vessels involve platelet adhesion-aggregation. Although these mechanisms have been extensively studied, gaps in their understanding still persist. We have performed detailed in vitro experiments, using the well-known Impact-R device, and developed a numerical model to better describe and understand this phenomenon. Unlike previous studies, we took into account the differential role of pre-activated and non-activated platelets, as well as the three-dimensional nature of the aggregation process. Our investigation reveals that blood albumin is a major parameter limiting platelet aggregate formation in our experiment. Simulations are in very good agreement with observations and provide quantitative estimates of the adhesion and aggregation rates that are hard to measure experimentally. They also provide a value of the effective diffusion of platelets in blood subject to the shear rate produced by the Impact-R.
Keywords: adhesion and aggregation rates; mathematical model; platelet deposition; shear-induced diffusion; whole blood in vitro experiments.
Conflict of interest statement
We declare we have no competing interests.
Figures
References
-
- Franco A, Corken A, Ware J. 2015. Platelets at the interface of thrombosis, inflammation, and cancer. Blood 126, 582–588. (doi:10.1182/blood-2014-08-531582) - DOI - PMC - PubMed
-
- Barr JD, Chauhan AK, Schaeffer GV, Hansen JK, Motto DG. 2013. Red blood cells mediate the onset of thrombosis in the ferric chloride murine model. Blood 121, 3733–3741. (doi:10.1182/blood-2012-11-468983) - DOI - PMC - PubMed
-
- McCarty OJT. et al. 2005. Rac1 is essential for platelet lamellipodia formation and aggregate stability under flow. J. Biol. Chem. 280, 39474–39484. (doi:10.1074/jbc.M504672200) - DOI - PMC - PubMed
-
- Patel S. et al. 2012. The cell motility modulator Slit2 is a potent inhibitor of platelet function. Circulation 126, 1385–1395. (doi:10.1161/CIRCULATIONAHA.112.105452) - DOI - PubMed
-
- Fogelson A, Neeves K. 2015. Fluid mechanics of blood clot formation. Annu. Rev. Fluid. Mech. 47, 377–403. (doi:10.1146/annurev-fluid-010814-014513) - DOI - PMC - PubMed
Associated data
LinkOut - more resources
Full Text Sources
Other Literature Sources