. 2017 Apr 21:4:48.
doi: 10.3389/fvets.2017.00048. eCollection 2017.

Expression Dynamics of Innate Immunity in Influenza Virus-Infected Swine

Affiliations

Expression Dynamics of Innate Immunity in Influenza Virus-Infected Swine

María Montoya et al. Front Vet Sci. .

Abstract

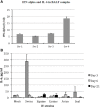
The current circulating swine influenza virus (IV) subtypes in Europe (H1N1, H1N2, and H3N2) are associated with clinical outbreaks of disease. However, we showed that pigs could be susceptible to other IV strains that are able to cross the species barrier. In this work, we extended our investigations into whether different IV strains able to cross the species barrier might give rise to different innate immune responses that could be associated with pathological lesions. For this purpose, we used the same samples collected in a previous study of ours, in which healthy pigs had been infected with a H3N2 Swine IV and four different H3N8 IV strains circulating in different animal species. Pigs had been clinically inspected and four subjects/group were sacrificed at 3, 6, and 21 days post infection. In the present study, all groups but mock exhibited antibody responses to IV nucleoprotein protein. Pulmonary lesions and high-titered viral replication were observed in pigs infected with the swine-adapted virus. Interestingly, pigs infected with avian and seal H3N8 strains also showed moderate lesions and viral replication, whereas equine and canine IVs did not cause overt pathological signs, and replication was barely detectable. Swine IV infection induced interferon (IFN)-alpha and interleukin-6 responses in bronchoalveolar fluids (BALF) at day 3 post infection, as opposed to the other non-swine-adapted virus strains. However, IFN-alpha responses to the swine-adapted virus were not associated with an increase of the local, constitutive expression of IFN-alpha genes. Remarkably, the Equine strain gave rise to a Serum Amyloid A response in BALF despite little if any replication. Each virus strain could be associated with expression of cytokine genes and/or proteins after infection. These responses were observed well beyond the period of virus replication, suggesting a prolonged homeostatic imbalance of the innate immune system.

Keywords: cytokines; influenza; innate immunity; pig; virus.


Figures

Figure 1
Figure 1
Histopathological analysis of lungs of pigs, at day 3 after infection with different IVs. (A) Negative control; (B) swine IV, moderate to severe inflammation of the bronchioli and surrounding alveoli (bronchointerstitial pneumonia); (C) equine IV, no significant lesions; (D) canine IV, no significant lesions; (E) avian IV, moderate bronchointerstitial pneumonia; (F) seal IV, mild to moderate bronchointerstitial pneumonia.
Figure 2
Figure 2
Results obtained by RT real-time PCR for IV M gene on bronchoalveolar fluids samples collected from mock and IV-infected pigs. Positive samples are shown as cycle threshold number in real-time PCR. PCR-negative samples corresponded to Ct ≥ 40, and they are not shown in the graph. Two and four pigs were present in each mock and IV-infected group, respectively. Samples from day 3 p.i. are shown as gray bars and from day 6 p.i. as striped bars. All day 21 samples (black bars in the legend) were PCR-negative.
Figure 3
Figure 3
Antibody responses to different IV strains were investigated by means of a competition ELISA for the nucleoprotein antigen. The Y axis indicates the percentage of OD with respect to the control reaction without any serum (100%). The horizontal dashed line corresponds to the test threshold, i.e., 50% of the control OD value. Ab-positive sera show percentage values beneath the threshold. The X axis indicates the pigs under study at three sampling days p.i. (0, 6, 21). Mo, mock-infected; Sw, swine IV-infected; Eq, equine IV-infected; Ca, canine IV-infected; Av, avian IV-infected; Se, seal IV-infected. Samples from day 0 are shown as white bars, from day 6 p.i. as gray bars, and from day 21 p.i. as black bars.
Figure 4
Figure 4
(A) Interferon (IFN)-α was investigated in bronchoalveolar fluids (BALF) samples of Swine IV-infected pigs at day 3 p.i. by sandwich ELISA with monoclonal antibodies F17 and K9 to porcine IFN-α1. Results are shown in terms of Units/ml (mean + 1 SD) on the basis of a standard curve created with porcine recombinant IFN-α1. IFN-α titers <1 U/ml were the baseline in our assays. The BALF samples of mock and all other IV groups were always IFN α-negative at all the time points. (B) Interleukin (IL)-6 was measured in BALF samples by a bioassay on IL 6-dependent 7TD1 hybridoma cells. On the basis of both final number and viability of 7TD1 cells, IL-6 concentration was determined from a standard curve created with a reference preparation of human recombinant IL-6 (Pierce Endogen, Rockford, IL, USA). Results are shown in terms of group average +1 SEM. The IL-6 concentration in the swine group at day 3 p.i. is significantly different (one-way ANOVA, P < 0.05). Please notice that the result of the Seal group at day 3 p.i. was accounted for by an outlier and three non-responder pigs. Samples from day 3 p.i. are shown as gray bars, from day 6 p.i. as striped bars, and from day 21 p.i. as black bars.
Figure 5
Figure 5
RT real-time PCR for some cytokine genes was carried out on bronchoalveolar fluids cells collected at the indicated times after infection. For each sample, the relative expression of the selected genes was calculated using the formula ΔCt = Ct (target gene)—cycle threshold (Ct) (housekeeping), where Ct values were the mean of three test replicates. Results are shown as n-fold change in gene expression (2−ΔCt). The same superscripts (a, b, c) on the bar indicate significant differences (P < 0.05) in one-way ANOVA or Kruskal–Wallis test. Samples from day 3 p.i. are shown as gray bars, from day 6 p.i. as striped bars, and from day 21 p.i. as black bars.
Figure 6
Figure 6
Immunophenotyping of pig bronchoalveolar fluids (BALF) cells after mock and IV-infection. BALF cells of pigs were submitted to immunophenotyping at the indicated times after mock or IV infection. Results are expressed in terms of percent marker-positive cells out of 10,000. (A) Gating strategy for flow cytometry. Positive cells were considered as the percentage within the black circle in each plot as compared with each isotype control. (B) Percentage of CD3-positive T cells. (C) Percentage of CD172-CD4, double-positive cells. (D) Percentage of γδ T cells. Samples from day 3 p.i. are shown as gray bars, from day 6 p.i. as striped bars, and from day 21 p.i. as black bars.
Figure 6
Figure 6
Immunophenotyping of pig bronchoalveolar fluids (BALF) cells after mock and IV-infection. BALF cells of pigs were submitted to immunophenotyping at the indicated times after mock or IV infection. Results are expressed in terms of percent marker-positive cells out of 10,000. (A) Gating strategy for flow cytometry. Positive cells were considered as the percentage within the black circle in each plot as compared with each isotype control. (B) Percentage of CD3-positive T cells. (C) Percentage of CD172-CD4, double-positive cells. (D) Percentage of γδ T cells. Samples from day 3 p.i. are shown as gray bars, from day 6 p.i. as striped bars, and from day 21 p.i. as black bars.

Similar articles

Cited by

References

    1. Iwasaki A, Medzhitov R. Regulation of adaptive immunity by the innate immune system. Science (2010) 327:291–5.10.1126/science.1183021 - DOI - PMC - PubMed
    1. Stetson DB, Medzhitov R. Type I interferons in host defense. Immunity (2006) 25:373–81.10.1016/j.immuni.2006.08.007 - DOI - PubMed
    1. Tripathi S, White MR, Hartshorn KL. The amazing innate immune response to influenza A virus infection. Innate Immun (2013) 21:73–98.10.1177/1753425913508992 - DOI - PubMed
    1. Diebold SS, Kaisho T, Hemmi H, Akira S, Reis e Sousa C. Innate antiviral responses by means of TLR7-mediated recognition of single-stranded RNA. Science (2004) 303:1529–31.10.1126/science.1093616 - DOI - PubMed
    1. Van Reeth K, Van Gucht S, Pensaert M. Correlations between lung proinflammatory cytokine levels, virus replication, and disease after swine influenza virus challenge of vaccination-immune pigs. Viral Immunol (2002) 15:583–94.10.1089/088282402320914520 - DOI - PubMed

LinkOut - more resources