

Asymmetric Patterns of Small Molecule Transport After Nanosecond and Microsecond Electropermeabilization
- PMID: 28484798
- PMCID: PMC5910485
- DOI: 10.1007/s00232-017-9962-1
Asymmetric Patterns of Small Molecule Transport After Nanosecond and Microsecond Electropermeabilization
Abstract
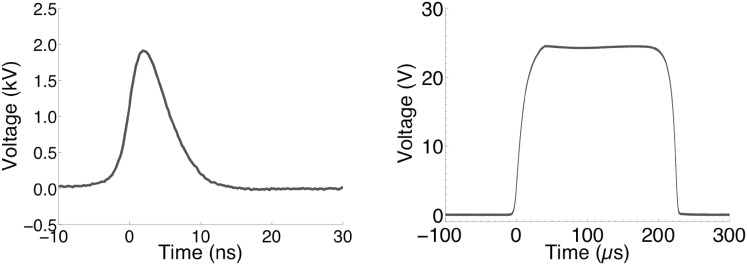
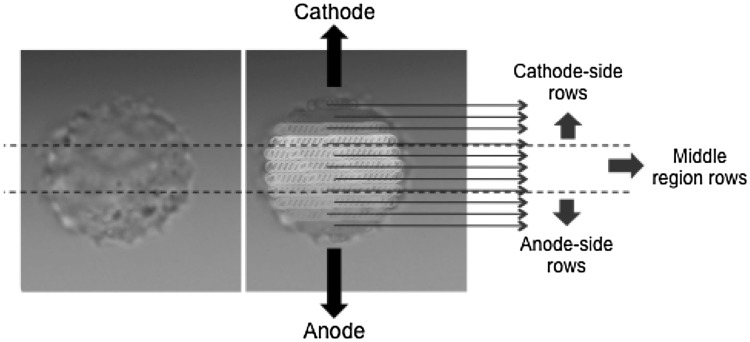
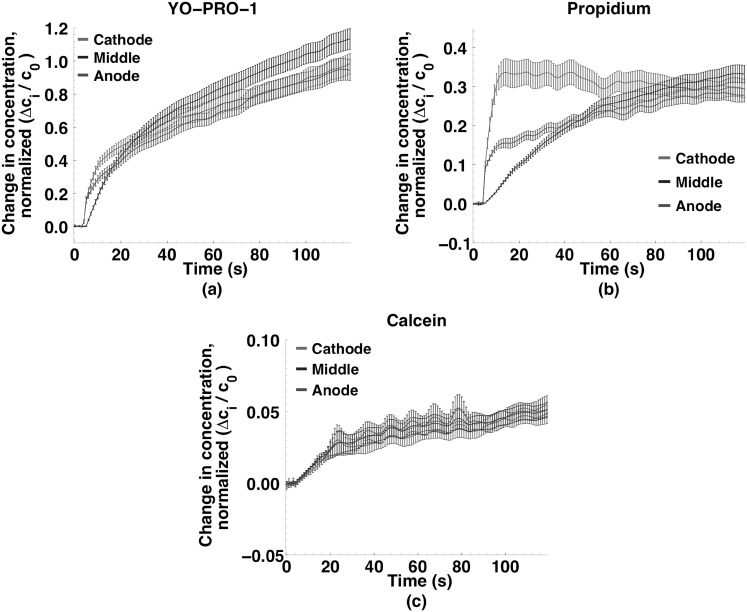
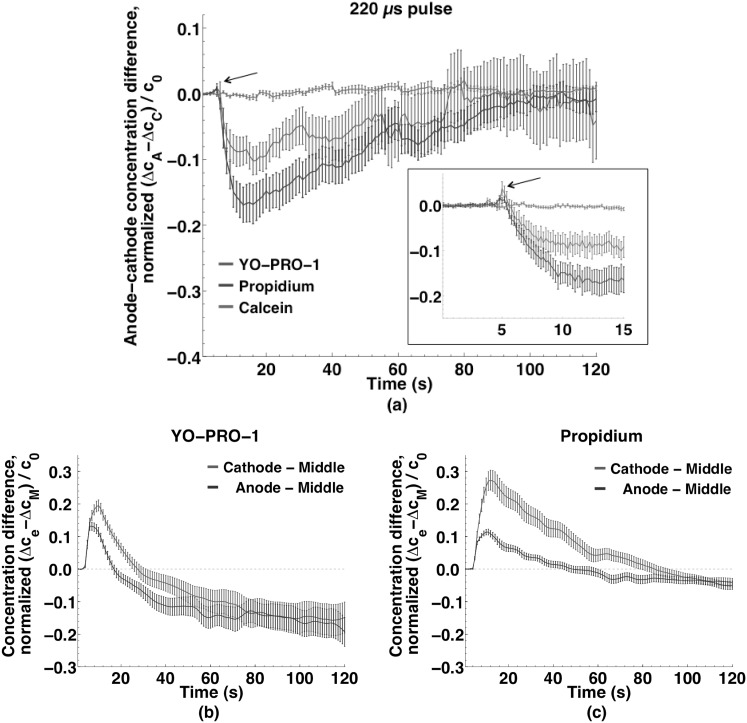
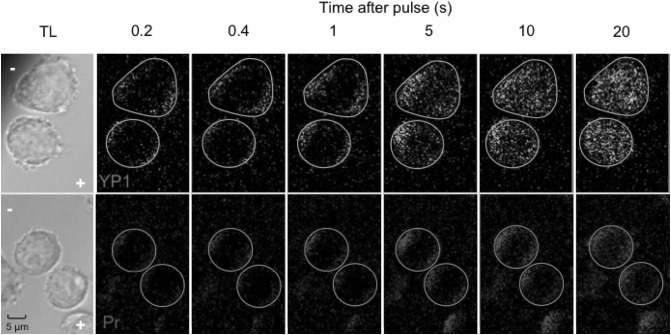
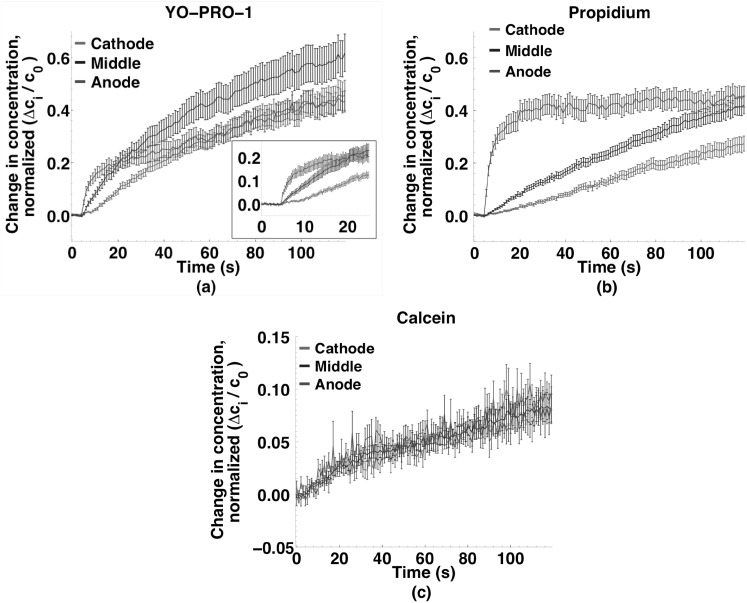
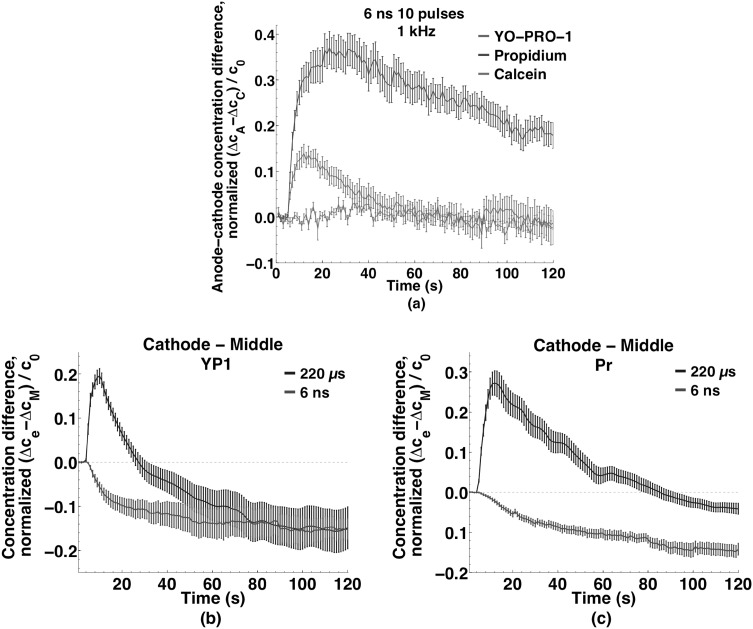
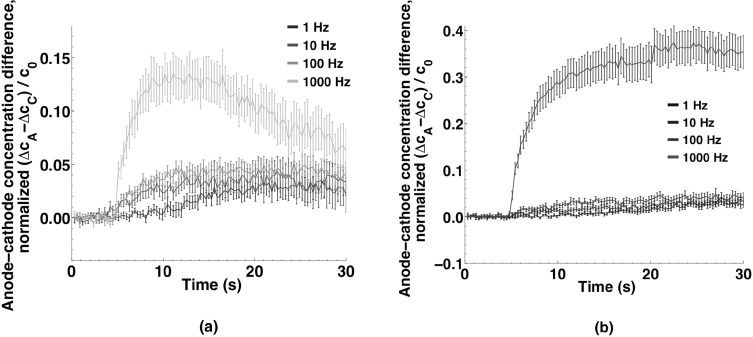
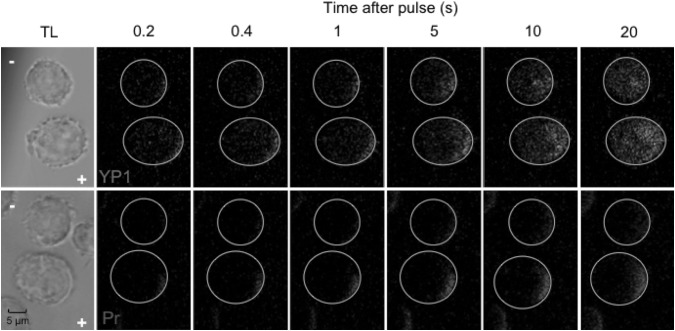
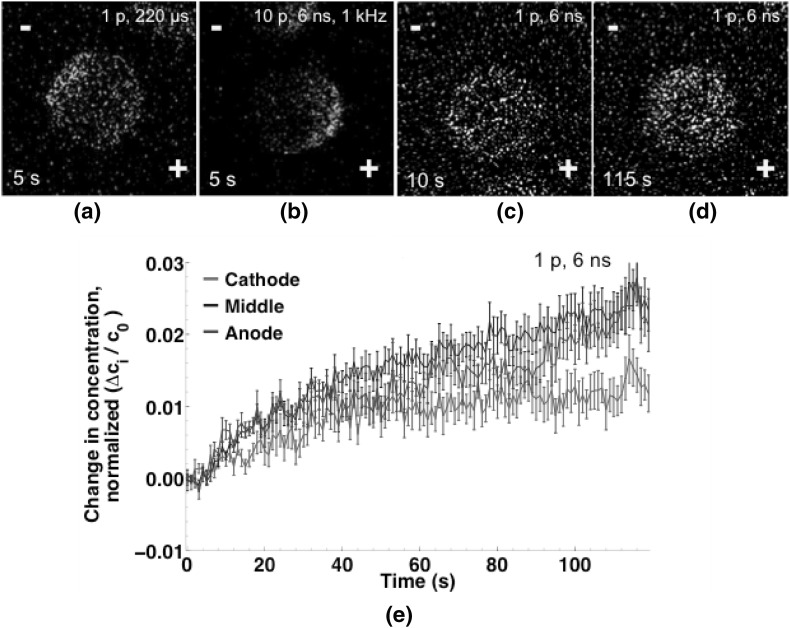
Imaging of fluorescent small molecule transport into electropermeabilized cells reveals polarized patterns of entry, which must reflect in some way the mechanisms of the migration of these molecules across the compromised membrane barrier. In some reports, transport occurs primarily across the areas of the membrane nearest the positive electrode (anode), but in others cathode-facing entry dominates. Here we compare YO-PRO-1, propidium, and calcein uptake into U-937 cells after nanosecond (6 ns) and microsecond (220 µs) electric pulse exposures. Each of the three dyes exhibits a different pattern. Calcein shows no preference for anode- or cathode-facing entry that is detectable with our measurement system. Immediately after a microsecond pulse, YO-PRO-1 and propidium enter the cell roughly equally from the positive and negative poles, but transport through the cathode-facing side dominates in less than 1 s. After nanosecond pulse permeabilization, YO-PRO-1 and propidium enter primarily on the anode-facing side of the cell.
Keywords: Asymmetric molecular transport pattern; Electroporation; Nanosecond electropermeabilization.
Conflict of interest statement
The authors declare that they have no conflict of interest.
Figures
Similar articles
-
Nanoelectropulse-driven membrane perturbation and small molecule permeabilization.BMC Cell Biol. 2006 Oct 19;7:37. doi: 10.1186/1471-2121-7-37. BMC Cell Biol. 2006. PMID: 17052354 Free PMC article.
-
Quantitative Limits on Small Molecule Transport via the Electropermeome - Measuring and Modeling Single Nanosecond Perturbations.Sci Rep. 2017 Mar 3;7(1):57. doi: 10.1038/s41598-017-00092-0. Sci Rep. 2017. PMID: 28246401 Free PMC article.
-
Electropermeabilization of cells by closely spaced paired nanosecond-range pulses.Bioelectrochemistry. 2018 Jun;121:135-141. doi: 10.1016/j.bioelechem.2018.01.013. Epub 2018 Jan 31. Bioelectrochemistry. 2018. PMID: 29413863 Free PMC article.
-
Mechanism by which electroporation mediates DNA migration and entry into cells and targeted tissues.Methods Mol Biol. 2008;423:19-33. doi: 10.1007/978-1-59745-194-9_2. Methods Mol Biol. 2008. PMID: 18370188 Review.
-
New insights in the visualization of membrane permeabilization and DNA/membrane interaction of cells submitted to electric pulses.Biochim Biophys Acta. 2005 Aug 5;1724(3):248-54. doi: 10.1016/j.bbagen.2005.04.005. Epub 2005 Apr 21. Biochim Biophys Acta. 2005. PMID: 15878640 Review.
Cited by
-
Enhanced Drug Uptake on Application of Electroporation in a Single-Cell Model.J Membr Biol. 2023 Jun;256(3):243-255. doi: 10.1007/s00232-023-00283-z. Epub 2023 Mar 29. J Membr Biol. 2023. PMID: 36988647
-
Dye Transport through Bilayers Agrees with Lipid Electropore Molecular Dynamics.Biophys J. 2020 Nov 3;119(9):1724-1734. doi: 10.1016/j.bpj.2020.09.028. Epub 2020 Oct 2. Biophys J. 2020. PMID: 33096018 Free PMC article.
-
Cytotoxicity of a Cell Culture Medium Treated with a High-Voltage Pulse Using Stainless Steel Electrodes and the Role of Iron Ions.Membranes (Basel). 2022 Feb 4;12(2):184. doi: 10.3390/membranes12020184. Membranes (Basel). 2022. PMID: 35207105 Free PMC article.
-
Pulsed Electric Field (PEF) Treatment Results in Growth Promotion, Main Flavonoids Extraction, and Phytochemical Profile Modulation of Scutellaria baicalensis Georgi Roots.Int J Mol Sci. 2024 Dec 26;26(1):100. doi: 10.3390/ijms26010100. Int J Mol Sci. 2024. PMID: 39795960 Free PMC article.
-
Pulse Duration Dependent Asymmetry in Molecular Transmembrane Transport Due to Electroporation in H9c2 Rat Cardiac Myoblast Cells In Vitro.Molecules. 2021 Oct 30;26(21):6571. doi: 10.3390/molecules26216571. Molecules. 2021. PMID: 34770979 Free PMC article.
References
-
- Benov LC, Antonov PA, Ribarov SR. Oxidative damage of the membrane lipids after electroporation. Gen Physiol Biophys. 1994;13:85. - PubMed
Publication types
MeSH terms
Substances
Grants and funding
LinkOut - more resources
Full Text Sources
Other Literature Sources
Miscellaneous
