. 2017 May 9:8:15068.
doi: 10.1038/ncomms15068.

Foxp3+ regulatory T cells maintain the bone marrow microenvironment for B cell lymphopoiesis

Affiliations

Foxp3+ regulatory T cells maintain the bone marrow microenvironment for B cell lymphopoiesis

Antonio Pierini et al. Nat Commun. .

Abstract

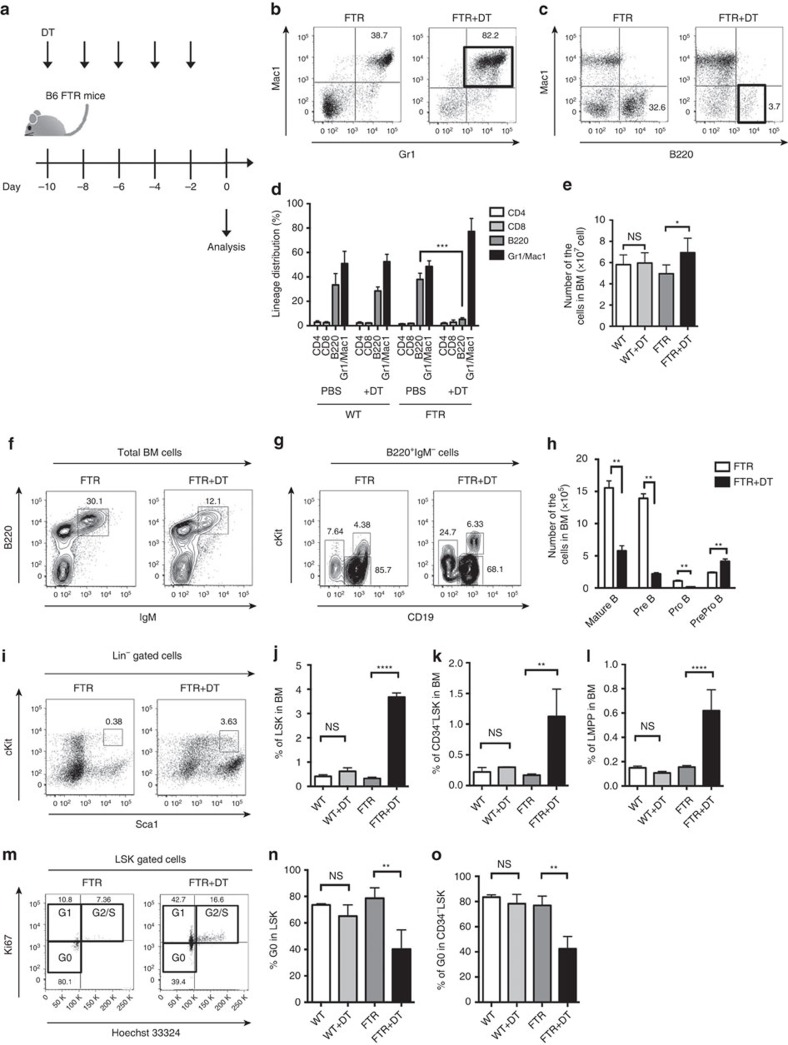
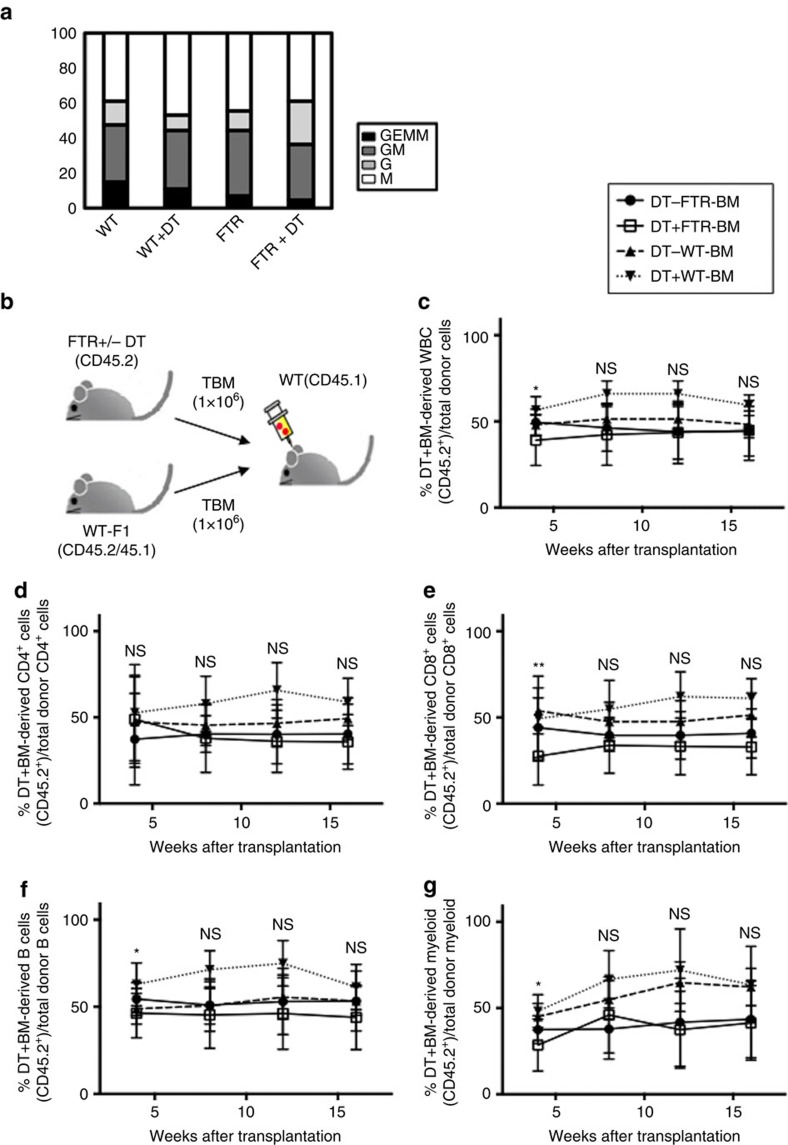
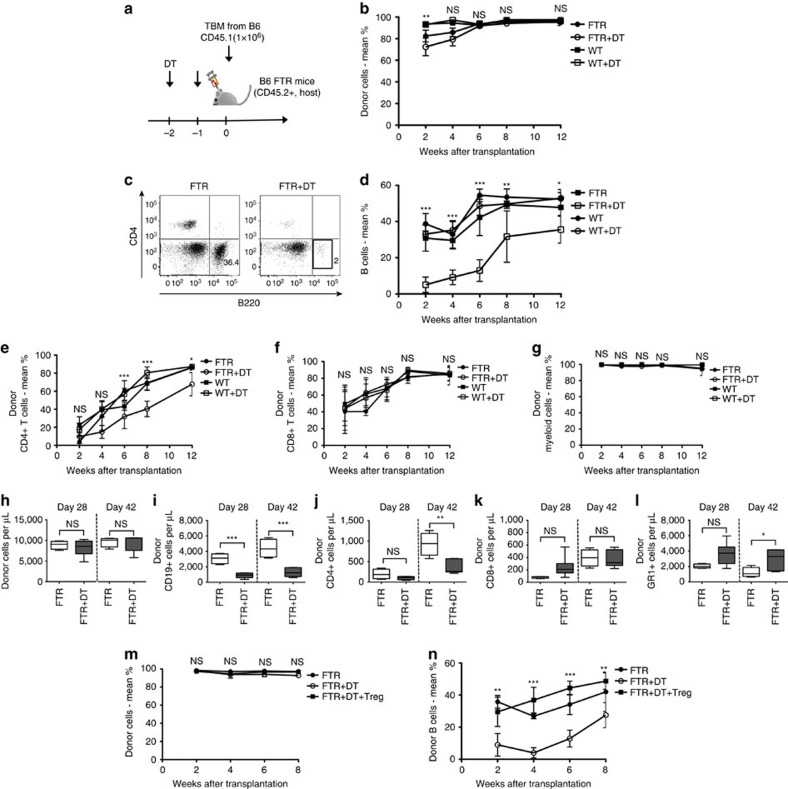
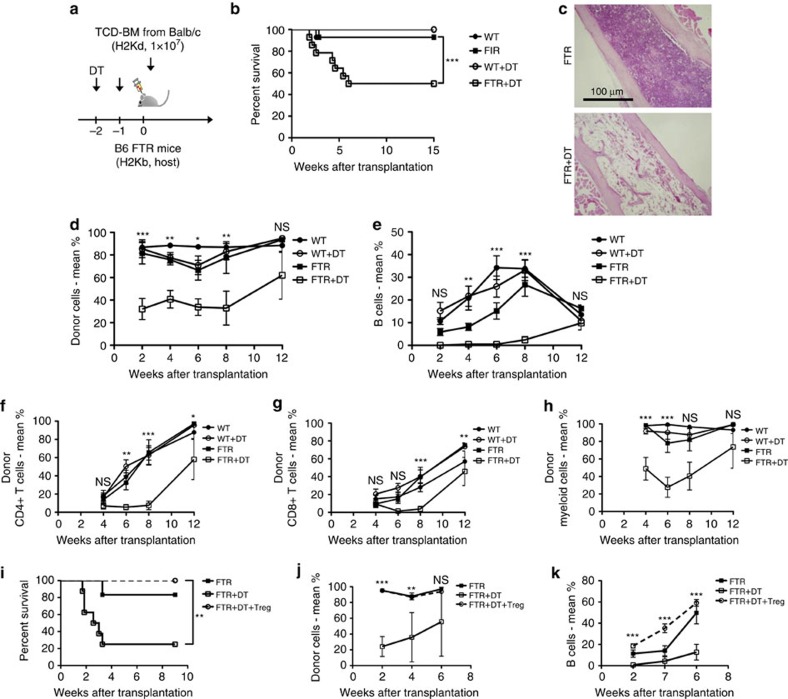
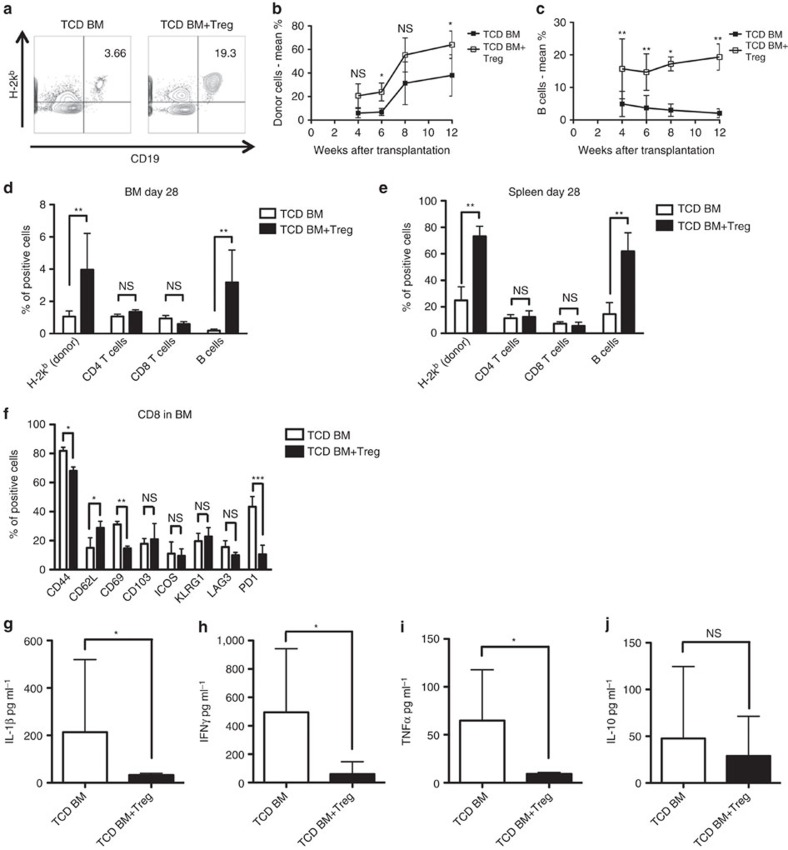
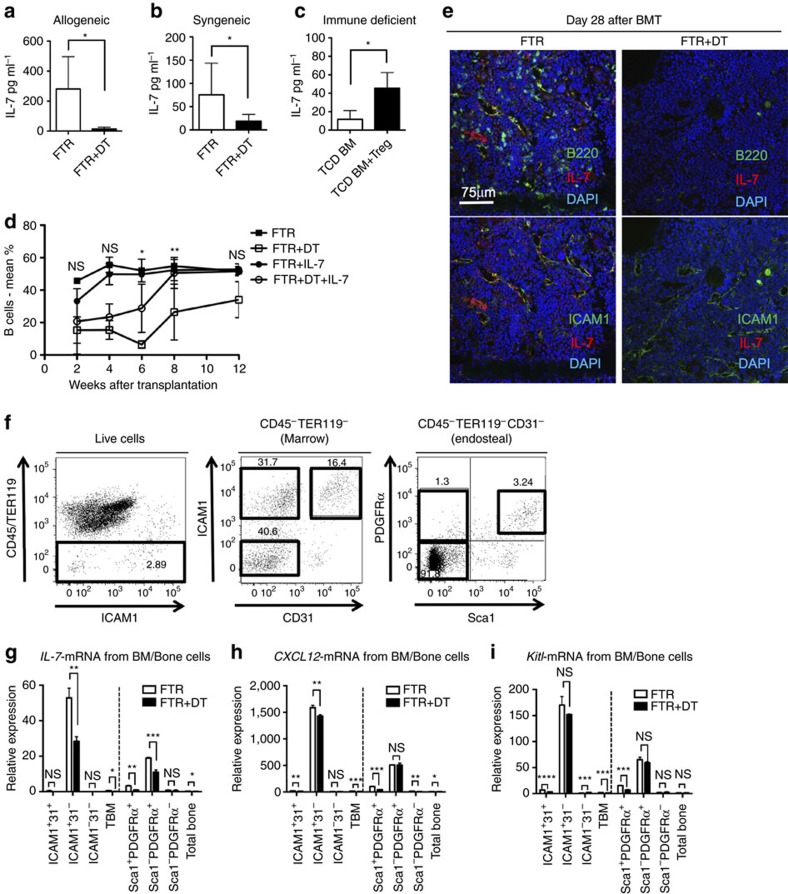
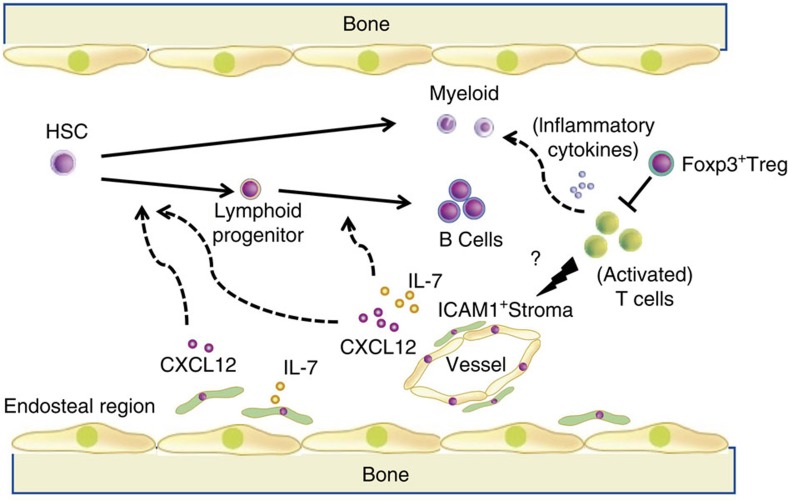
Foxp3+ regulatory T cells (Treg cells) modulate the immune system and maintain self-tolerance, but whether they affect haematopoiesis or haematopoietic stem cell (HSC)-mediated reconstitution after transplantation is unclear. Here we show that B-cell lymphopoiesis is impaired in Treg-depleted mice, yet this reduced B-cell lymphopoiesis is rescued by adoptive transfer of affected HSCs or bone marrow cells into Treg-competent recipients. B-cell reconstitution is abrogated in both syngeneic and allogeneic transplantation using Treg-depleted mice as recipients. Treg cells can control physiological IL-7 production that is indispensable for normal B-cell lymphopoiesis and is mainly sustained by a subpopulation of ICAM1+ perivascular stromal cells. Our study demonstrates that Treg cells are important for B-cell differentiation from HSCs by maintaining immunological homoeostasis in the bone marrow microenvironment, both in physiological conditions and after bone marrow transplantation.


Conflict of interest statement

The authors declare no competing financial interests.

Figures

Figure 1
Figure 1. Treg depletion impairs B-cell differentiation in BM.
(a) Experimental scheme. (b,c) The gating strategy and representative FACS data of total BM cells from FTR mice with or without DT treatment. Note that the frequencies of Gr1+Mac1+ cells were significantly increased in DT-treated FTR mice (b) and B220+ cells were decreased (c). (d) Frequencies of CD4+ T cells, CD8+ T cells, B220+ B cells and Gr1+Mac1+ cells in BM from WT/FTR mice with or without DT treatment (n=4). Data are shown as mean±s.d. (e) Absolute number of total BM cells in WT/FTR mice with or without DT treatment. ***P<0.001, Student's t-test. Data are shown as means±s.d. (f,g) Representative results of B-cell progenitor analysis in BM from FTR mice with or without DT treatment. Typical plots of IgM+B220+ mature B cells (f), IgMB220+CD19+cKit Pre-B cells, and IgMB220+CD19+cKit+ Pro-B cells are shown (g). (h) The graph shows the total number of B-cell progenitors in BM derived from the FTR mice with or without DT treatment (n=5, **P<0.01, Student's t-test). Data are shown as means±s.d. (i) Representative results of HSC analysis in BM from FTR mice with or without DT treatment. Note the significant increase of LSK population and CD34LSK population in FTR mice with DT treatment. (jl), Frequencies of LSK (j), HSC (CD34LSK; (k)), and LMPP (Flt3+LSK; (l)) in BM (n=4 in each group, **P<0.01, ****P<0.0001, Student's t-test) are also shown. Data are shown as means±s.d. (mo) The cell cycle status in HSCs derived from FTR mice with or without DT treatment is reported. Representative dot plot data (m), frequencies of G0 state in LSK (n) and in CD34LSK (o) are shown (n=4 in total, **P<0.01, Student's t-test). Data are shown as means±s.d.
Figure 2
Figure 2. Normal BM environment rescues B cell defect.
(a) Results of methylcellulose colony assay using total BM cells from Treg-depleted or not FTR mice are shown. Colony distribution is reported. GEMM; granulocyte, erythrocyte, macrophage, GM; granulocyte, monocytes, G; granulocyte, M macrophage. Pooled data from three consecutive experiments are shown. (b) Experimental scheme of competitive repopulation assay using 1 × 10⁶ total BM cells from FTR mice (CD45.2) with or without DT treatment. As competitor cells, the same number of total BM cells from WT-F1 B6 mice (CD45.1/CD45.2) was co-injected into lethally irradiated CD45.1 B6 mice. (cg) The frequencies of CD45+ (c), CD4+ T cells (d), CD8+ T cells (e), B220+ B cells (f), Gr1+Mac1+ granulocytes (g) derived from FTR mice at 4, 8, 12, 16 weeks after transplant are reported. ns=not significant, DT-FTR-BM versus DT+FTR-BM on 4 weeks after transplant in (c), (f), (g); *P<0.05, Student's t-test, DT-FTR-BM versus DT+FTR-BM on 4 weeks after transplant in (e). **P<0.01, Student's t-test. Data are shown as means±s.d.
Figure 3
Figure 3. Host-Treg depletion delays donor B cell reconstitution.
(a) Experimental scheme: FTR mice (CD45.2) with or without DT treatment on Day -2 and -1 were lethally irradiated and transplanted with 1 × 10⁶ total BM cells from congenic CD45.1+ B6 mice. (b) Graph of PB donor chimerism of total CD45+ cells over time after transplantation of DT-treated and untreated FTR mice. (c) Representative data of CD4+ T cells and B220+ B cells in PB at day 28 after transplantation from Treg-depleted (right) or not (left) mice. (d) PB donor B cell percentage over time after transplantation of DT-treated and untreated FTR mice. (eg). PB donor chimerism of (e) CD4+ T cells, (f) CD8+ T cells, and (g) myeloid cells over time after transplantation of DT-treated and untreated FTR mice. (hl). Absolute number at day 28 and day 42 after transplantation of (h) total CD45+ cells, (i) B cells, (j) CD4+ T cells, (k) CD8+ T cells and (l) myeloid cells. (m,n) Total CD45+ cell donor chimerism (m) and donor B cell percentage (n) in PB of untreated FTR mice, DT-treated FTR mice and DT-treated FTR mice that were rescue with Treg cells infusion at day 0 of transplantation are shown. ns=not significant, *P<0.05, **P<0.01, ***P<0.001, Student's t-test. Data are shown as means±s.d.
Figure 4
Figure 4. Allogeneic donor engraftment is impaired by host-Treg-depletion.
(a) Experimental scheme: B6 WT or B6 FTR (both H-2b) mice with or without DT treatment on day −2 and −1 were lethally irradiated and transplanted with 1 × 10⁷ TCD BM from allogeneic BALB/c (H-2d) mice. (b) Survival of transplanted mice. Comparisons have been made between DT-untreated and DT-treated B6 WT and B6 FTR mice. The graph shows the results of three-pooled consecutive experiments (***P<0.001, log-rank test). (c) Representative histological haematoxylin and eosin stained section of BM derived from allogeneic transplanted untreated or DT-treated FTR mice 4 weeks after transplantation. (d) PB donor chimerism of total CD45+ cells over time after transplantation of DT-treated and untreated B6 WT or B6 FTR mice. Statistical analysis of the differences between FTR and DT-treated FTR at different time points are shown. (e) PB donor B-cell percentage over time after transplantation of DT treated and untreated B6 WT or B6 FTR mice. Statistical analysis of the differences between FTR and DT-treated FTR at different time points are shown. (fh). PB donor chimerism of CD4+ T cells (f), CD8+ T cells (g), and Myeloid cells (h) over time after transplantation of DT-treated and untreated B6 WT or B6 FTR mice. Statistical analysis of the differences between FTR and DT-treated FTR at different time points are shown. Data are shown as means±s.d. ns=not significant, *P<0.05, **P<0.01, ***P<0.001, Student's t-test. (i) Survival of transplanted mice when host-Treg cells have been adoptively transferred to rescue donor BM engraftment. Comparisons have been made between DT-untreated FTR mice, DT-treated FTR mice and DT-treated FTR mice that received host-Treg cells infusion at day 0 of transplantation. Data reported is the results of two-pooled consecutive experiments. **P<0.01, log-rank test. (j,k) Total CD45+ cell donor chimerism (j) and donor B-cell percentage (k) in PB of untreated FTR mice, DT-treated FTR mice and DT-treated FTR mice that were rescue with host-Treg cells infusion at day 0 of transplantation are shown. Statistical analysis of the differences between DT-treated FTR and DT-treated FTR rescued with host-Treg cells at different time points are shown. Data are shown as means±s.d. ns=not significant, *P<0.05, **P<0.01, ***P<0.001, Student's t-test.
Figure 5
Figure 5. Host-Treg cells adoptive transfer promotes B-cell reconstitution.
Immune-deficient BALB/c-rag2−/−γc−/− (H-2d) mice were transplanted with 1 × 10⁶ TCD BM from allogeneic B6 (H-2b) mice and were treated with host-Treg cells at day 0 of transplantation. (a) Donor H-2kb+CD19+ B cells in PB of transplanted BALB/c-rag2−/−γc−/− mice in the absence (left) or presence (right) of host-Treg cells treatment. (b,c) PB donor chimerism of total CD45+ cells (b) and donor B-cell percentage (c) over time after transplantation of Treg cells-treated and untreated BALB/c-rag2−/−γc−/− mice. Data are shown as means±s.d. ns=not significant, *P<0.05, **P<0.01, Student's t-test. (d,e) Frequencies of total donor cells, donor CD4+ T cells, donor CD8+ T cells and donor B cells in the BM (d) and in the spleen (e) of transplanted mice at day 28 after transplantation (n=5 in each group). Data are shown as means±s.d. ns=not significant, **P<0.01, Student's t-test. (f) Frequencies of CD44, CD62L, CD69, CD103, ICOS, KLRG1, LAG3 and PD1 expressions on donor CD8+ T cells in the BM of transplanted mice at day 8 after transplantation (n=5 in each group). Data are shown as means±s.d. ns=not significant, *P<0.05, **P<0.01, ***P<0.001, Student's t-test. (gj). Serum concentrations of different cytokines in transplanted BALB/c-rag2−/−γc−/− mice that received or not host-Treg cells adoptive transfer. Data are shown as means±s.d. ns=not significant, *P<0.05, Student's t-test.
Figure 6
Figure 6. Treg-depletion reduces IL-7 production from ICAM1+ stroma.
(ac) Graphs show IL-7 concentrations in the serum of Treg-depleted mice after syngeneic transplant (a), after allogeneic transplant (b), and in allogeneic transplanted BALB/c-rag2−/−γc−/− mice (c) that received or not host-Treg cells adoptive transfer (n=5 per group). Data are shown as means±s.d. *P<0.05, Student's t-test. (d) Donor B-cell percentage in PB of untreated or DT-treated FTR mice that received intraperitoneal administration of low-doses of IL-7. Statistical analysis of the differences between DT-treated FTR that received IL-7 and DT-treated FTR alone at different time points are shown. Representative data from one of three experiments is shown. Data are shown as means±s.d. ns=not significant, *P<0.05, **P<0.01, Student's t-test. (e). Representative results of immunostaining using Treg-depleted FTR mice 28 days after syngeneic transplantation (right panels). The images of transplanted untreated FTR mice are also shown as control (left panels). Note that the frequencies of B220+ cells (upper panels) and IL-7+ cells (upper and lower panels) are severely decreased in Treg-depleted FTR mice. (f). Representative plot data of non-haematopoietic cells in BM from WT mice. Total BM cells were flushed out and digested with collagenase. Bone related cells were also isolated from bone-derived digested cells. After gating for CD45TER119 cells (left panel), digested marrow cells were gated for ICAM1 and CD31 expression (middle) and bone related cells were gated for Sca1 and PDGFRα expression (right). (gi). Quantitative RT-PCR data using non-haematopoietic cells from untreated or DT-treated FTR transplanted mice. il-7 mRNA (g), cxcl12 mRNA (h), and kitl mRNA (i) are shown (n=3 in each group). Data are shown as means±s.d. ns=not significant, *P<0.05, **P<0.01, ***P<0.001, Student's t-test.
Figure 7
Figure 7. Schematic model of the role of Treg cells in BM microenvironment.
Foxp3+ Treg cells in BM regulate the activation status of cytotoxic T cells and maintain the function of BM environment including ICAM1+perivascular cells. Activated T cells after Treg cells depletion could abrogate IL-7 secretion from ICAM1+ perivascular cells resulting in a defective B-cell differentiation from HSC.

References

    1. Kim J. M., Rasmussen J. P. & Rudensky A. Y. Regulatory T cells prevent catastrophic autoimmunity throughout the lifespan of mice. Nat. Immunol. 8, 191–197 (2007). - PubMed
    1. Sakaguchi S., Yamaguchi T., Nomura T. & Ono M. Regulatory T cells and immune tolerance. Cell 133, 775–787 (2008). - PubMed
    1. Edinger M. et al. CD4+CD25+ regulatory T cells preserve graft-versus-tumor activity while inhibiting graft-versus-host disease after bone marrow transplantation. Nat. Med. 9, 1144–1150 (2003). - PubMed
    1. Di Ianni M. et al. Tregs prevent GVHD and promote immune reconstitution in HLA-haploidentical transplantation. Blood 117, 3921–3928 (2011). - PubMed
    1. Pierini A., Alvarez M. & Negrin R. S. NK cell and CD4+FoxP3+ regulatory t cell based therapies for hematopoietic stem cell engraftment. Stem Cells Int. 2016, 9025835 (2016). - PMC - PubMed

Publication types

MeSH terms

Substances