. 2018 Jun;23(6):1496-1505.
doi: 10.1038/mp.2017.105. Epub 2017 May 9.

GAD1 alternative transcripts and DNA methylation in human prefrontal cortex and hippocampus in brain development, schizophrenia

Affiliations

GAD1 alternative transcripts and DNA methylation in human prefrontal cortex and hippocampus in brain development, schizophrenia

R Tao et al. Mol Psychiatry. 2018 Jun.

Abstract

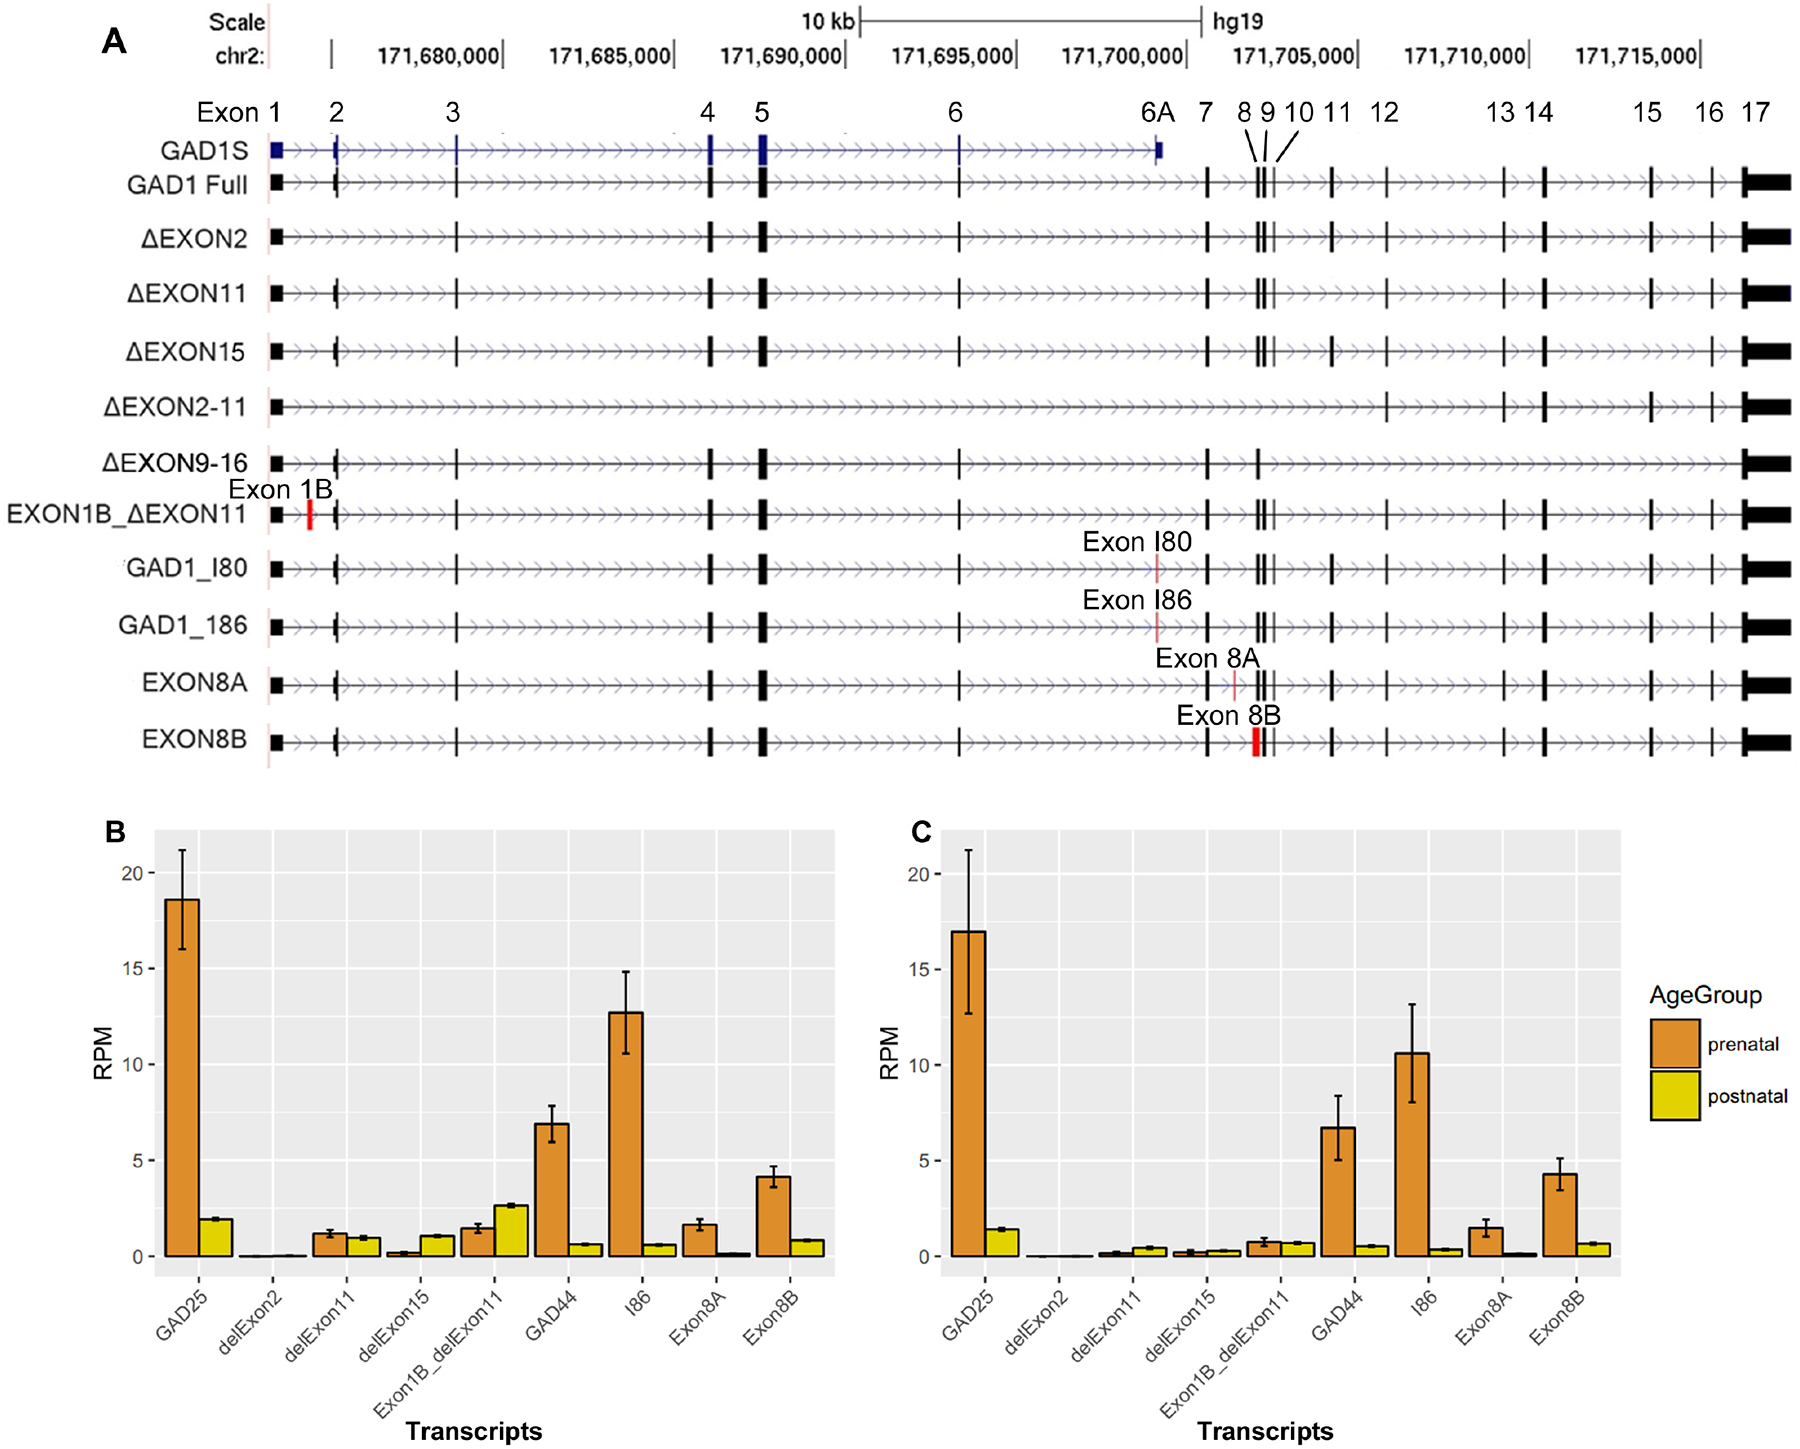
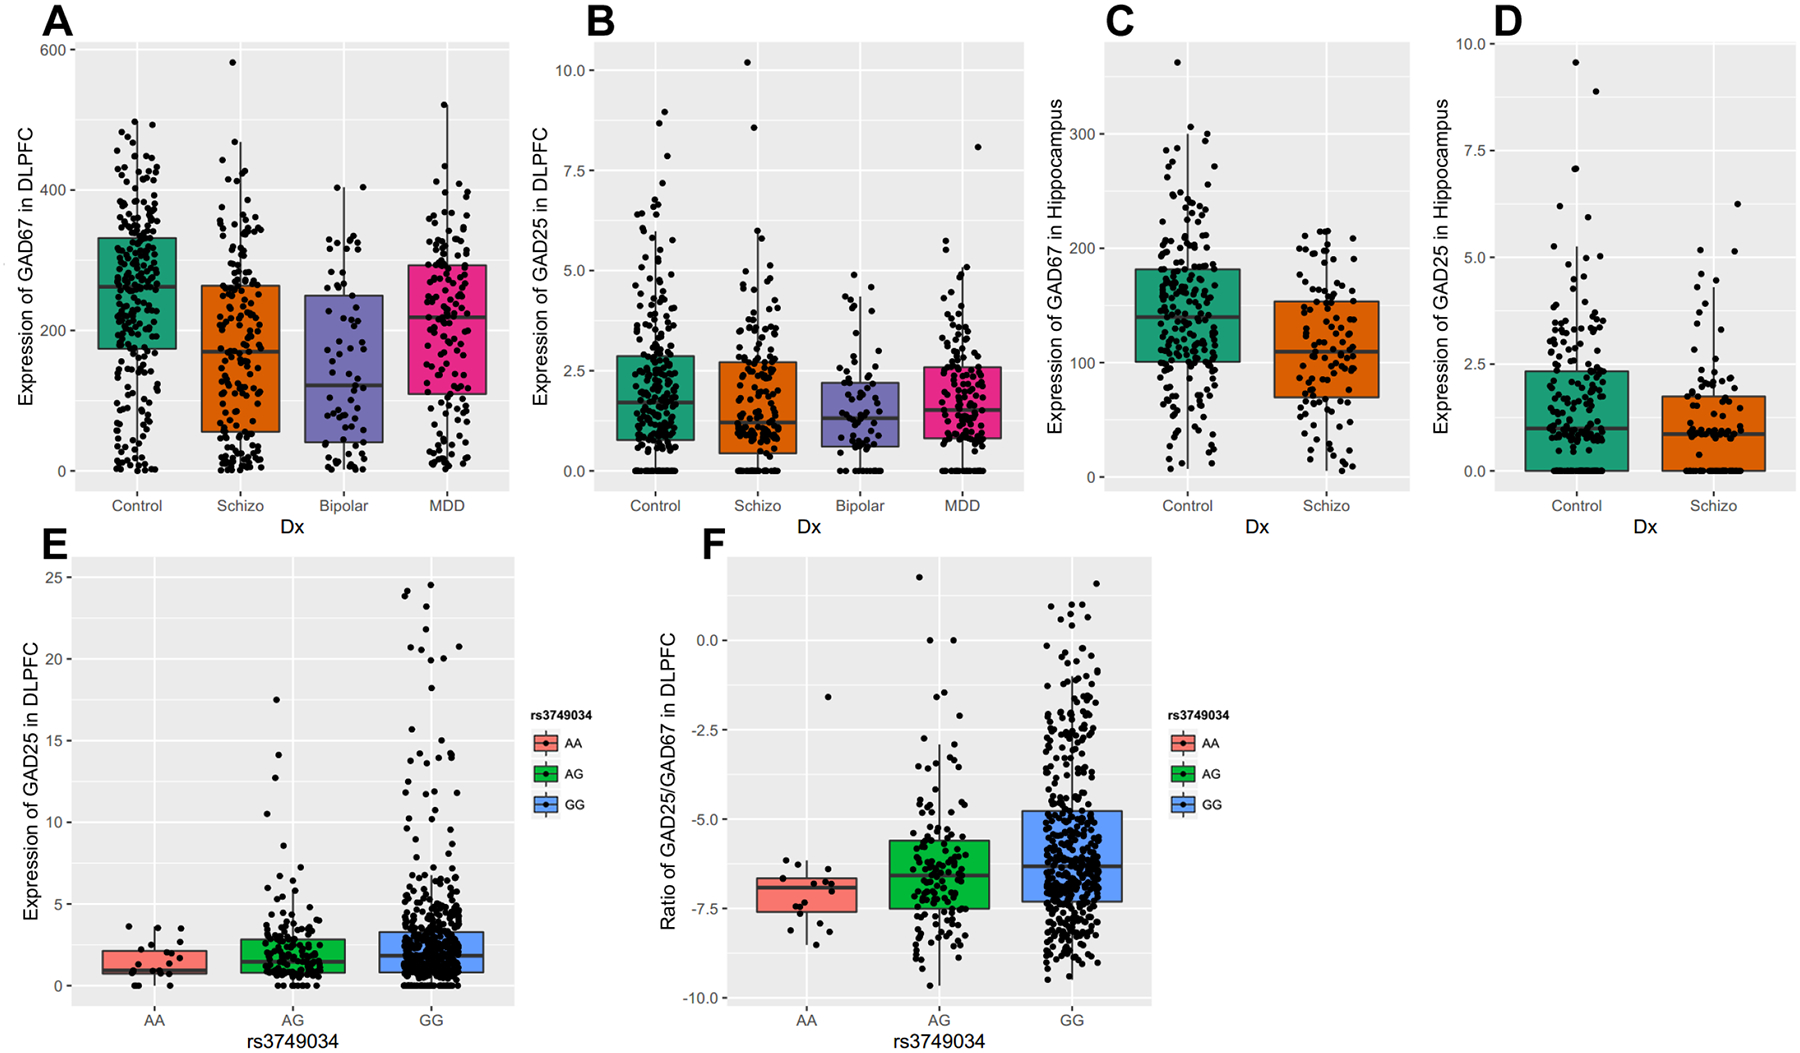
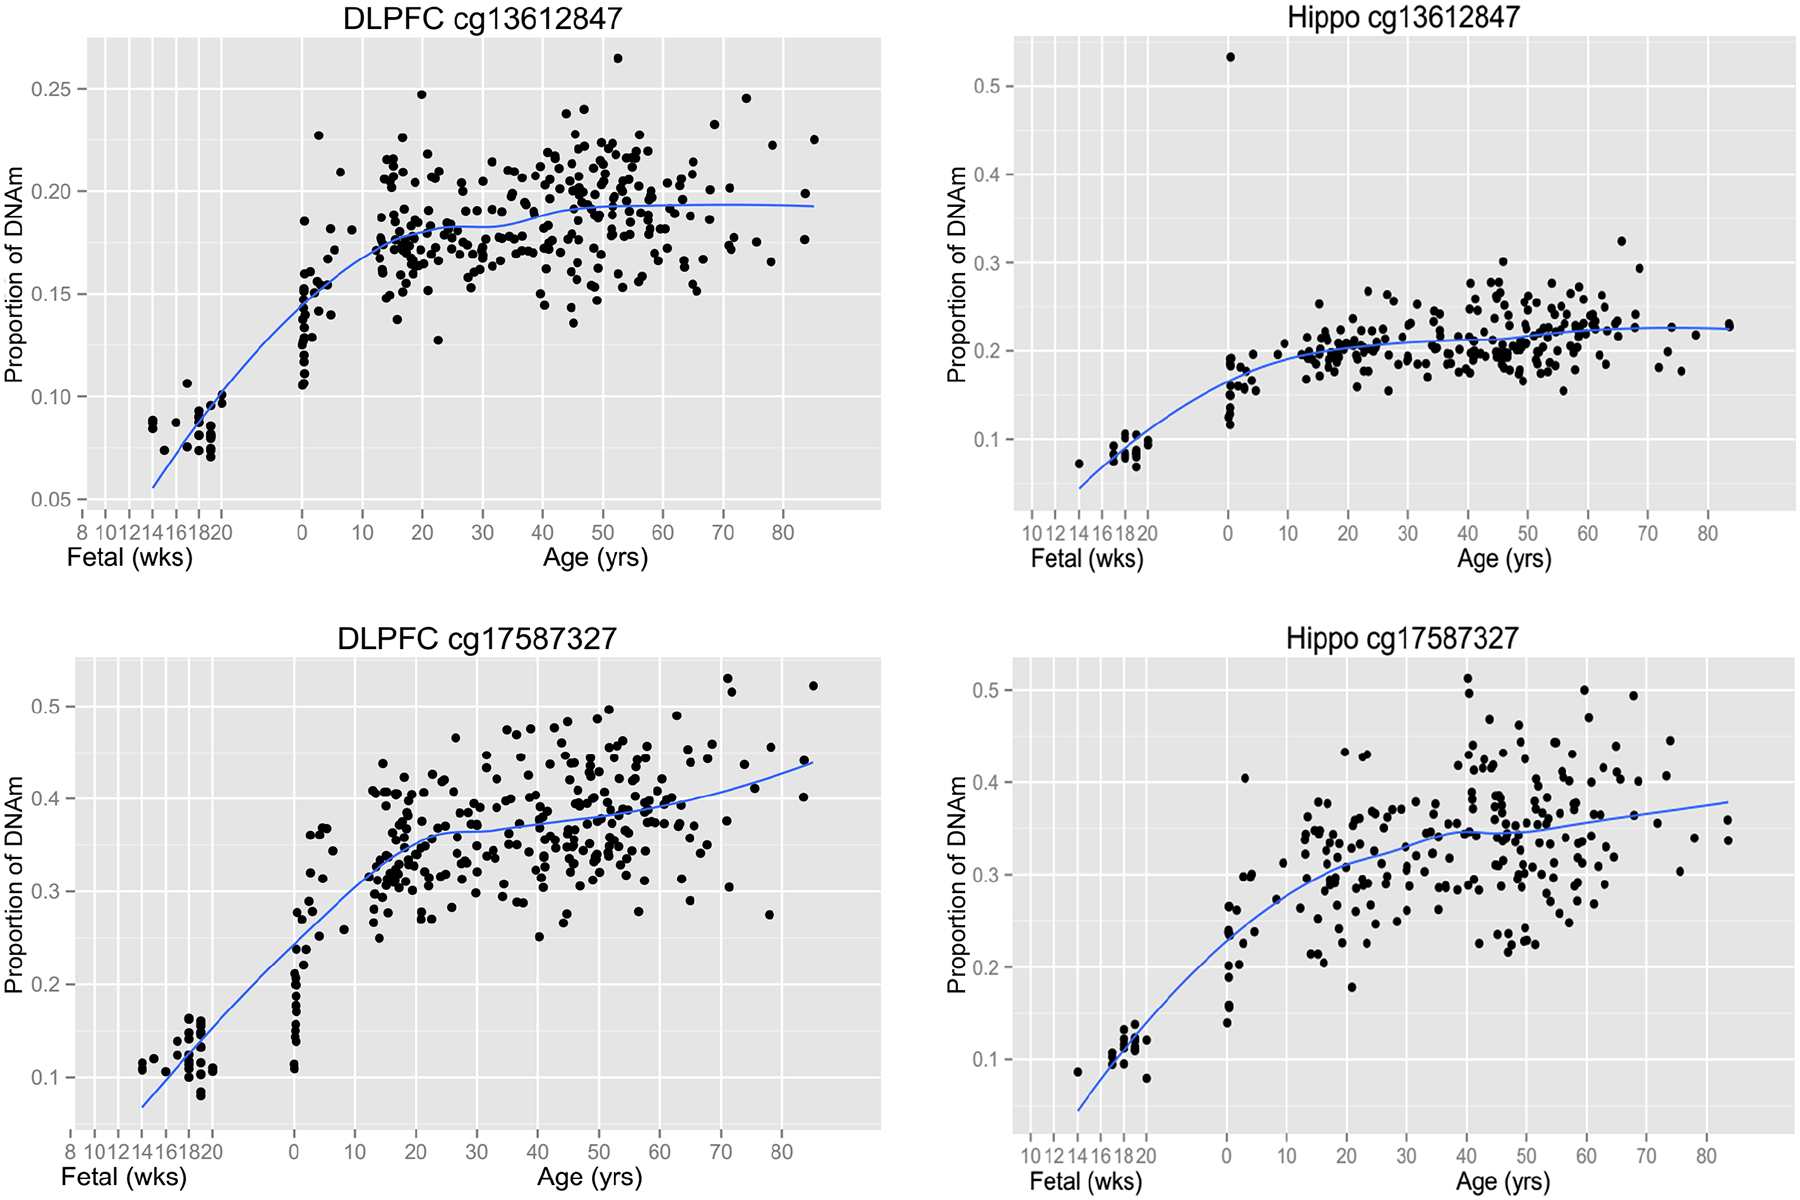
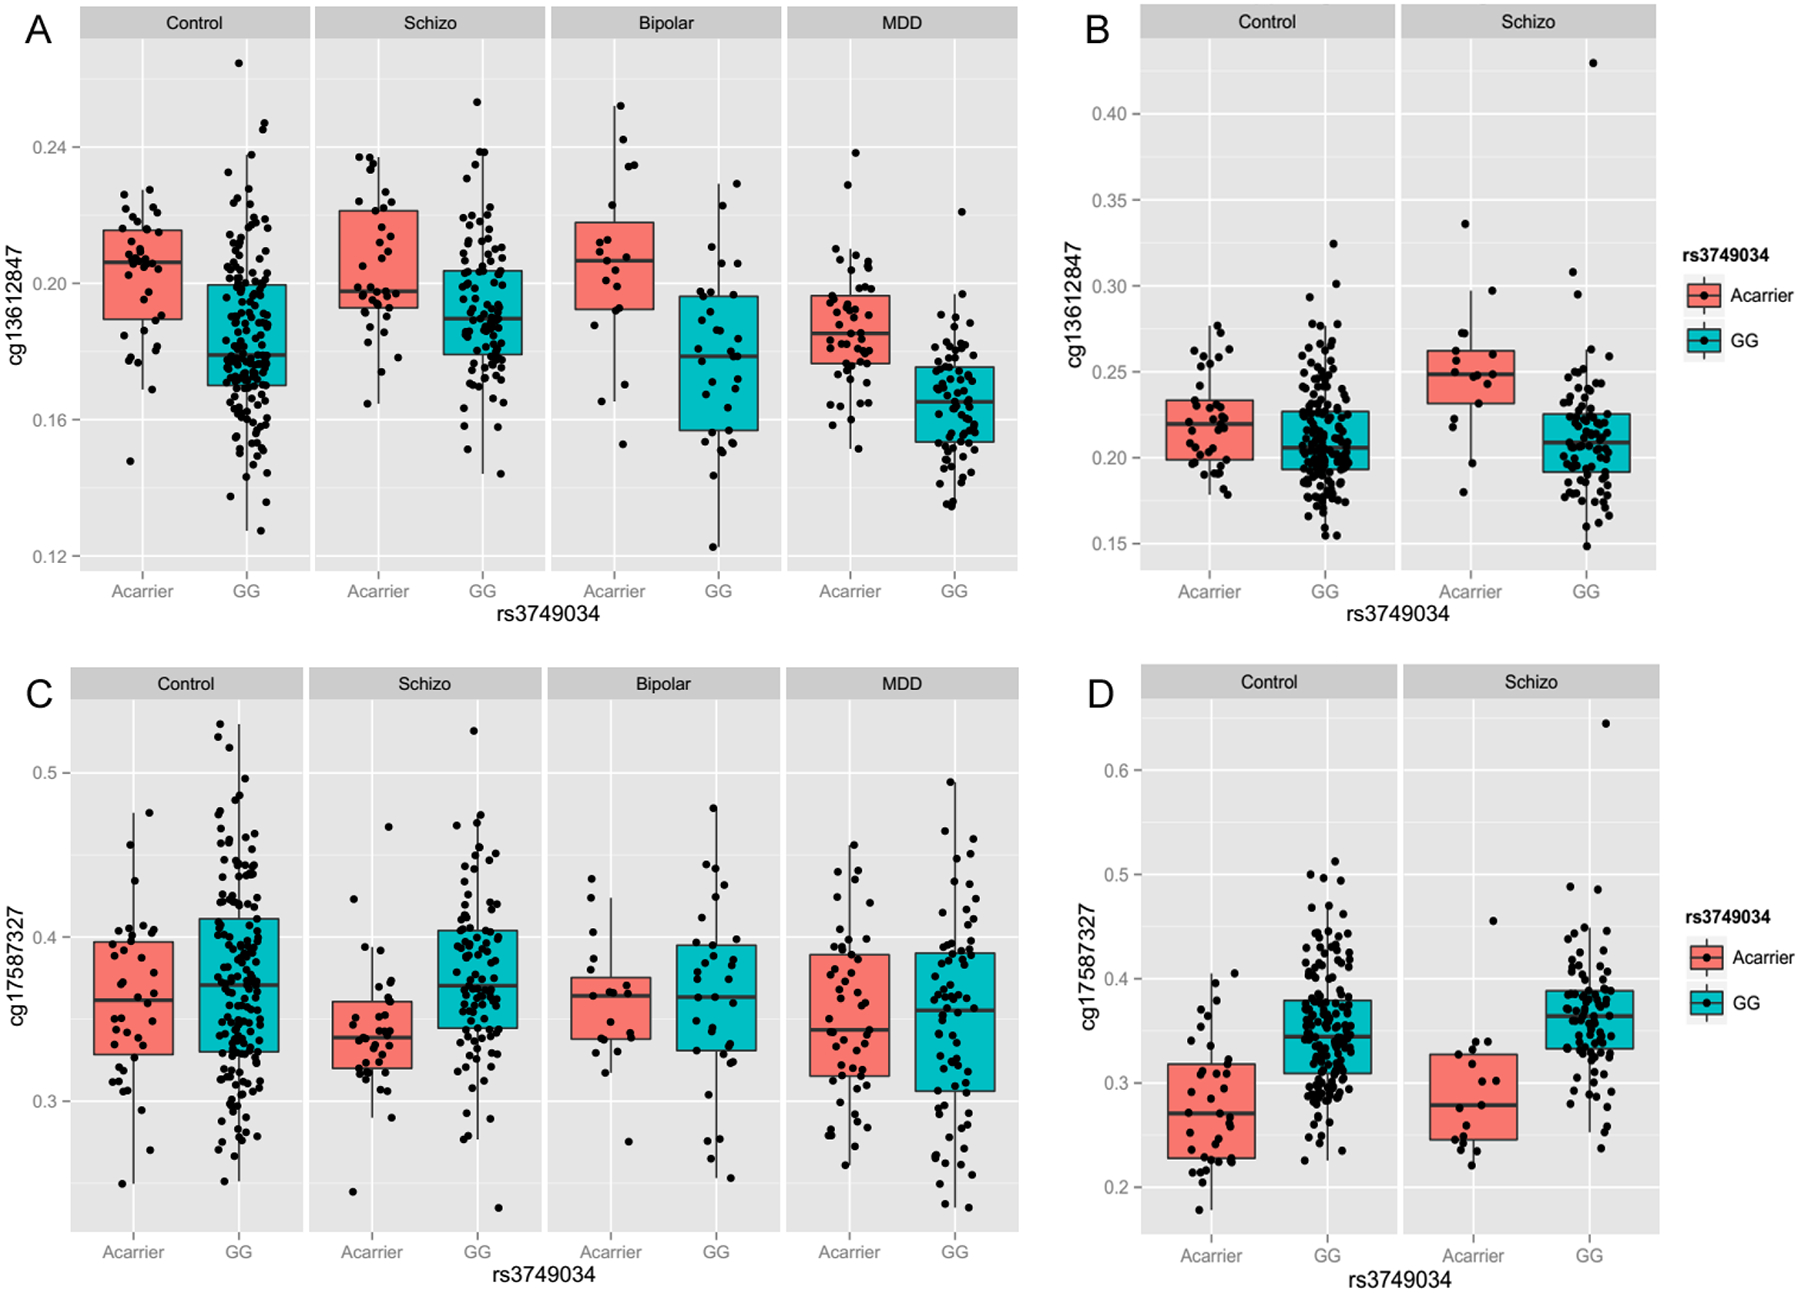
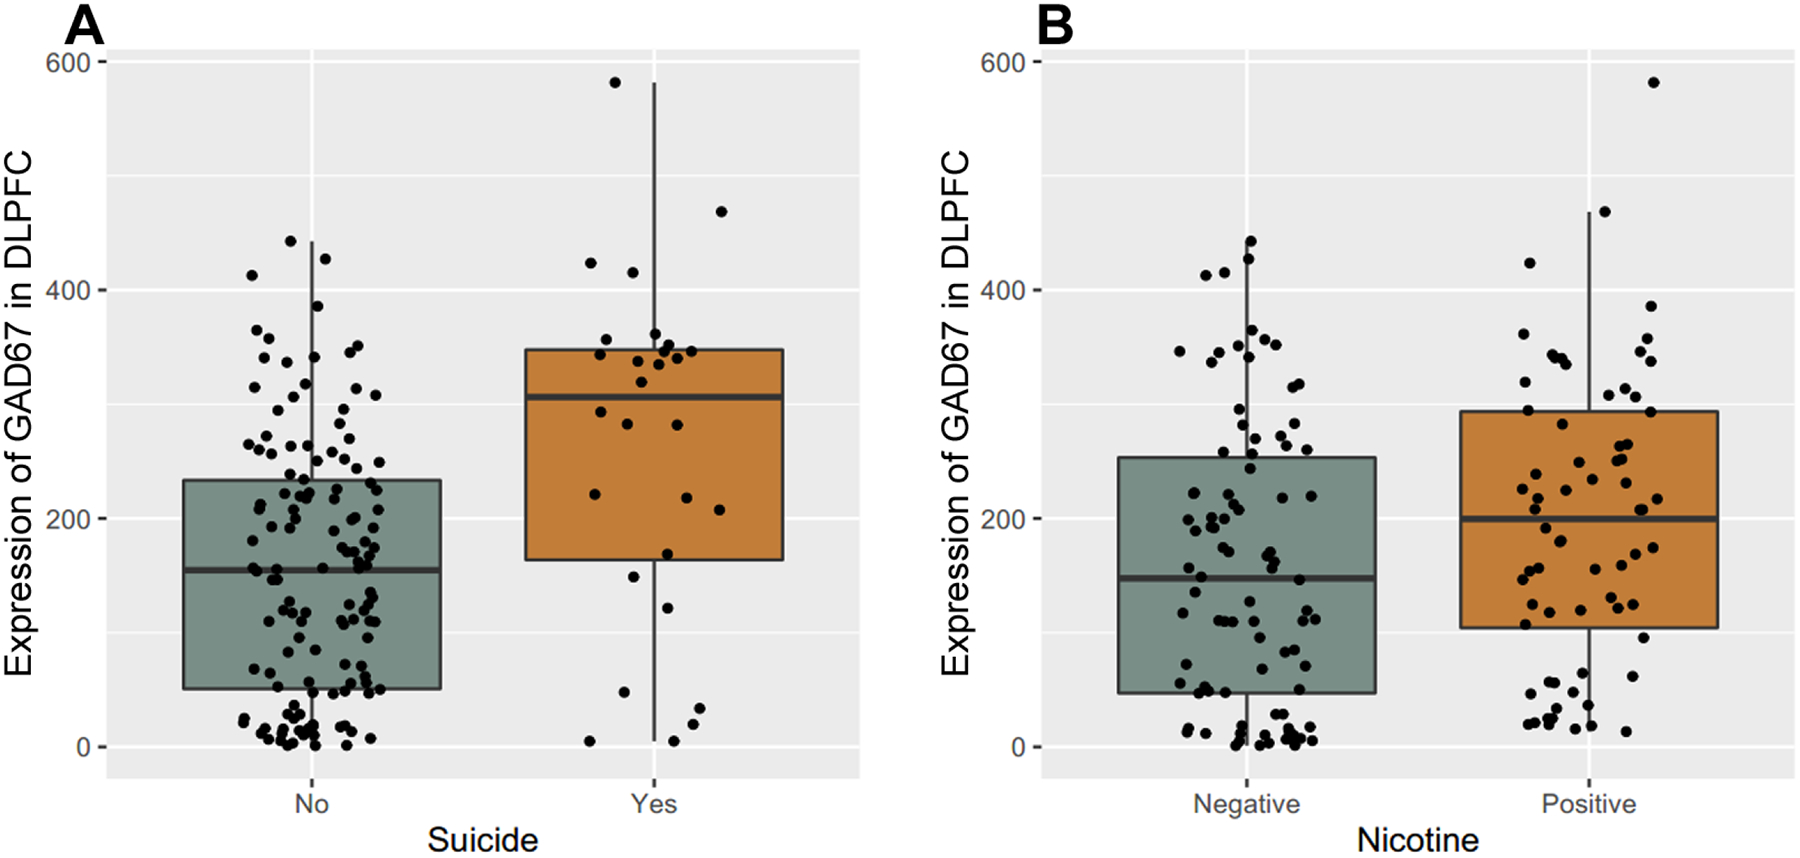
Genetic variations and adverse environmental events in utero or shortly after birth can lead to abnormal brain development and increased risk of schizophrenia. γ-Aminobutyric acid (GABA), the major inhibitory neurotransmitter in the mammalian brain, plays a vital role in normal brain development. GABA synthesis is controlled by enzymes derived from two glutamic acid decarboxylase (GAD) genes, GAD1 and GAD2, both of which produce transcript isoforms. While the full-length GAD1 transcript (GAD67) has been implicated in the neuropathology of schizophrenia, the transcript structure of GAD1 in the human brain has not been fully characterized. In this study, with the use of RNA sequencing and PCR technologies, we report the discovery of 10 novel transcripts of GAD1 in the human brain. Expression levels of four novel GAD1 transcripts (8A, 8B, I80 and I86) showed a lifespan trajectory expression pattern that is anticorrelated with the expression of the full-length GAD1 transcript. In addition, methylation levels of two CpG loci within the putative GAD1 promoter were significantly associated with the schizophrenia-risk SNP rs3749034 and with the expression of GAD25 in dorsolateral prefrontal cortex (DLPFC). Moreover, schizophrenia patients who had completed suicide and/or were positive for nicotine exposure had significantly higher full-length GAD1 expression in the DLPFC. Alternative splicing of GAD1 and epigenetic state appear to play roles in the developmental profile of GAD1 expression and may contribute to GABA dysfunction in the PFC and hippocampus of patients with schizophrenia.


Conflict of interest statement

Conflict of Interest

The authors of this paper have no conflicts of interest to disclose.

Figures

Figure 1.
Figure 1.. Identification and mRNA expression of alternative transcripts of GAD1 in human brain.
A: Alternative transcripts of GAD1 in human brain. We have observed five exotic deletions and 3 novel exons in both adult and fetal human brain. We have also observed the expression of the two embryonic exons in human brain: I80 and I86, previously discovered in rodent brain. In total, we have identified 8 novel GAD1 transcripts in human brain and confirmed the existence of transcripts GAD1-I80 and GAD1-I86 in human brain. Red rectangles, new exons; black rectangles; known exon. Stars mark the 4 embryonic transcripts measured with real-time quantitative PCR. Exon deletion is indicated by Δ; for example, ΔEXON2 means deletion of exon2. Transcripts with a new exon were represented by its former exon name plus a letter. For example, EXON8A means a transcripts containing a new exon between original exon 8 and exon 9. Novel alternative exons have been highlighted by red color. B: mRNA expression of GAD1 transcripts in human DLPFC. C: mRNA expression of GAD1 transcripts in human Hippocampus. We have measure the average expression of GAD1 transcript in the DLPFC and Hippocampus of control subjects by using the RNA sequencing data and unique junctions of each transcript. The expression of the transcripts with novel deletion have been measured by the reads spanning the junction of the deletion. The expression of the transcript with novel exons have been measured by the reading spanning the junction between the novel exon and nearby exon. Since the I80 encodes the GAD25 and GAD44, so the expression of I80 can reflect the expression of GAD44. Since the GAD25 was encodes by I80 and I86, which sharing the same unique junction from exon 6 to I80 or I86, we have used the sharing unique junction of I80 and I86 to represent the expression level of GAD25. We didn’t show the expression level of the full length GAD1 transcript, encoding GAD67, in this two plots. It is because it expression level is too high in postnatal stage to be showed properly with other transcripts together in the same plot. The rare GAD1 transcripts such as ΔEXON2–11 and ΔEXON 9–16 were also not plotted since they are rare.
Figure 2.
Figure 2.. Expression of transcripts encoding GAD67 and GAD25 in human DLFPC and Hippocampus among different diagnostic groups.
The expression of each alternative transcript was studied across four cohorts of subjects (nonpsychiatric controls, schizophrenia, major depressive disorder, and bipolar disorder) in DLPFC and two cohorts of subjects in hippocampus (nonpsychiatric controls and schizophrenia). A: the expression of transcript encoding GAD67 in DLPFC; B: the expression of transcripts encoding GAD25 in DLPFC; C: the expression of transcript encoding GAD67 in Hippocampus; D: the expression of transcripts encoding GAD25 in Hippocampus. The x-axis shows the different diagnostic groups: Control, nonpsychiatric control group; Schizo, patients with schizophrenia; Bipolar, patients with bipolar disorder; MDD, the patient group with major depression. The y-axis represents the relative expression quantities in the DLPFC or Hippocampus. Each dot represents a subject. E: schizophrenia-associated GAD1 risk SNP rs3749034 and the expression of GAD25 in human DLPFC. F: schizophrenia-associated GAD1 risk SNP rs3749034 and ratio of GAD25/GAD67 in human DLPFC. The different genotypes are on the x-axis. The schizophrenia-associated risk genotype is G/G. The y-axis represents the expression of GAD25 in DLPFC or the ratio of the expression of transcript encoding GAD25 divided by the expression of the transcript encoding GAD67. Each dot represents a subject.
Figure 3.
Figure 3.. The lifespan trajectory of DNA methylation level at cg13612847 and cg17587327 loci in human DLPFC and Hippocampus.
Both CpG loci (cg) showed similar lifespan trajectory of DNA methylation level in human DLPFC and Hippocampus. Their methylation level is low in fetal age, and rising during the brain development until about 20~30 years old. The x-axis before birth gestational age is in weeks (wks) and after birth the x-axis shifts to years (yrs). The y-axis represents proportion of DNA methylation level at CpG locus. Each black dot represents a subject. Blue curve indicates the best fit curve for lifetime expression.
Figure 4.
Figure 4.. Schizophrenia-associated GAD1 risk SNP rs3749034 is significantly associated with cg13612847 and cg17587327 in human DLPFC and Hippocampus respectively.
The methylation level of two CpG loci, cg13612847 and cg17587327, was evaluated with the schizophrenia-associated GAD1 risk SNP rs3749034 across four cohorts of subjects (nonpsychiatric controls, schizophrenia, major depressive disorder, and bipolar disorder) in DLPFC and two cohorts of subjects in hippocampus (nonpsychiatric controls and schizophrenia). A: The methylation level of cg13612847 was significantly associated with rs3749034 in human DLPFC of the four cohorts of subjects; B: The methylation level of cg13612847 was significantly associated with rs3749034 in human Hippocampus of patients with schizophrenia; C: The methylation level of cg17587327 was significantly associated with rs3749034 in human DLPFC of patients with schizophrenia; D: The methylation level of cg17587327 was significantly associated with rs3749034 in human Hippocampus of control subjects and patients with schizophrenia. The different genotype is on the x-axis. The y-axis represents the proportion of DNA methylation of cg13612847 or cg17587327. Each black dot represents a subject. The different diagnostic groups were labeled on the head of each plot: Control, nonpsychiatric control group; Schizo, patients with schizophrenia; Bipolar, patients with bipolar disorder; MDD, the patient group with major depression.
Figure 5.
Figure 5.. Expression of GAD67 mRNA correlated with suicide and nicotine exposure in human DLPFC.
The y-axis represents the expression of GAD1 full length transcript encoding GAD67 in DLPFC of patients with schizophrenia. Each black dot represents a subject. A: GAD67 mRNA expression in DLPFC between completed suicide and death by natural causes in schizophrenia patients. The x-axis represents the schizophrenia patients with or without completed suicide. B: GAD67 mRNA expression in DLPFC between nicotine positive and nicotine free schizophrenia patients on toxicology testing. The x-axis represents the schizophrenia patients with or without nicotine exposure based on toxicology testing. “Schizo” represents patients with schizophrenia.

References

    1. LoTurco JJ, Owens DF, Heath MJ, Davis MB, Kriegstein AR. GABA and glutamate depolarize cortical progenitor cells and inhibit DNA synthesis. Neuron 1995; 15: 1287–1298. - PubMed
    1. Marty S, Berninger B, Carroll P, Thoenen H. GABAergic stimulation regulates the phenotype of hippocampal interneurons through the regulation of brain-derived neurotrophic factor. Neuron 1996; 16: 565–570. - PubMed
    1. Behar TN, Schaffner AE, Scott CA, Greene CL, Barker JL. GABA receptor antagonists modulate postmitotic cell migration in slice cultures of embryonic rat cortex. Cereb Cortex N Y N 1991 2000; 10: 899–909. - PubMed
    1. Varju P, Katarova Z, Madarász E, Szabó G. Sequential induction of embryonic and adult forms of glutamic acid decarboxylase during in vitro-induced neurogenesis in cloned neuroectodermal cell-line, NE-7C2. J Neurochem 2002; 80: 605–615. - PubMed
    1. Erlander MG, Tillakaratne NJ, Feldblum S, Patel N, Tobin AJ. Two genes encode distinct glutamate decarboxylases. Neuron 1991; 7: 91–100. - PubMed

Publication types

MeSH terms