. 2017 May 9:4:170061.
doi: 10.1038/sdata.2017.61.

Transcriptional profile of hippocampal dentate granule cells in four rat epilepsy models

Affiliations

Transcriptional profile of hippocampal dentate granule cells in four rat epilepsy models

Raymond Dingledine et al. Sci Data. .

Abstract

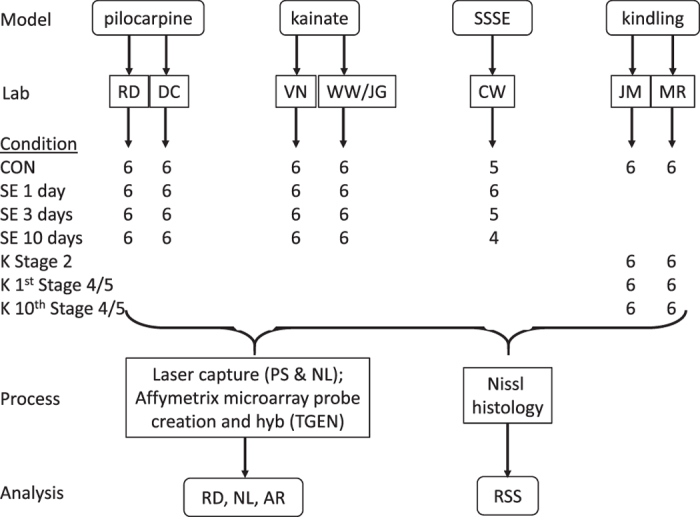
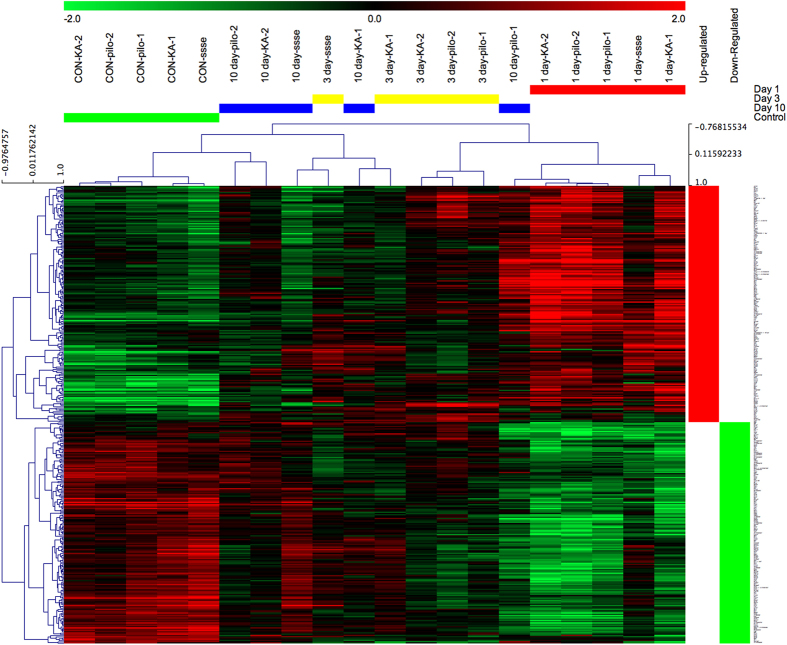
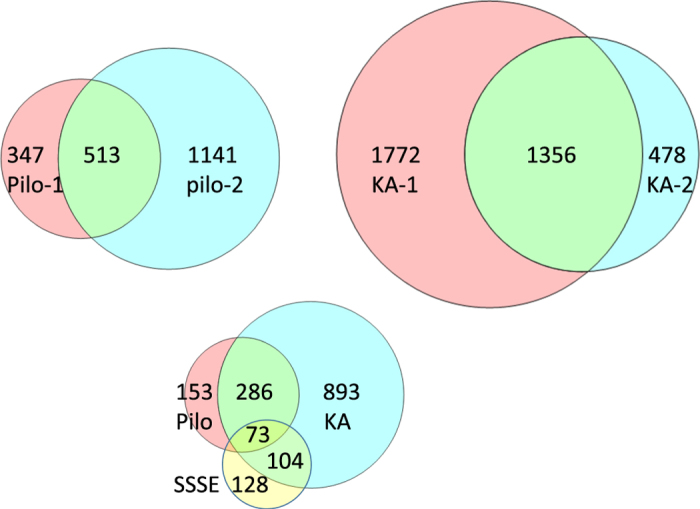
Global expression profiling of neurologic or psychiatric disorders has been confounded by variability among laboratories, animal models, tissues sampled, and experimental platforms, with the result being that few genes demonstrate consistent expression changes. We attempted to minimize these confounds by pooling dentate granule cell transcriptional profiles from 164 rats in seven laboratories, using three status epilepticus (SE) epilepsy models (pilocarpine, kainate, self-sustained SE), plus amygdala kindling. In each epilepsy model, RNA was harvested from laser-captured dentate granule cells from six rats at four time points early in the process of developing epilepsy, and data were collected from two independent laboratories in each rodent model except SSSE. Hierarchical clustering of differentially-expressed transcripts in the three SE models revealed complete separation between controls and SE rats isolated 1 day after SE. However, concordance of gene expression changes in the SE models was only 26-38% between laboratories, and 4.5% among models, validating the consortium approach. Transcripts with unusually highly variable control expression across laboratories provide a 'red herring' list for low-powered studies.


Conflict of interest statement

The authors declare no competing financial interests.

Figures

Figure 1
Figure 1. Workflow scheme.
The number of rats from which high quality RNA was obtained is shown for each condition tested. Control in the case of kindling is sham stimulation. Abbreviations: RD, DC etc on the ‘Lab’, ‘Process’ or ‘Analysis’ rows are initials of the responsible authors; CON—control rats that had been injected with vehicle (pilocarpine and kainate models), or implanted but not stimulated (SSSE and kindling models); SE 1 day—rats sacrificed 1 day after experiencing status epilepticus (SE); K stage 2—rats undergoing kindling that were sacrificed 24 h after the first Stage 2 seizure. SSSE—self-sustained status epilepticus, produced by continuous electrical stimulation of the angular bundle.
Figure 2
Figure 2. Laser capture harvesting of cells in the middle of the dentate granule cell layer in the outer leaf.
Left: diagram of hippocampus with CA1 and CA3 pyramidal cell layers and the dentate gyrus (DG). Laser capture was done from the boxed region and shown in the right panel. Cresyl violet stain of a section from a rat treated with pilocarpine 10 days before. The region of captured dentate granule cells is indicated by the absence of blue stain.
Figure 3
Figure 3. Quality control assessment for microarrays of the RNA samples from 164 rats.
(a) Signal values from 4 bacterial or viral RNAs that had been spiked into each sample RNA before probe labeling are plotted for each of the 164 RNA samples. Boxplots of median expression across all arrays are shown to the right. Labels a-g denote data from the seven laboratories. Labels 1–4 are different prokaryotic or phage RNAs spiked at increasing levels. (b) Median 3′/5′ intensity ratios from 10 transcripts in each sample are plotted. (c) Excellent correlation between expression in the control condition of the 9,327 transcripts in the first kainate laboratory (KA-1) and the first pilocarpine laboratory (pilo-1). The heatmap below shows Pearson’s correlations between median control expression in all combinations of the 7 laboratories; correlations range from 0.973 to 0.998. (d) Histogram of the median expression level of each expressed gene in the control condition across all 7 laboratories is normal (Kolmogorov-Smirnov test). (e) The coefficient of variation is plotted versus the median expression for each of 9,327 transcripts in the control condition across 7 laboratories, revealing a subset of 59 genes with very tight expression across laboratories (<3% cv) and a subset of 87 genes with very variable expression. (ce): A transcript was selected for inclusion if at least 6 of the 7 laboratories had no more than 3 absent calls each (mean of 0.26 absent calls/gene/lab).
Figure 4
Figure 4. Hierarchical clustering of differentially expressed genes across laboratories and SE epilepsy models.
Unsupervised hierarchical clustering was performed using median log2 values of the 368 genes that were differentially expressed (FDR<0.05) at least 2-fold between controls and SE-experienced rats, in any model and any lab, with uncentered Pearson correlations and complete clustering.
Figure 5
Figure 5. Low congruence of differentially-expressed genes across laboratories and animal models of epilepsy 1 day after SE.
The circles in the top row show overlap between laboratories studying the same epilepsy model, and the bottom compares differentially expressed genes among the three epilepsy models.

Comment in

References

Data Citations

    1. Dingledine R. 2013. NCBI Gene Expression Omnibus. GSE47752

References

    1. Hesdorffer D. C., Logroscino G., Cascino G., Annegers J. F. & Hauser W. A. Risk of unprovoked seizure after acute symptomatic seizure: effect of status epilepticus. Annals of Neurology 44, 908–912 (1998). - PubMed
    1. Lowenstein D. H., Bleck T. & Macdonald R. L. It's time to revise the definition of status epilepticus. Epilepsia 40, 120–122 (1999). - PubMed
    1. Raspall-Chaure M., Chin R. F., Neville B. G. & Scott R. C. Outcome of paediatric convulsive status epilepticus: a systematic review. The Lancet Neurology 5, 769–779 (2006). - PubMed
    1. Lukasiuk K., Kontula L. & Pitkänen A. cDNA profiling of epileptogenesis in the rat brain. Eur J Neurosci. 17, 271–279 (2003). - PubMed
    1. Elliott R. C., Miles M. F. & Lowenstein D. H. Overlapping microarray profiles of dentate gyrus gene expression during development- and epilepsy-associated neurogenesis and axon outgrowth. J Neurosci. 23, 2218–2227 (2003). - PMC - PubMed

Publication types