

Altered sensorimotor cortical oscillations in individuals with multiple sclerosis suggests a faulty internal model
- PMID: 28485884
- PMCID: PMC6867014
- DOI: 10.1002/hbm.23644
Altered sensorimotor cortical oscillations in individuals with multiple sclerosis suggests a faulty internal model
Abstract
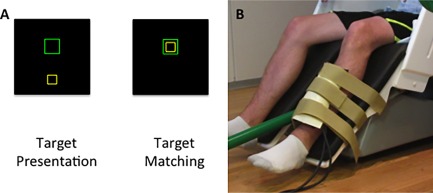
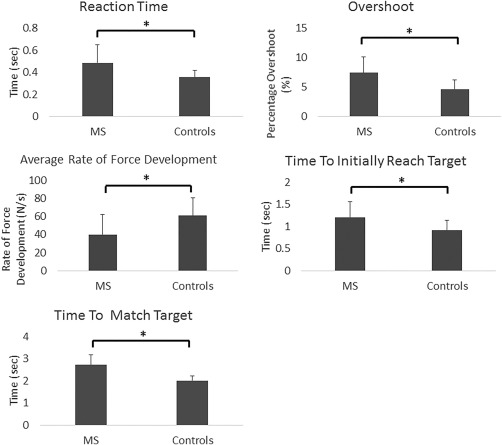
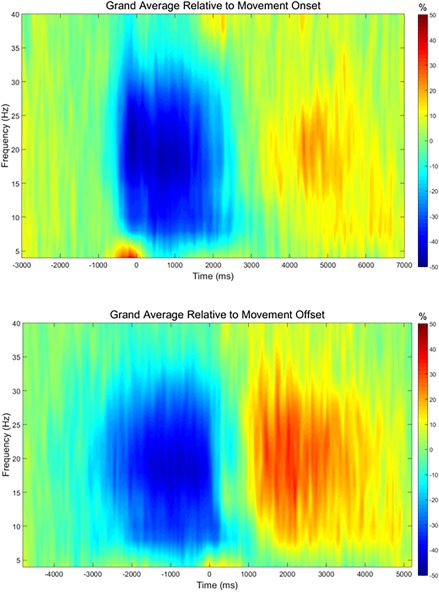
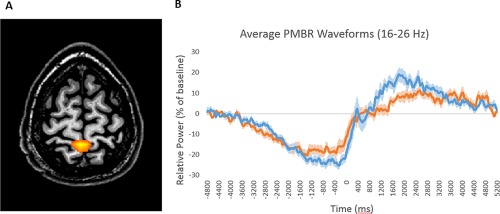
Multiple sclerosis (MS) is a demyelinating disease that results in a broad array of symptoms, including impaired motor performance. How such demyelination of fibers affects the inherent neurophysiological activity in motor circuits, however, remains largely unknown. Potentially, the movement errors associated with MS may be due to imperfections in the internal model used to make predictions of the motor output that will meet the task demands. Prior magnetoencephalographic (MEG) and electroencephalographic brain imaging experiments have established that the beta (15-30 Hz) oscillatory activity in the sensorimotor cortices is related to the control of movement. Specifically, it has been suggested that the strength of the post-movement beta rebound may indicate the certainty of the internal model. In this study, we used MEG to evaluate the neural oscillatory activity in the sensorimotor cortices of individuals with MS and healthy individuals during a goal-directed isometric knee force task. Our results showed no difference between the individuals with MS and healthy individuals in the beta activity during the planning and execution stages of movement. However, we did find that individuals with MS exhibited a weaker post-movement beta rebound in the pre/postcentral gyri relative to healthy controls. Additionally, we found that the behavioral performance of individuals with MS was aberrant, and related to the strength of the post-movement beta rebound. These results suggest that the internal model may be faulty in individuals with MS. Hum Brain Mapp 38:4009-4018, 2017. © 2017 Wiley Periodicals, Inc.
Keywords: PMBR; beta frequency; lower extremity; magnetoencephalography.
© 2017 Wiley Periodicals, Inc.
Figures
References
-
- Alegre M, Gurtubay IG, Labarga A, Iriarte J, Malanda A, Artieda J (2003): Alpha and beta oscillatory changes during stimulus‐induced movement paradigms: effect of stimulus predictability. Neuroreport 14:381–385. - PubMed
-
- Arpin DJ, Davies BL, Kurz MJ (2016): Multiple sclerosis influences the precision of the ankle plantarflexon muscular force production. Gait Posture 45:170–174. - PubMed
-
- Bonfiglio L, Rossi B, Sartucci F (2006): Prolonged intracortical delay of long‐latency reflexes: electrophysiological evidence for a cortical dysfunction in multiple sclerosis. Brain Res Bull 69:606–613. - PubMed
-
- Bonzano L, Pardini M, Mancardi GL, Pizzorno M, Roccatagliata L (2009): Structural connectivity influences brain activation during during PVSAT in Multiple Sclerosis. Neuroimage 44:9–15. - PubMed
Publication types
MeSH terms
LinkOut - more resources
Full Text Sources
Other Literature Sources
