. 2017 Aug;142(3):429-443.
doi: 10.1111/jnc.14064. Epub 2017 Jun 20.

Sonic hedgehog signalling mediates astrocyte crosstalk with neurons to confer neuroprotection

Affiliations

Sonic hedgehog signalling mediates astrocyte crosstalk with neurons to confer neuroprotection

Christopher I Ugbode et al. J Neurochem. 2017 Aug.

Abstract

Sonic hedgehog (SHH) is a glycoprotein associated with development that is also expressed in the adult CNS and released after brain injury. Since the SHH receptors patched homolog-1 and Smoothened are highly expressed on astrocytes, we hypothesized that SHH regulates astrocyte function. Primary mouse cortical astrocytes derived from embryonic Swiss mouse cortices, were treated with two chemically distinct agonists of the SHH pathway, which caused astrocytes to elongate and proliferate. These changes are accompanied by decreases in the major astrocyte glutamate transporter-1 and the astrocyte intermediate filament protein glial fibrillary acidic protein. Multisite electrophysiological recordings revealed that the SHH agonist, smoothened agonist suppressed neuronal firing in astrocyte-neuron co-cultures and this was abolished by the astrocyte metabolic inhibitor ethylfluoroacetate, revealing that SHH stimulation of metabolically active astrocytes influences neuronal firing. Using three-dimensional co-culture, MAP2 western blotting and immunohistochemistry, we show that SHH-stimulated astrocytes protect neurons from kainate-induced cell death. Altogether the results show that SHH regulation of astrocyte function represents an endogenous neuroprotective mechanism.

Keywords: Gli1; cell culture; multielectrode array; neurodegeneration.


Figures

Figure 1
Figure 1
Sonic hedgehog (SHH) pathway agonists cause astrocyte elongation over time. Phase contrast time lapse microscopy identifies morphological changes in primary mouse astrocytes (embryonic day 15, 12 DIV) treated with SHH agonists, Smoothened agonist (SAG) and Pur (purmorphamine). Astrocytes were visualized following vehicle administration (a–d), or the SHH agonists SAG (f–i and k–n) or Pur (p–s and u–x). Cultures were also fixed and immunostained for glial fibrillary acidic protein (GFAP) (Green e, j, o, t, y). Over 24 h, astrocytes begin to elongate showing morphological changes indicative of a transition to a less reactive (de‐differentiated) state. Note the change from cobblestone shape to more elongated morphologies. White boxes shows zoomed cells, highlighting change in morphology of those cells over time. The phenotypic change was evident between 4 and 8 h for purmorphamine and within 1 h for SAG. Scale bar = 10 μm.
Figure 2
Figure 2
Sonic hedgehog pathway stimulation causes astrocyte proliferation. Smoothened agonist (SAG) and purmorphamine (Pur – both 10 μM) do not change 3‐(4,5‐dimethylthiazol‐2‐yl)‐2,5‐diphenyltetrazolium bromide (MTT) turnover at 24 (a) or 72 (b) hours in primary mouse astrocyte cultures (embryonic day 15, 12 DIV). Immunostaining (c) for Ki67 (green), a marker of cell division reveals increased astrocyte proliferation with both agonists. Scale bar = 20 μm. Statistical analysis was carried out using one‐way analysis of variance (anova) followed by Dunnett's post hoc test (*p<0.05, **p<0.01, ***p < 0.001). Error bars represent standard error of the mean (SEM). N = 3 independent cultures.
Figure 3
Figure 3
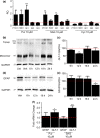
Sonic hedgehog pathway stimulation increases Gli1 mRNA and decreases astrocyte hallmarks glutamate transporter 1 (GLT‐1) and glial fibrillary acidic protein (GFAP). qPCR and western blotting was carried out for a number of mature astrocyte markers using cDNA and protein samples from murine embryonic (embryonic day 15) cortical astrocytes (12 DIV). (a) qPCR shows both agonists significantly increase Gli1 mRNA with smoothened agonist (SAG) further increasing patched homolog 1 (PTCH1) and smoothened receptor (SMO) mRNA. Pur (Purmorphamine, 10 μM) also significantly increases PTCH1 mRNA. The antagonist cyclopamine significantly reduces Gli1 mRNA. Panel b shows GLT‐1 (trimer 160 kDa and monomer 65 kDa) protein levels after time course treatments with SAG (10 μM). GLT‐1 protein levels significantly decrease after 12 h treatment with SAG. Panel d shows (GFAP, 50 kDa) protein levels after time course SAG (10 μM) treatments. GFAP protein levels are significantly reduced after 24 h SAG treatment. Glyceraldehyde Phosphate Dehydrogenase (GAPDH) was used as a sample loading control. GLT‐1 (c) and GFAP (e) protein levels were quantified by normalizing to GAPDH. Protein levels after treatment are expressed as a % of the untreated control protein levels (red line). Statistical analysis was carried out using anova (analysis of variance). (f) qPCR shows 24 h treatments with either SAG (10 μM) or Pur (10 μM) significantly increase GLT‐1 mRNA, while GFAP mRNA remains unchanged. mRNA changes analysed through relative quantification (RQ) and are depicted as the mean compared to untreated controls (red line). GAPDH was used as a reference gene during relative quantification of CT values. Statistical analysis was carried out using anova followed by Dunnett's post hoc test (*p < 0.05, **p < 0.01, ***p < 0.001). Error bars represent standard error of the mean (SEM). N = 5 biological replicates for both western blotting and qPCR data.
Figure 4
Figure 4
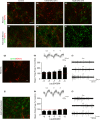
Smoothened agonist acts through astrocytes to reduce neuronal firing frequency. Immunohistochemistry showing glial fibrillary acidic protein (GFAP – green) and MAP2 (microtubule‐associated protein 2 – red) expression in primary cortical neurons (a–c) or astrocyte‐neuron cultures (d–f). Low concentrations of smoothened agonist (SAG) do not visibly alter either culture (b and e). High concentrations of SAG (10 μM) cause neuronal cell death in both neurons (c) and astrocyte‐neuron cultures (f). Scale bar = 100 μm. Multielectrode array (MEA) recording of neuronal spike firing activity reveals that the effect of SAG upon neurons is mediated by astrocytes. In neuron only cultures (g) SAG increases neuronal firing in a concentration‐dependent manner (h). Insets show 200 spike overlay (light grey) and average spike waveform (white) in control, 10 nM and 10 μM conditions. Scale: 20 μV, 10 ms. Representative traces (i) demonstrate concentration‐dependent increases in spike firing. Scale: 20 μV. 250 ms. In astrocyte‐neuron cultures (j), astrocytes bind SAG which leads to a decrease in neuronal firing (k). Insets show 200 spike overlay (light grey) and average spike waveform (white) in control, 10 nM and 10 μM conditions. Scale: 10 μV, 10 ms. Higher concentrations (10 μM) cause firing frequency to increase back to 100% of control suggesting that astrocytes have limited capacity to bind the agonist. Representative traces (L) demonstrate concentration‐dependent decreases in spike firing. Scale: 10 μV. 250 ms. Scale bar = 10 μm. Significance was derived using analysis of variance (anova) followed by Dunnett's post hoc test (*p<0.05, **p<0.01, ***p < 0.001). Error bars represent standard error of the mean (SEM). N = 3 independent cultures. Data for each replicate culture is from 7 to 9 active electrodes.
Figure 5
Figure 5
Neuronal firing properties in smoothened agonist (SAG)‐treated co‐cultures are dependent on metabolically active astrocytes. Immunohistochemistry showing glial fibrillary acidic protein (GFAP – green) expression in primary astrocytes (a and b) and MAP2 (microtubule‐associated protein 2 – red) expression in primary cortical neuron cultures (c and d). Ethylfluoroacetate (EFA, 1 mM, 1 h) does not visibly change astrocytes (b) or neuronal (d) cultures when compared to controls (a and c). Furthermore, EFA (1 mM, 1 h) significantly reduces mitochondrial aconitase activity in astrocytes (e). While EFA decreases aconitase activity in neurons, the observed decrease was not statistically significant. N = 5 independent cultures. Finally, multielectrode arrays (MEA's) were treated with EFA and then SAG (100 nM). EFA alone significantly increases firing frequency in co‐cultures. This increase in firing rate is further enhanced following immediate incubation with SAG (smoothened agonist, 100 nM) when compared to controls (red line). Statistical analysis carried out using one‐way anova followed by Dunnett's multiple comparison test (*p < 0.05, **p < 0.01)). Error bars represent standard error of the mean (SEM). N = 3. Scale bar = 10 μm. Data represent 56 active electrodes across three biological replicates.
Figure 6
Figure 6
Sonic hedgehog (SHH)‐treated astrocytes delay kainate‐induced neurodegeneration in vitro. Western blotting was carried out to assay levels of MAP2 (microtubule‐associated protein 2) in protein samples derived from murine embryonic (embryonic day 15) cortical neurons (18 DIV). Kainate (100 μM, 24 h) induces significant neurodegeneration in neuronal cultures. Astrocytes co‐cultured with neurons using transwells, prior to addition of kainate, do not protect against kainate‐induced neuronal cell death. SHH‐treated astrocytes, co‐cultured with neurons prior to kainate addition, delay neuronal cell death (a). Quantification of western bands (b) involved normalizing to Glyceraldehyde Phosphate Dehydrogenase (GAPDH), which was also used as a sample loading control. MAP2 A+B protein levels are expressed as a % of controls (with and without astrocyte conditioning). Control protein levels are represented by a red line. Significance was derived using students t‐test (*p < 0.05, **p<0.01, ***p < 0.001). Immunohistochemistry (c‐d) showing MAP2 primary cortical neuron cultures, co‐cultured with astrocytes (c). Neurodegeneration is observed as lack of MAP2‐positive staining (d) after addition of kainate. SHH‐treated astrocytes delay kainate‐induced neurodegeneration (e). Error bars represent standard error of the mean (SEM) Scale bar = 100 μm. N = 3 independent cultures.

Similar articles

Cited by

References

    1. Amankulor N. M. Hambardzumyan D., Pyonteck S. M., Becher O. J., Joyce J. A. and Holland E. C. (2009) Sonic hedgehog pathway activation is induced by acute brain injury and regulated by injury‐related inflammation. J. Neurosci. 29, 10299–10308. - PMC - PubMed
    1. Atkinson P. J. Atkinson P. J., Dellovade T., Albers D., Von Schack D., Saraf K., Needle E., Reinhart P. H. and Hirst W. D. (2009) Sonic hedgehog signaling in astrocytes is dependent on p38 mitogen‐activated protein kinase and G‐protein receptor kinase 2. J. Neurochem. 108, 1539–1549. - PubMed
    1. Bahia P. K. Bahia P. K., Pugh V., Hoyland K., Hensley V., Rattray M. and Williams R. J. (2012) Neuroprotective effects of phenolic antioxidant tBHQ associate with inhibition of FoxO3a nuclear translocation and activity. J. Neurochem. 123, 182–191. - PMC - PubMed
    1. Bambakidis N. C., Horn E. M., Nakaji P., et al (2009) Endogenous stem cell proliferation induced by intravenous hedgehog agonist administration after contusion in the adult rat spinal cord. Spine 10, 171–176. - PubMed
    1. Cahoy J. D., Emery B., Kaushal A., et al (2008) A transcriptome database for astrocytes, neurons, and oligodendrocytes: a new resource for understanding brain development and function. J. Neurosci. 28, 264–278. - PMC - PubMed

Publication types

Substances