Review
. 2017 Jun 21;28(6):1581-1597.
doi: 10.1021/acs.bioconjchem.7b00194. Epub 2017 May 18.

Use of Nanoparticle Contrast Agents for Cell Tracking with Computed Tomography

Affiliations
Review

Use of Nanoparticle Contrast Agents for Cell Tracking with Computed Tomography

Johoon Kim et al. Bioconjug Chem. .

Abstract

Efforts to develop novel cell-based therapies originated with the first bone marrow transplant on a leukemia patient in 1956. Preclinical and clinical examples of cell-based treatment strategies have shown promising results across many disciplines in medicine, with recent advances in immune cell therapies for cancer producing remarkable response rates, even in patients with multiple treatment failures. However, cell-based therapies suffer from inconsistent outcomes, motivating the search for tools that allow monitoring of cell delivery and behavior in vivo. Noninvasive cell imaging techniques, also known as cell tracking, have been developed to address this issue. These tools can allow real-time, quantitative, and long-term monitoring of transplanted cells in the recipient, providing insight on cell migration, distribution, viability, differentiation, and fate, all of which play crucial roles in treatment efficacy. Understanding these parameters allows the optimization of cell choice, delivery route, and dosage for therapy and advances cell-based therapy for specific clinical uses. To date, most cell tracking work has centered on imaging modalities such as MRI, radionuclide imaging, and optical imaging. However, X-ray computed tomography (CT) is an emerging method for cell tracking that has several strengths such as high spatial and temporal resolution, and excellent quantitative capabilities. The advantages of CT for cell tracking are enhanced by its wide availability and cost effectiveness, allowing CT to become one of the most popular clinical imaging modalities and a key asset in disease diagnosis. In this review, we will discuss recent advances in cell tracking methods using X-ray CT in various applications, in addition to predictions on how the field will progress.


Conflict of interest statement

The authors declare no competing financial interest.

Figures

Figure 1
Figure 1
Schematic depictions of (A) Bremsstrahlung radiation and (B) characteristic radiation. (C) Typical photon energy spectrum emitted from a CT scanner. Figure reproduced with permission from ref (58).
Figure 2
Figure 2
Schematic depictions of (A) the photoelectric effect and (B) Compton scattering. Figure reproduced with permission from ref (59).
Figure 3
Figure 3
Mass attenuation coefficients of various elements where the K-edges are clearly apparent (spikes in the attenuation coefficient curves at certain energies indicated by down arrows). Figure reproduced with permission from ref (57).
Figure 4
Figure 4
Images of coronary computed tomography angiography of the right coronary artery reconstructed with (A) filtered back projection, (B) hybrid iterative reconstruction (iDose4), and (C) iterative model based reconstruction. The white arrow points at the right coronary artery, and the white arrowhead points at a noncalcified plaque. The images demonstrate noise reduction of iterative reconstruction when compared to filtered back projection. Figure reproduced with permission from ref (61).
Figure 5
Figure 5
(A) Conventional CT image of an artery phantom. (B) Spectral CT gold, iodine, photoelectric, and Compton images of the phantom and an overlay of all four images. Figure reproduced with permission from ref (63).
Figure 6
Figure 6
(A) Schematic depictions of CIC synthesis and structure. (B) Microscopy image of CIC without cell encapsulation. (C) Microscopy image of CIC with beta-TC6 mouse insulinoma cells encapsulated. (D) Fluorescence microscopy image of encapsulated mouse insulinoma cells. Green = live cells, red = dead cells. (E) Spin–echo MRI image, (F) gradient-echo MRI image, (G) micro-CT image, and (H) ultrasound image acquired 1 day after injection of 1200 CIC into the abdomen of a mouse. Figure reproduced with permission from ref (102).
Figure 7
Figure 7
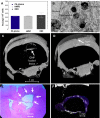
(A) Average gold uptake of 107 cells C6 glioma cells, hMSCs, and OECs after 22 h incubation with 52 μg/mL AuNP. (B) TEM of a glial cell showing AuNP uptake (black dots). (C,D) Synchrotron radiation source phase contrast CT image 14 days after injection of either (C) AuNP loaded glioma cells or (D) unlabeled glioma cells. (E) H&E histology image of the lesion. (F) Overlay of synchrotron radiation source phase contrast CT image and histology of the brain tumor. Figure reproduced with permission from ref (105).
Figure 8
Figure 8
(A) Schematic depiction of the synthesis and structure of AuNP used for hMSC labeling. (B,C) 3D in vivo volume rendered micro-CT scans of rat brains acquired one month after injection with (B) labeled hMSCs and (C) free AuNP. (D–F) Coronal brain slice (D) 1 week post-transplantation, (E) 3 week post-transplantation, and (F) Overlay of D and E showing the migration pattern of the cells. Figure reproduced with permission from ref (111).
Figure 9
Figure 9
(A) Schematic depiction of ligand exchange with citrate capped AuNP. (B) TEM image of a monocyte cell after 24 h incubation with 11-MUA coated AuNP. (C) CT images of pellets of monocytes that had been labeled with 11-MUA and 4-MB. (D) Quantification of CT attenuation for each AuNP formulation. (E) CT scans of an atherosclerotic mouse before (day 0) and after (day 5) injection with gold labeled monocytes. The boxed area indicates aortic region of interest. (F) Average CT attenuation in the aortas of mice over the study period. Figure reproduced with permission from ref (116).

References

    1. Goodman L. R. (2010) The Beatles, the Nobel Prize, and CT scanning of the chest. Radiol Clin North Am. 48 (1), 1–7. 10.1016/j.rcl.2009.09.008. - DOI - PubMed
    1. Hounsfield G. N. (1973) Computerized transverse axial scanning (tomography). 1. description of system. Br. J. Radiol. 46 (552), 1016–22. 10.1259/0007-1285-46-552-1016. - DOI - PubMed
    1. OECD, Computed tomography (CT) exams (indicator) 2017.
    1. Chakravarty S.; Unold J.; Shuboni-Mulligan D. D.; Blanco-Fernandez B.; Shapiro E. M. (2016) Surface engineering of bismuth nanocrystals to counter dissolution. Nanoscale 8 (27), 13217–22. 10.1039/C6NR02171A. - DOI - PMC - PubMed
    1. Cheheltani R.; Ezzibdeh R. M.; Chhour P.; Pulaparthi K.; Kim J.; Jurcova M.; Hsu J. C.; Blundell C.; Litt H. I.; Ferrari V. A.; et al. (2016) Tunable, biodegradable gold nanoparticles as contrast agents for computed tomography and photoacoustic imaging. Biomaterials 102, 87–97. 10.1016/j.biomaterials.2016.06.015. - DOI - PMC - PubMed

Publication types