. 2017 May 8;31(5):669-684.e7.
doi: 10.1016/j.ccell.2017.04.004.

Hippo Signaling Suppresses Cell Ploidy and Tumorigenesis through Skp2

Affiliations

Hippo Signaling Suppresses Cell Ploidy and Tumorigenesis through Skp2

Shihao Zhang et al. Cancer Cell. .

Abstract

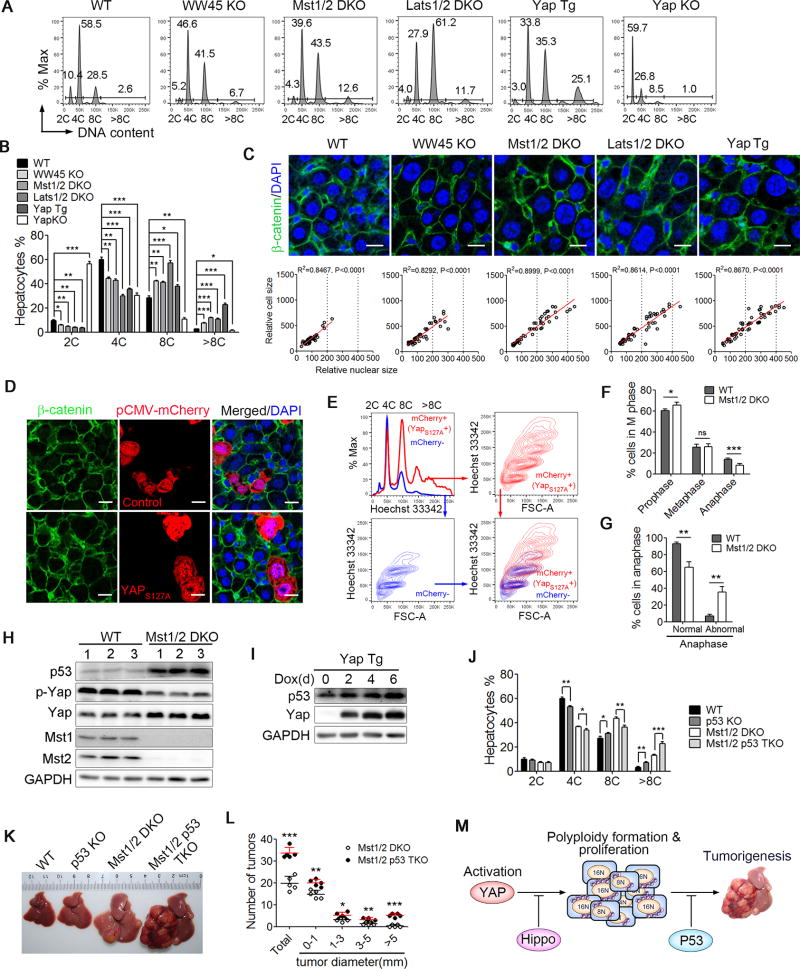
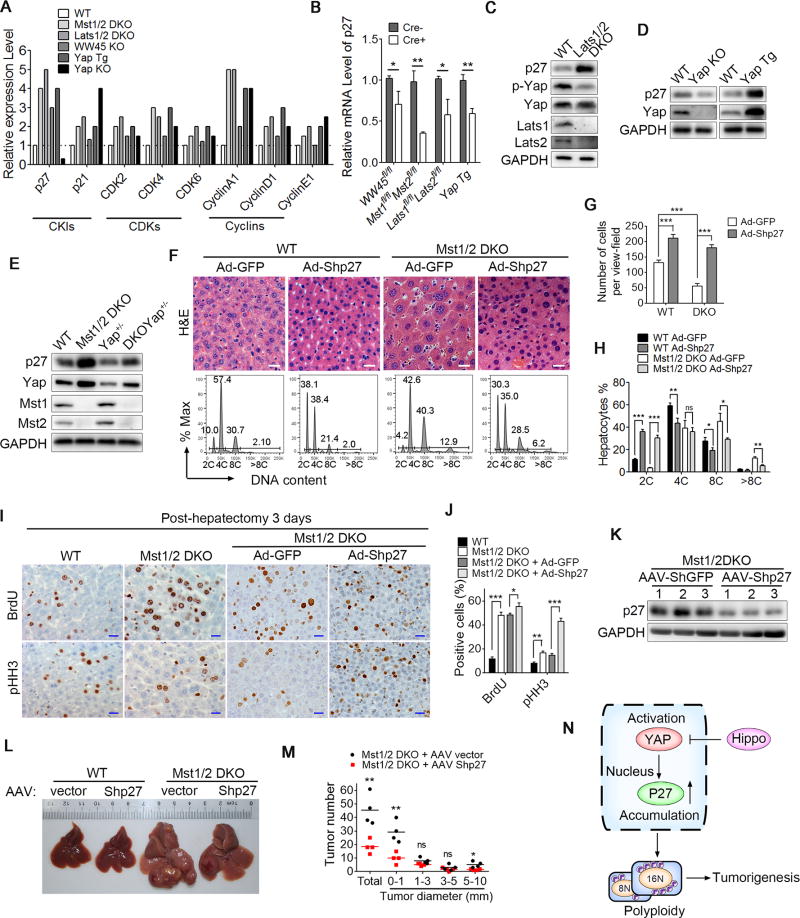
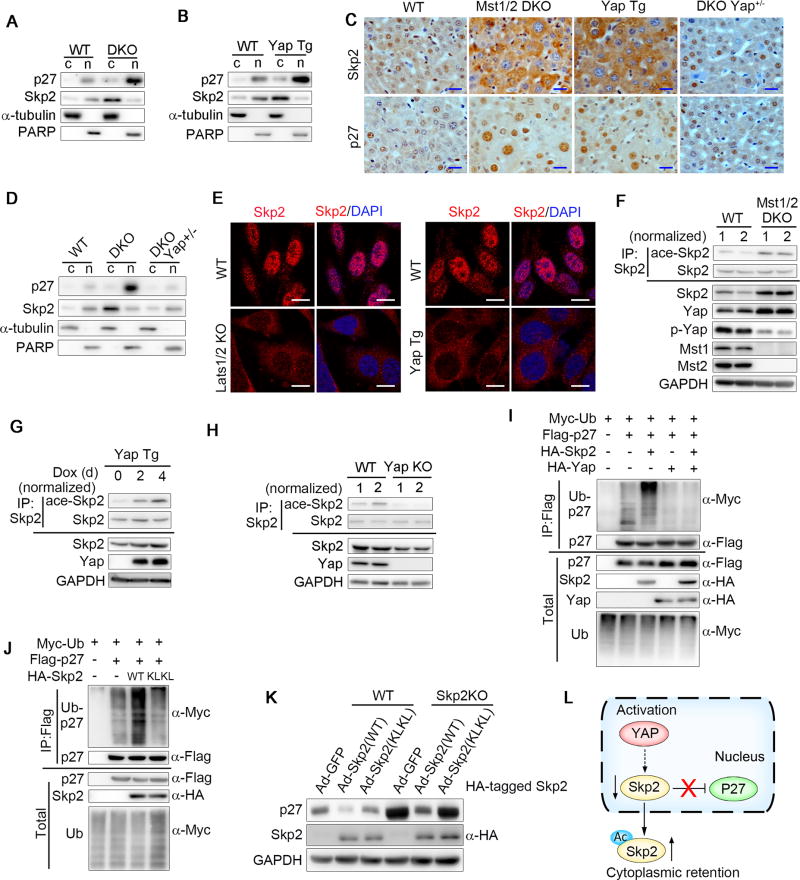
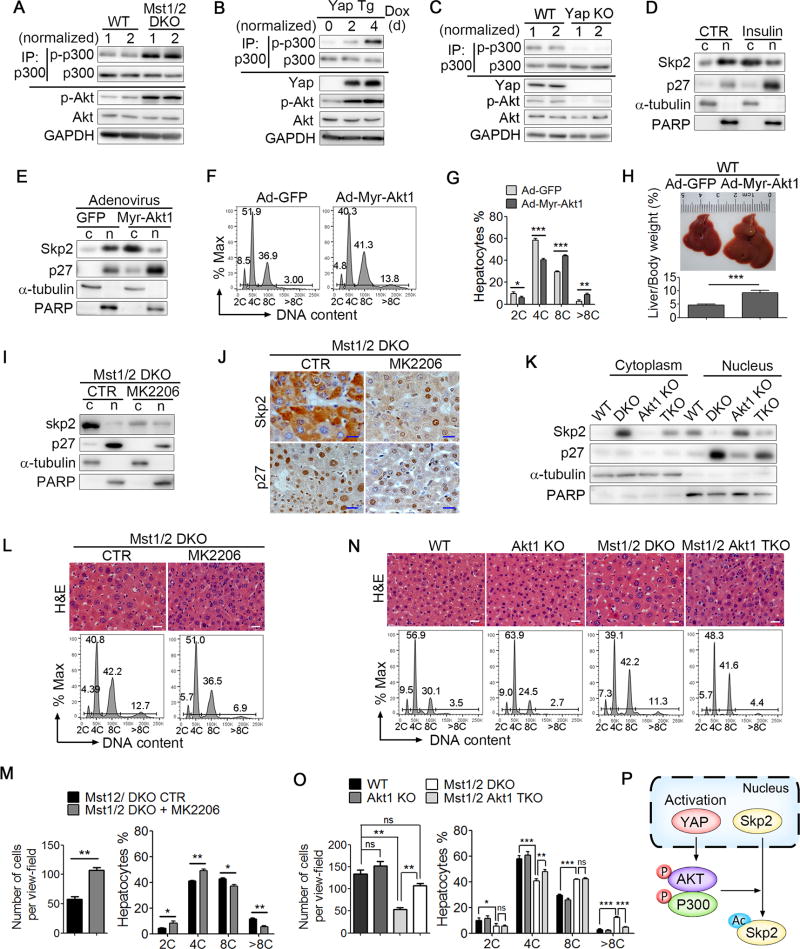
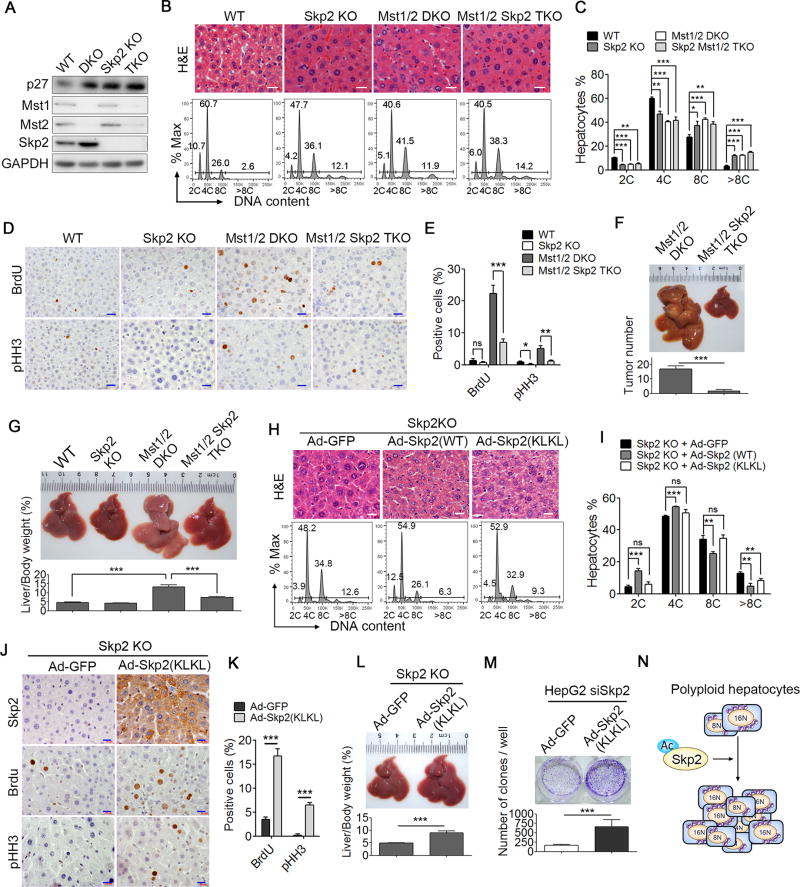
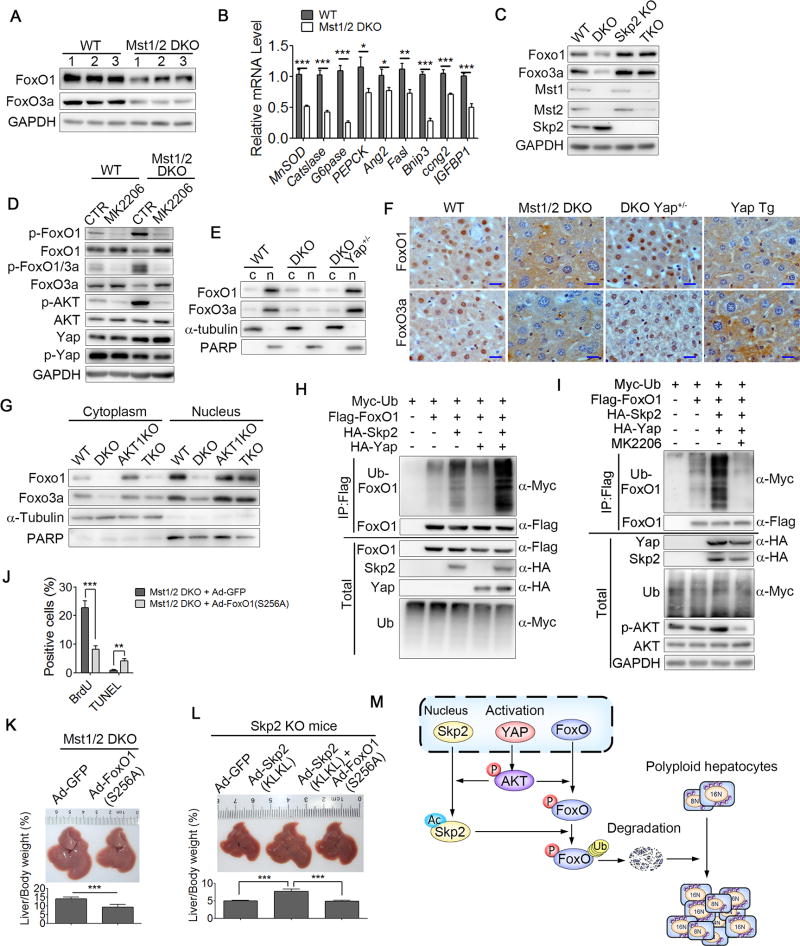
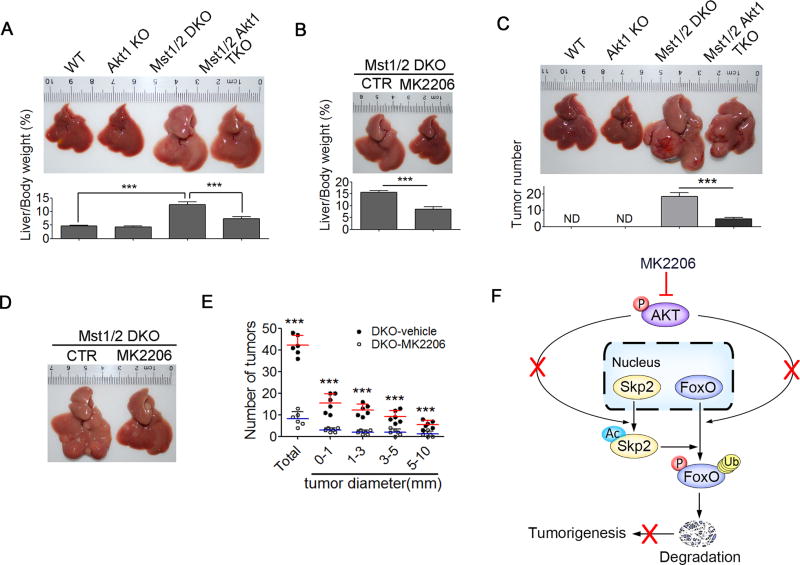
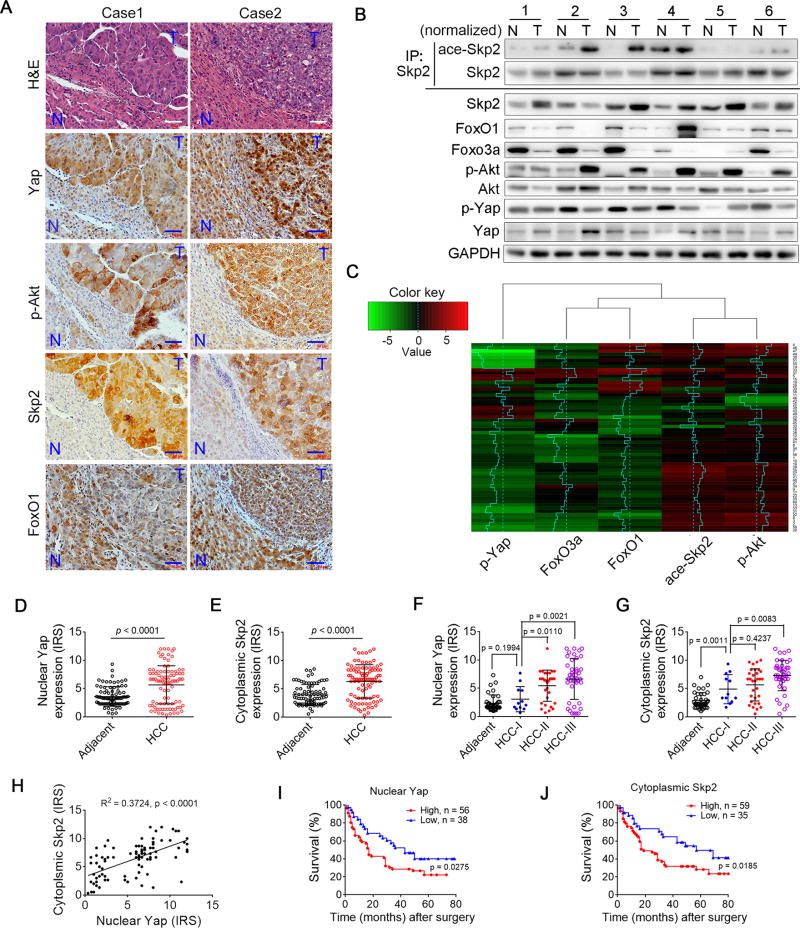
Polyploidy can lead to aneuploidy and tumorigenesis. Here, we report that the Hippo pathway effector Yap promotes the diploid-polyploid conversion and polyploid cell growth through the Akt-Skp2 axis. Yap strongly induces the acetyltransferase p300-mediated acetylation of the E3 ligase Skp2 via Akt signaling. Acetylated Skp2 is exclusively localized to the cytosol, which causes hyper-accumulation of the cyclin-dependent kinase inhibitor p27, leading to mitotic arrest and subsequently cell polyploidy. In addition, the pro-apoptotic factors FoxO1/3 are overly degraded by acetylated Skp2, resulting in polyploid cell division, genomic instability, and oncogenesis. Importantly, the depletion or inactivation of Akt or Skp2 abrogated Hippo signal deficiency-induced liver tumorigenesis, indicating their epistatic interaction. Thus, we conclude that Hippo-Yap signaling suppresses cell polyploidy and oncogenesis through Skp2.

Keywords: Hippo; Skp2; Yap; genomic instability; p27; polyploidy; tumorigenesis.


Figures

Figure 1
Figure 1. Yap activation increases hepatocyte polyploidy and synergizes with p53 inactivation to enhance liver tumorigenesis
(A and B) Fluorescence-activated cell sorting (FACS) analysis (A) and the DNA content quantification (B) of polyploid hepatocytes from wild-type (WT), WW45f/fAlb-Cre (WW45 KO), Mst1f/fMst2f/fAlb-Cre (Mst1/2 DKO), Lats1f/fLats2f/fAlb-Cre (Lats1/2 DKO), Yap (S127A) transgenic (Yap Tg) and Yapf/fAlb-Cre (Yap KO) mice (n = 3). 2C, 4C, 8C and >8C DNA content, corresponding to diploid, tetraploid, octaploid and higher polyploid hepatocytes, respectively. (C) Hepatocytes in liver sections from the indicated genotypes were labeled with DAPI and an antibody against β-catenin. The areas of the cell (cell size) and the DAPI positive compartment (nucleus) were imaged with a Zeiss LSM 780 (upper panel) and quantified using ImageJ software (lower panel). Scale bars: 20 µm. (D and E) The correlation of hepatocyte size and ploidy status from wild-type mice after the hydrodynamic delivery of pCMV-mCherry control or pCMV-mCherry-YapS127A was assessed by immunofluorescent staining (D) and FACS (E) approaches. Scale bars: 20 µm. (F and G) The quantification of the percentage of cells at the different mitotic phases (F) and the percentage of abnormal anaphase cells (G) according H&E and immunohistochemistry (IHC) staining for pHH3 in liver sections. (H) Immunoblot analysis of p53, phosphorylated (p-) Yap, Yap, Mst1, Mst2 and GAPDH in WT or Mst1/2 DKO liver tissues. (I) Immunoblot analysis of p53, Yap and GAPDH in WT or Yap Tg liver tissues. (J) The DNA content quantification of polyploid hepatocytes from WT, Mst1/2 DKO p53KO or Mst1/2 p53 TKO mice using FACS analysis (n = 3). (K) A representative liver picture and the liver-to-body weight ratios (n = 5) of 2 month old WT, Mst1/2 DKO p53KO or Mst1/2 p53 TKO mice. (K and L) A representative liver picture (K) and the quantification of the size and number of liver tumors (n = 5) (L) of 4.5 month old WT, Mst1/2 DKO p53KO or Mst1/2 p53 TKO mice. (M) A proposed working model for Hippo signaling decreases hepatocyte polyploidy and synergizes with p53 to inhibit liver tumorigenesis. Data were assessed by Student’s t-test and represented as mean ± SD ns, no significant, *p < 0.05, **p < 0.01, ***p < 0.001 compared between indicated groups. See also Figure S1.
Figure 2
Figure 2. Loss of Hippo signaling resulted in the accumulation of p27 leading to polyploidy
(A) The quantification of the relative protein expression levels of cell cycle related proteins p27, p21, CDK2, CDK4, CDK6, Cyclin A1, Cyclin D1 and Cyclin E1 in livers from the indicated mouse strains with a liver-specific mutation of the Hippo signaling components. (B) Quantitative PCR analysis of the p27 mRNA expression in hepatocytes from the indicated liver-specific mutant mice. (C) Immunoblot analysis of p27, p-Yap, Yap, Lats1, Lats2 and GAPDH in WT or Lats1/2 DKO MEFs. (D) Immunoblot analysis of p27, Yap and GAPDH in WT, Yap Tg or Yap KO control liver tissues. (E) Immunoblot analysis of p27, Yap, Mst1, Mst2 and GAPDH in WT, Mst1/2 DKO, Yap+/flAlb-Cre (YAP+/−) or Mst1f/fMst2f/fYap+/flAlb-Cre (DKO Yap+/−) liver tissues. (F–H) H&E staining of liver sections (F, upper panel) and the quantification of cell number per viewfield (G) or the DNA content quantification (F, lower panel and H) of polyploid hepatocytes by FACS from WT or Mst1/2 DKO mice infected with either adenovirus expressing a GFP control vector (Ad-GFP) or p27-knock-down shRNA (Ad-Shp27) as indicated (n = 3). Scale bars: 20 µm. (I and J) IHC staining of BrdU or pHH3 in the liver sections from WT, Mst1/2 DKO, or Mst1/2 DKO mice infected with either Ad-GFP or Ad-Shp27 as indicated after partial hepatectomy (I). The bar graph shows the quantifications of BrdU- or pHH3-positive cells in the livers (n = 3) (J). Scale bars: 20 µm. (K) Immunoblot analysis of the p27 levels in the livers from Mst1/2 DKO mice infected with adeno-associated virus (AAV) expressing control GFP or p27 shRNA. (L and M) A representative liver picture (L) and the quantification of the size and number of liver tumors in 4.5 month old Mst1/2 DKO mice (n = 4) infected with AAV-GFP or AAV-Shp27. (N) A proposed working model for Yap activation promoting nuclear accumulation of p27 resulted in increased polyploidy and tumor formation. Data were assessed by Student’s t-test and represented as mean ± SD *p < 0.05, **p < 0.01, ***p < 0.001 compared between the indicated groups. See also Figure S2.
Figure 3
Figure 3. Loss of Hippo signaling enhances the cytoplasmic retention of Skp2
(A and B) Immunoblot analysis of p27, Skp2, α-tubulin or PARP in the cytoplasmic (c) and nuclear (n) fractions of WT, Mst1/2 DKO (A) or Yap Tg (B) liver tissues. (C and D) IHC staining (C) or immunoblot analysis of the cell fractions (D) of Skp2 and p27 in liver tissues from WT, Mst1/2 DKO, Mst1f/fMst2f/fYap+/flAlb-Cre (DKO Yap+/−) or Yap Tg mice. Scale bars: 20 µm. (E) Immunofluorescent staining of Skp2 (red) and the nuclear counterstain (DAPI, blue) in primary MEFs isolated from WT, Lats1/2 KO (left panel) or Yap Tg (right panel) mice. Scale bars: 10 µm. (F–H) Immunoblot analysis of acetylated (ace-) Skp2, Skp2,p-Yap, Yap, Mst1, Mst2 and GAPDH in the immunoprecipitates or total lysates of hepatocytes isolated from WT, Mst1/2 DKO (F), Yap Tg (G), or Yap KO (H) mice. For the detection of ace-Skp2, the loading of the immunoprecipitates was normalized according to the levels of total Skp2. (I and J) Immunoassay assessing the ubiquitination of p27 (detected with anti-Myc) in the lysates of 293T cells expressing various combinations of Myc-tagged ubiquitin, Flag-tagged p27, HA-tagged Yap and HA-tagged WT Skp2 (I) or an acetylation-mimetic (KLKL) mutant form of Skp2 (J) as indicated. (K) Immunoblot analysis of Skp2, p27 and GAPDH in liver tissues from WT and Skp2 KO mice infected with Ad-GFP, Ad-Skp2 (WT) or Ad-Skp2 (KLKL). (L) A proposed working model for Yap activation regulating p27 stability through modulating Skp2 acetylation and sub-cellular localization. See also Figure S3.
Figure 4
Figure 4. Yap regulates Skp2 cytoplasmic retention via Akt-p300 axis
(A–C) Immunoblot analysis of p-p300, p300, p-Akt, Akt, Yap or GAPDH in the immunoprecipitates or total lysates of hepatocytes isolated from WT, Mst1/2 DKO (A), Yap Tg (B) or Yap KO (C) mice. For the detection of the p-p300 levels, the loading of the immunoprecipitates was normalized according to the levels of total p300. (D and E) Immunoblot analysis of p27, Skp2, α-tubulin or PARP in the cytoplasmic (c) and nuclear (n) fractions of liver cells isolated from mice treated with vehicle or insulin (D) or mice infected with Ad-GFP or Ad-Myr-Akt1 (active Akt1) (E). (F and G) FACS analysis (F) and the DNA content quantification (G) of ploidy hepatocytes from WT mice infected with Ad-GFP or Ad-Myr-Akt1 (n = 3). (H) A representative liver picture and the liver-to-body weight ratios of WT mice (n = 5) infected with Ad-GFP or Ad-Myr-Akt1. (I and J) Immunoblot analysis of the cell fractions (I) or IHC staining (J) of Skp2 and p27 from liver tissues isolated from Mst1/2 DKO mice treated with vehicle or the Akt inhibitor MK2206. Scale bars: 20 µm. (K) Immunoblot analysis of Skp2, p27, α-tubulin or PARP in the cytoplasmic and nuclear fractions of liver tissues from WT, Akt1 KO, Mst1/2 DKO or Mst1f/fMst2f/fAkt1 KO Alb-Cre (TKO) mice. (L–O) H&E staining of liver sections (L and N, upper panel), the quantification of cell number per viewfield (M and O) or the DNA content quantification by FACS (L and N, lower panel, M and O) of polyploid hepatocytes from Mst1/2 DKO mice treated with the Akt inhibitor MK2206 (n = 3) (L and M) or from WT, Akt1 KO, Mst1/2 DKO or Mst1/2 Akt1 TKO mice (n = 3) (N and O). Scale bars: 20 µm. (P) A proposed working model for Yap activation modulating Skp2 acetylation and sub-cellular localization via Akt-P300 signaling. Data were assessed by Student’s t-test and represented as mean ± SD ns, no significant (p > 0.05), *p < 0.05; **p < 0.01; ***p < 0.001 compared between the indicated groups. See also Figure S4.
Figure 5
Figure 5. Cytoplasmic Skp2 promotes polyploid cell division
(A) Immunoblot analysis of p27, Skp2, Mst1, Mst2 and GAPDH in liver lysates of WT, Skp2 KO, Mst1/2 DKO, Mst1f/fMst2f/fSkp2 KO Alb-Cre (Mst1/2 Skp2 TKO) mice. (B and C) H&E staining of the liver sections (B, upper panel) and the DNA content quantification of hepatocytes of the indicated mice using FACS (n = 3) (B, lower panel, and C). Scale bars: 20 µm. (D and E) IHC staining (D) and the quantification (E) of BrdU- or pHH3-positive cells in the liver sections from the indicated mice. Scale bars: 20 µm. (F and G) A representative liver picture and the liver-to-body weight ratios (n = 5, 3 months old, F) and the quantification of liver tumors (n = 5, 5 months old, G) of the indicated mice. (H and I) H&E staining of the liver sections from Skp2 KO mice infected with Ad-GFP, Ad-Skp2 (WT) or Ad-Skp2 (KLKL) (H, upper panel) and the DNA content quantification of hepatocytes from the indicated mice using FACS (n = 3) (H, lower panel and I). Scale bars: 20 µm. (J and K) IHC staining of BrdU or pHH3 (J) and the quantification of BrdU- or pHH3-positive cells (K) in liver sections from Skp2 KO mice infected with adenovirus Ad-GFP or Ad-Skp2 (KLKL) (n = 3). Scale bars: 20 µm. (L) The representative liver sizes and liver-to-body weight ratios (n = 5) of Skp2 KO mice infected with Ad-GFP or AD-Skp2 (KLKL). (M) A representative image of the clonogenic assay and the quantification of clones per well for Skp2-knockedg down HepG2 cells infected with Ad-GFP or Ad-Skp2 (KLKL). (N) A proposed working model for acetylated Skp2 promoting polyploidy cell proliferation. Data were assessed by Student’s t-test and represented as mean ± SD ns, no significant (p > 0.05), *p < 0.05, **p < 0.01, ***p < 0.001 compared between the indicated groups. See also Figure S5.
Figure 6
Figure 6. Yap promotes polyploid cell division via Skp2-mediated FoxO degradation
(A and B) Immunoblot analysis of FoxO1, FoxO3a and GAPDH (A) and quantitative PCR analysis of FoxO target genes (B) in liver of WT or Mst1/2 DKO mice. (C) Immunoblot analysis of FoxO1, FoxO3a, Mst1, Mst2, Skp2 and GAPDH in WT, Mst1/2 DKO, Skp2 KO or Mst1f/fMst2f/fSkp2 KO Alb-Cre (TKO) liver lysates. (D) Immunoblot analysis of p-FoxO1 (S256), p-FoxO1/3 (T24/T32), p-Akt, p-Yap, FoxO1, FoxO3a, Akt, Yap and GAPDH in liver lysates of WT or Mst1/2 DKO mice treated with vehicle control (CTR) or Akt inhibitor MK2206. (E and F) Immunoblot analysis of the cell fractions (E) or IHC staining (F) of FoxO1 or FoxO3a of liver cells from WT, Mst1/2 DKO, Mst1f/fMst2f/fYAP+/flAlb-Cre (DKO Yap+/−) or Yap Tg mice. Scale bars: 20 µm. (G) Immunoblot analysis of FoxO1, FoxO3a, α-tubulin or PARP in the cytoplasmic and nuclear fractions of WT, Mst1/2 DKO, Akt1 KO or Mst1/2 Akt1 TKO liver tissues. (H and I) Immunoassay of the ubiquitination of FoxO1 (detected with anti-Myc) in the lysates of 293T cells expressing various combinations of Myc-tagged ubiquitin, Flag-tagged FoxO1, HA-tagged Yap and HA-tagged Skp2 (H) with or without Akt inhibitor MK2206 treatment (J) Quantification of BrdU or TUNEL-positive cells in the liver sections from Mst1/2 DKO mice infected with Ad-GFP or Ad-Foxo1(S256A) (n = 3). (K and L) The representative liver sizes and liver-to-body weight ratios of Mst1/2 DKO infected with adenovirus Ad-GFP or Ad-FoxO1(S256A) (n = 5) (K) or Skp2 KO mice infected with adenovirus Ad-GFP, Ad-FoxO1(S256A), Ad-Skp2(KLKL) or Ad-FoxO1(S256A) plus Ad-Skp2(KLKL) (n = 5) (L). (M) A proposed working model for Yap promoting polyploid cell division via Skp2-mediated FoxO degradation. Data were assessed by Student’s t-test and represented as mean ± SD *p < 0.05, **p < 0.01, ***p < 0.001 compared between the indicated groups. See also Figure S6.
Figure 7
Figure 7. Disruption of Akt function attenuates liver tumor formation in Mst1/2 DKO mice
(A and B) Representative liver pictures and the liver-to-body weight ratios of Mst1/2 DKO mice treated with the Akt inhibitor MK2206 (n = 5) (A) or of WT, Akt1 KO, Mst1/2 DKO, Mst1/2 Akt1 TKO mice (n = 5) (B). (C) A representative liver picture and the quantification of tumor number from WT, Akt1 KO, Mst1/2 DKO, Mst1/2 Akt1 TKO mice (n = 6). (D and E) A representative liver picture and the quantification of the size and number of liver tumors (n = 6) of 5 month old Mst1/2 DKO mice treated with vehicle or the Akt inhibitor MK2206. (F) A proposed working model for the disruption of Akt function attenuating liver tumor formation in Mst1/2 DKO mice. Data were assessed by Student’s t-test and represented as mean ± SD, ***p < 0.001 compared between the indicated groups. ND, non-detectable.
Figure 8
Figure 8. Yap-Akt-Skp2 signal is implicated in human HCC progress
(A) A representative image of H&E staining and the IHC analysis of p-Yap, p-Akt, Skp2 or FoxO1 in the liver sections of adjacent non-tumorous livers (N) or HCC tissues (T) isolated from one patient. Scale bars: 50 µm. (B and C) Western blot analysis of ace-Skp2, Skp2, FoxO1, FoxO3a, p-Akt, Akt, p-Yap, Yap and GAPDH in HCC tissue (T) and adjacent non-tumorous liver tissue (N) isolated from one patient. Six representative paired samples are shown (B). See Supplementary Figure S7A for the remaining 54 paired samples. For the detection of ace-Skp2, the loading of immunoprecipitates was normalized according to the levels of total Skp2. The intensities of the immunoblot bands were quantified using the ImageJsoftware. A heatmap representation of the ratio of the relative expression of the proteins p-Yap, Foxo3a, Foxo1, ace-Skp2 or p-Akt in the T and N samples from one patient. Clustering was performed by using Pearson correlation metric and centroid linkage (C). (D–G) Scatter plot analysis of the immunoreactive score (IRS) of the nuclear Yap (D and F) or the cytoplasmic skp2 (E and G) inpaired liver cancer and adjacent non-cancer paraffin tissue sections or in different tumor stages from the tissue microarray of human liver cancer. IRS scores of 0–1 indicate negative; scores of 2–3 indicate mild; scores of 4–8 indicate moderate; scores of 9–12 indicate strongly positive. A total of 94 paired samples are shown. The data were assessed by Student’s t-test and are represented as the mean ± SD (H) The IRS of nuclear Yap and the cytoplasmic Skp2 of liver cancer sections from the tissue microarray of human liver cancer was plotted and assessed using a linear regression t-test. (I and J) Kaplan-meier plot of overall survival of patients with HCC stratified by high IRS (>6) or low IRS (<6) of nuclear Yap (I) or cytoplasmic Skp2 (J) expression levels. A log-rank test is used for statistical analysis. See also Figure S7.

Similar articles

Cited by

References

    1. Aylon Y, Michael D, Shmueli A, Yabuta N, Nojima H, Oren M. A positive feedback loop between the p53 and Lats2 tumor suppressors prevents tetraploidization. Genes & development. 2006;20:2687–2700. - PMC - PubMed
    1. Beer S, Zetterberg A, Ihrie RA, McTaggart RA, Yang Q, Bradon N, Arvanitis C, Attardi LD, Feng S, Ruebner B, et al. Developmental context determines latency of MYC-induced tumorigenesis. PLoS biology. 2004;2:e332. - PMC - PubMed
    1. Calvisi DF, Ladu S, Pinna F, Frau M, Tomasi ML, Sini M, Simile MM, Bonelli P, Muroni MR, Seddaiu MA, et al. SKP2 and CKS1 promote degradation of cell cycle regulators and are associated with hepatocellular carcinoma prognosis. Gastroenterology. 2009;137:1816–1826. e1811–1810. - PubMed
    1. Camargo FD, Gokhale S, Johnnidis JB, Fu D, Bell GW, Jaenisch R, Brummelkamp TR. YAP1 increases organ size and expands undifferentiated progenitor cells. Current biology : CB. 2007;17:2054–2060. - PubMed
    1. Carrano AC, Eytan E, Hershko A, Pagano M. SKP2 is required for ubiquitin-mediated degradation of the CDK inhibitor p27. Nature cell biology. 1999;1:193–199. - PubMed

MeSH terms