. 2017 May 8;31(5):711-723.e4.
doi: 10.1016/j.ccell.2017.04.003.

Tumor-Residing Batf3 Dendritic Cells Are Required for Effector T Cell Trafficking and Adoptive T Cell Therapy

Affiliations

Tumor-Residing Batf3 Dendritic Cells Are Required for Effector T Cell Trafficking and Adoptive T Cell Therapy

Stefani Spranger et al. Cancer Cell. .

Abstract

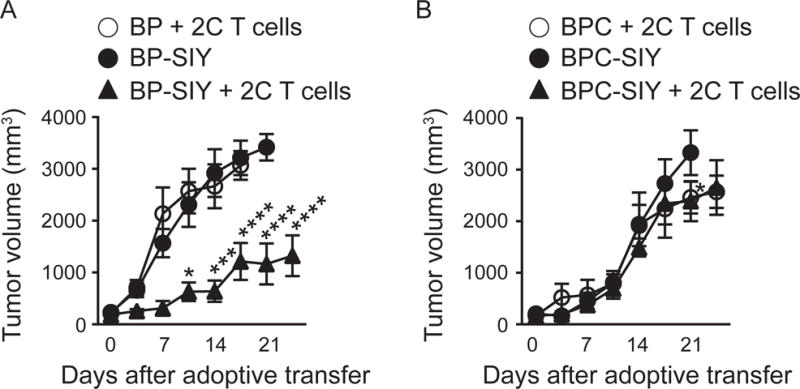
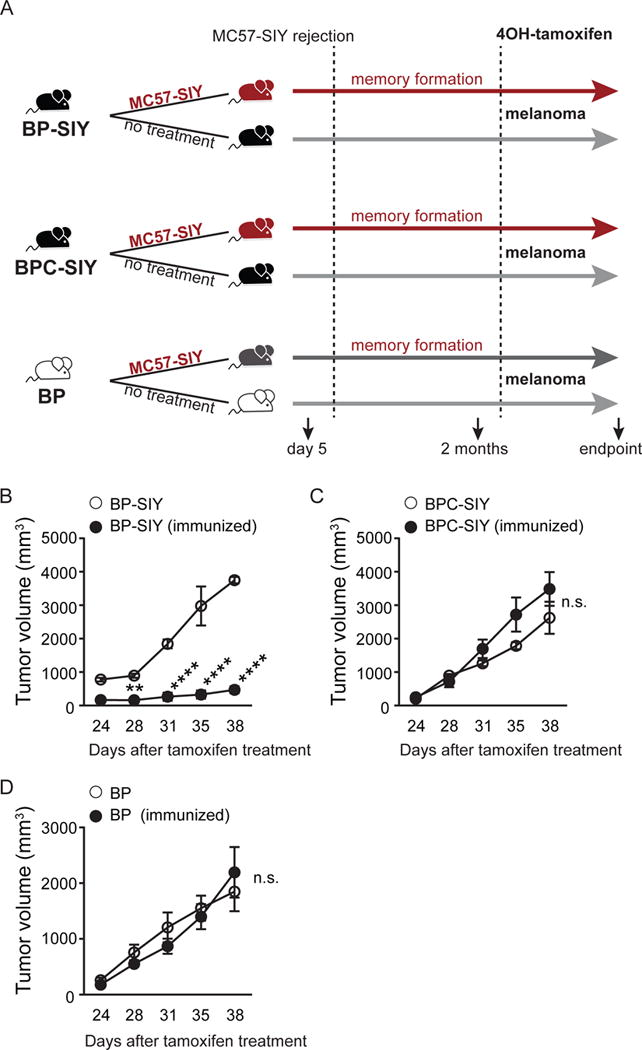
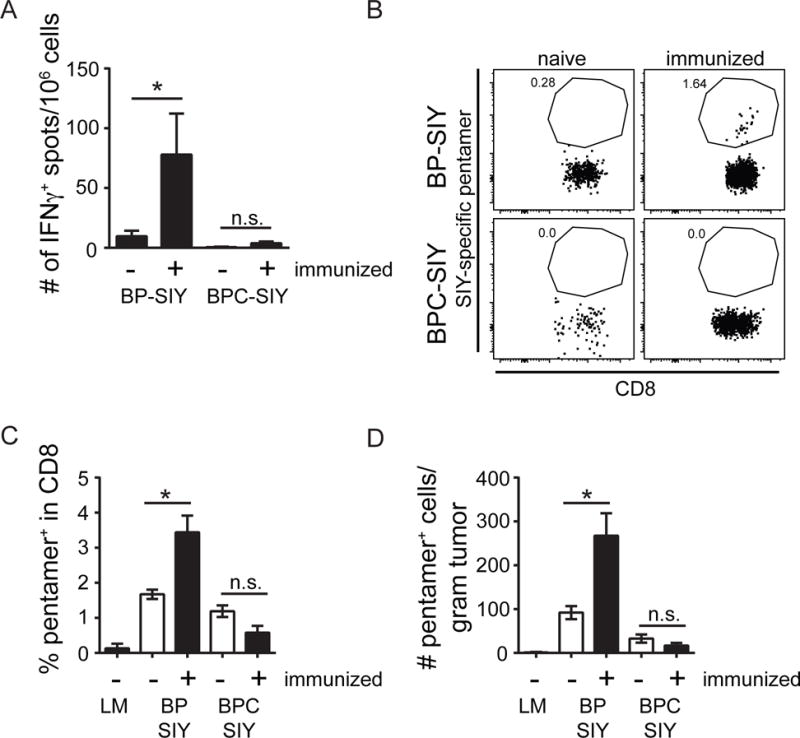
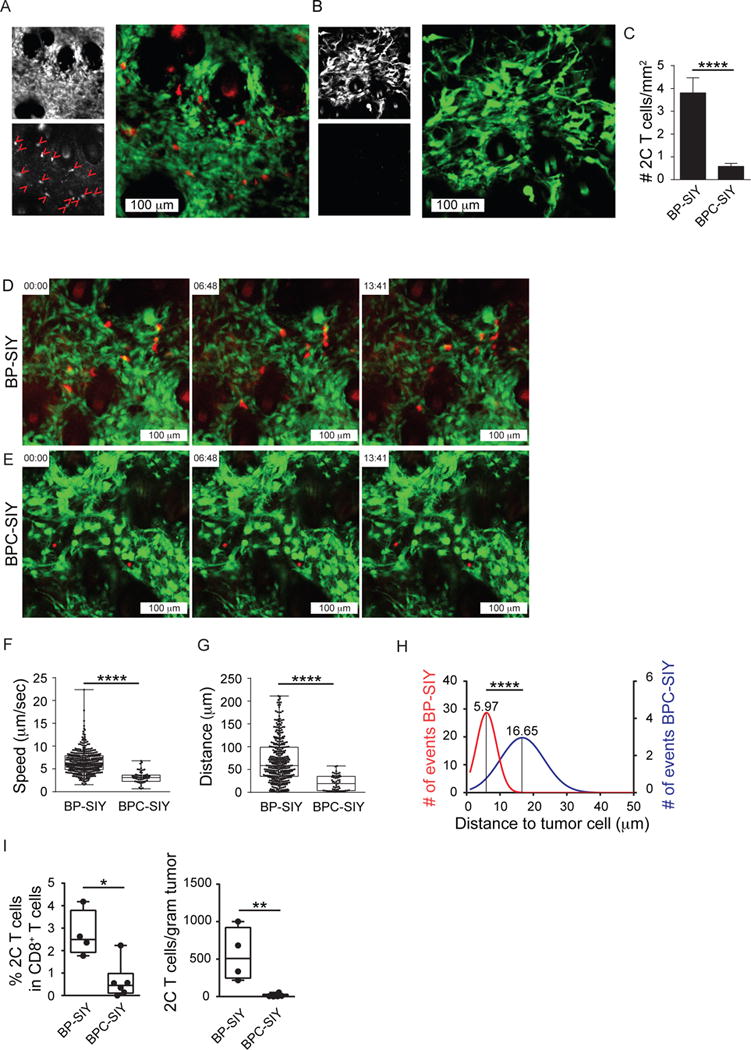
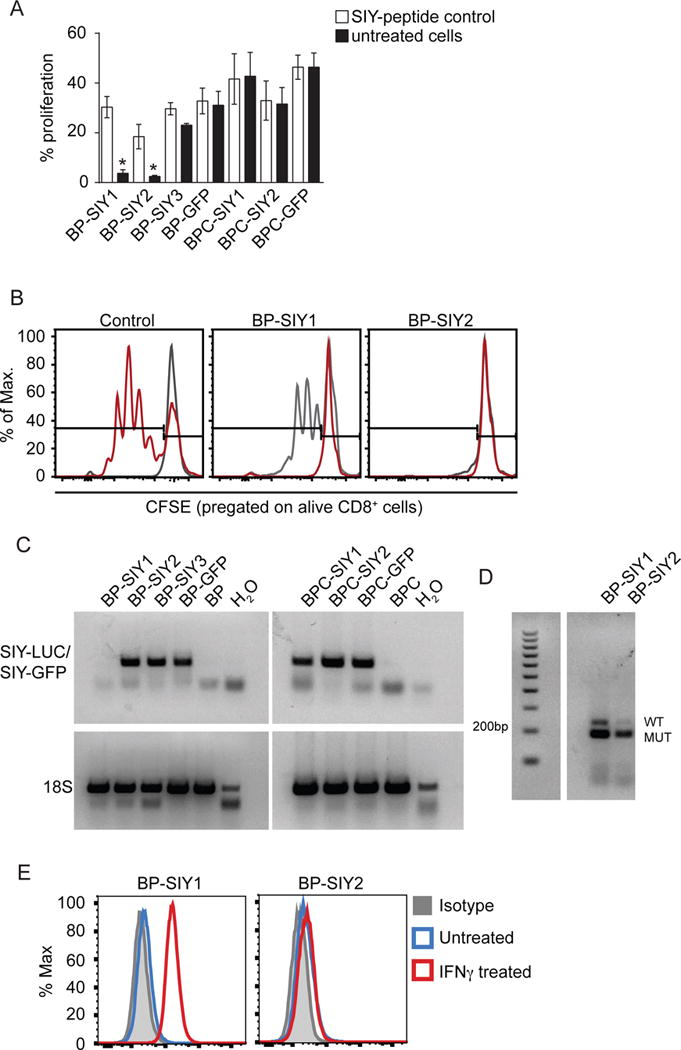
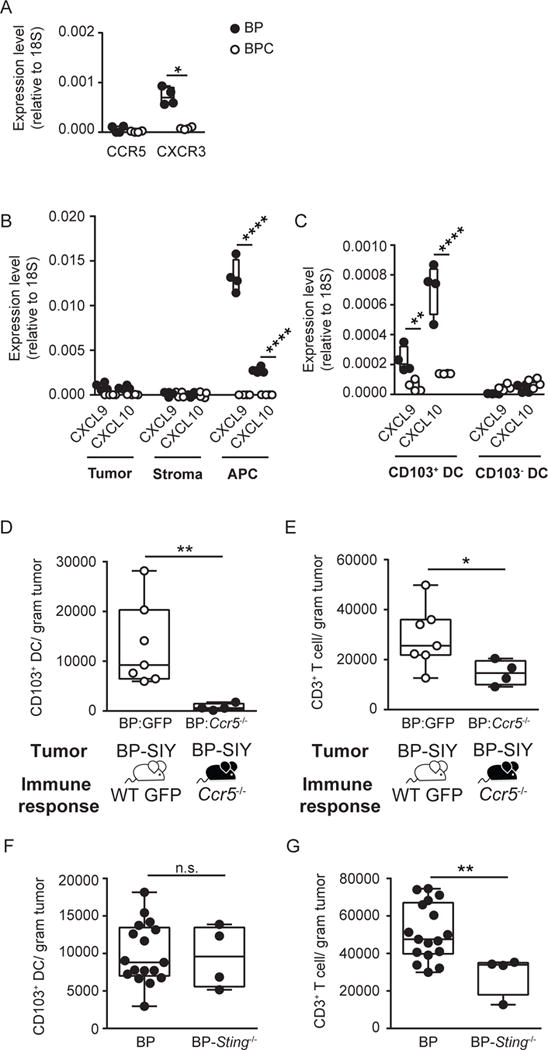
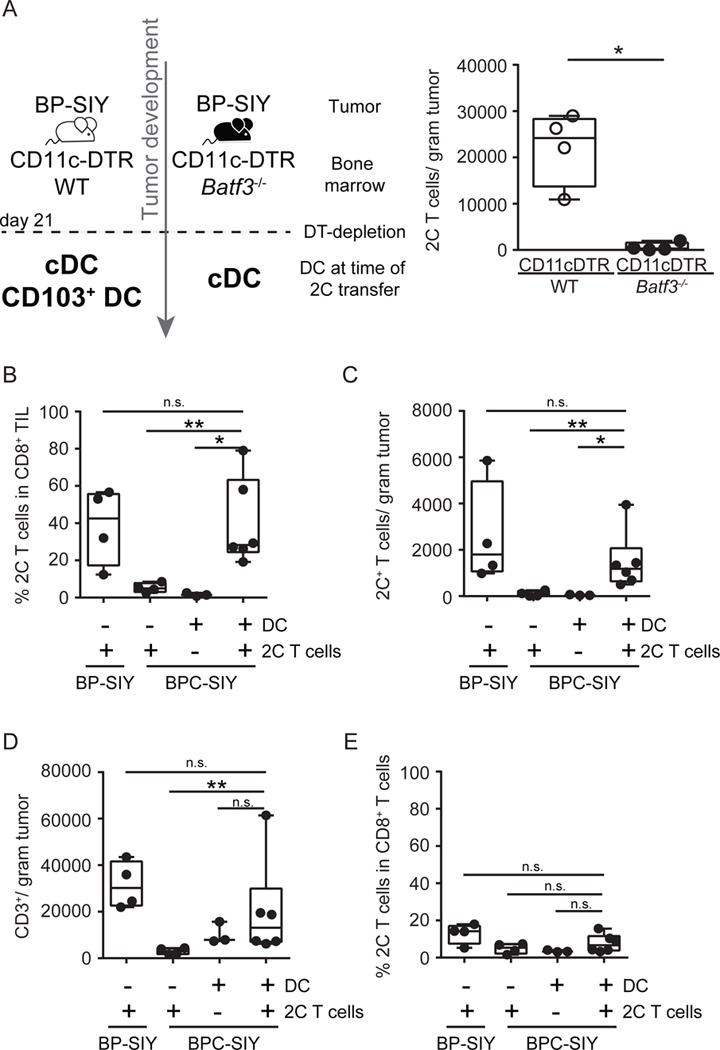
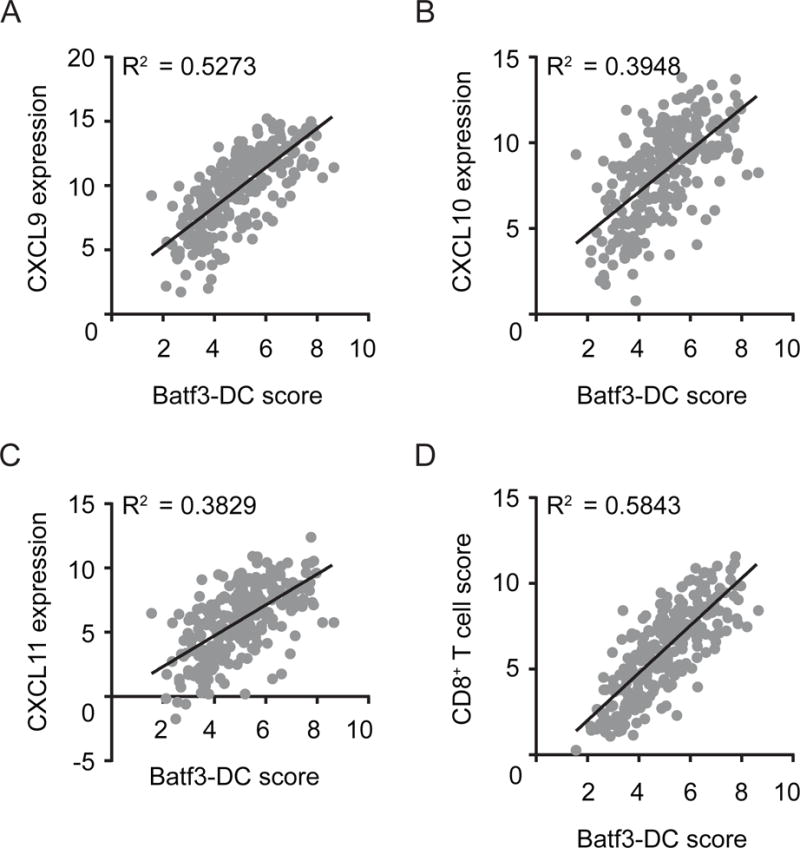
Effector T cells have the capability of recognizing and killing cancer cells. However, whether tumors can become immune resistant through exclusion of effector T cells from the tumor microenvironment is not known. By using a tumor model resembling non-T cell-inflamed human tumors, we assessed whether adoptive T cell transfer might overcome failed spontaneous priming. Flow cytometric assays combined with intra-vital imaging indicated failed trafficking of effector T cells into tumors. Mechanistically, this was due to the absence of CXCL9/10, which we found to be produced by CD103+ dendritic cells (DCs) in T cell-inflamed tumors. Our data indicate that lack of CD103+ DCs within the tumor microenvironment dominantly resists the effector phase of an anti-tumor T cell response, contributing to immune escape.

Keywords: T cell-inflamed tumor microenvironment; adoptive T cell transfer; immune escape; immunotherapy resistance; non-T cell-inflamed tumor microenvironment.


Conflict of interest statement

Conflict of interest

The authors declare no conflict of interest.

Figures

Figure 1
Figure 1. Adoptively transferred SIY-specific TCR-transgenic effector T cells only control BP-SIY tumor and not BPC-SIY tumors
(A, B) Tumor outgrowth curves of untreated BP-SIY (A) and BPC-SIY (B) tumor (filled circle) or after adoptive transfer of 10×106 2C T cells (filled triangle). As controls, antigen-negative BP and BPC mice were treated with the same number of 2C T cells (open symbols). Adoptive transfer was performed at day 21 post-TAM application. Shown are mean with SEM, significance was assessed using a two-sided Anova, n = 2, 8, 8 (BP+2C, BP-SIY, BP-SIY+2C) and n = 4, 8, 6 (BCP+2C, BCP-SIY, BCP-SIY+2C), data are pooled out of two independent experiments. Significance was assumed with p ≤ 0.05, with * ≤ 0.05, *** ≤ 0.001 **** ≤ 0.0001.
Figure 2
Figure 2. Pre-existing immunological memory increases tumor control in BP-SIY mice but not in BPC-SIY mice in an antigen-dependent manner
(A) Schematic of experimental procedure to induce immunological memory against tumor-derived SIY. All mice were housed for equal times and were 6–8 weeks of age at the beginning of the experiment. Mice were treated with TAM 2 months after complete rejection of the primary MC57-SIY tumor. At day 24 post-TAM treatment, tumor growth of the autochthonous tumor was assessed until the experimental endpoint was reached. (B–D) Growth of tumors in naive or MC57-SIY immunized BP-SIY (B), BPC-SIY (C), and BP (D) mice as shown in (A). Given are mean with SEM, significance was determined using a two-sided Anova test, n = (B) 4 and 7, (C) 4 and 8, (D) 4 and 4 (naive/immunized) pooled out of two independent experiments. Significance was assumed with p ≤ 0.05, with ** ≤ 0.01; **** ≤ 0.0001. See also Figure S1.
Figure 3
Figure 3. Increased tumor control in BP-SIY tumor is associated with reactivation of a peripheral memory T cell response and increased infiltration of antigen-specific T cells into the TME
(A) IFN-γ ELISpot assessing the number of SIY-specific IFN-γ production by splenocytes isolated at the end point of the experiment shown in Figure 2. (B–D) The number of antigen-specific cells within the TME assessed though SIY-specific pentamer staining. A representative example of the pentamer staining (B), the percent within the CD8 T cell compartment (C), and the absolute number of SIY-reactive T cells per gram tumor (D) in immunized and non-immunized BP-SIY and BPC-SIY tumors at the endpoint of the experiment. Shown are mean with SEM and n numbers are corresponding to the experiment shown in Figure 2. The tumor weight at time of analysis was 1.65 g ± 0.13 g for BP, 0.9 g ± 0.56 g for BP-SIY and 1.76 g ± 0.19 g for BPC-SIY (mean ± SD). Significance was assumed with p ≤ 0.05, with * ≤ 0.05. See also Figure S2.
Figure 4
Figure 4. Effector T cells associated with BP-SIY tumors show enhanced motility and interaction with tumor cells compared to T cells infiltrating BPC-SIY tumors
(A, B) Representative images depicting tumor (YFP) and adoptively transferred 2C T cells (deep red) as single channel and merge of BP-SIY tumor (A) and BPC-SIY tumor (B). T cells are highlighted in the red channel with red arrowheads (16 in BP-SIY vs. 0 in BPC-SIY). (C) Numbers of adoptively transferred effector 2C T cells assessed in BP-SIY and BCP-SIY tumors 72 hr post transfer (total of 20 field of view/ genotype were analyzed from 3 independent experiments). Data are shown as mean with SEM. (D, E) Representative images selected from Movie 1 showing 2C effector T cell migrating in BP-SIY (D) or BPC-SIY (E) tumors. (F, G) Velocity (speed, μm/sec) (F) and displacement (distance, μm) (G) of tumor-infiltrating effector 2C T cells assessed 48–72 hr post adoptive transfer (n= 357 (BP-SIY) and 55 (BPC-SIY), pooled out of 20 movies obtained from 3 independent experiments, shown are mean with 95th percentile). (H) Histogram of mean distance between T cell (center) and nearest tumor cell (edge), interaction larger the 50 μm were disregarded (n= 126 (BP-SIY) and 96 (BPC-SIY), pooled out of 40 images obtained from 3 independent experiments). (I) The amount of detectable 2C T cells within the tumor 3 days post adoptive transfer of 1×10⁶ in vitro activated T cells. Left panel shown percent within CD8 T cells and right panel depicts amount total 2C T cells per gram tumor. Box plots show median with 95th percentile, maximal deviation shown by error bars, n = 4 and 6 for BP-SIY and BPC-SIY, respectfully. The tumor weight at time of analysis was 1.65 g ± 0.16 g for BP-SIY and 1.46g ± 0.2 g for BPC-SIY (mean ± SD). Significance was assumed with p ≤ 0.05, with * ≤ 0.05; ** ≤ 0.01; **** ≤ 0.0001. See also Figure S3 and Movies S1–S3.
Figure 5
Figure 5. Immune surveillance results in a loss of immunogenicity in β-catenin-negative tumor cells but not in β-catenin-positive tumor cells
(A) The immune-stimulatory capacity (proliferation) of tumor cell lines isolated from MC57-SIY immunized BP-SIY and BPC-SIY tumor bearing mice. Immune stimulatory potential was assessed by measuring T cell proliferation in a co-culture assay of CFSE-labeled 2C TCR transgenic T cells and untreated or SIY-peptide pulsed tumor cells. We used tumor cells isolated from antigen negative mice transduced with GFP-SIY constructs (here shown as BP-/BPC-GFP) as positive control (data are given as mean with SEM and significance was assumed with p ≤ 0.05, with * ≤ 0.05, n = 8, pooled from two independent experiments). (B) Representative examples of histograms depicting CFSE dilution for control (gray unstimulated, red transduced BP cell lines) and the two cell lines shown defective T cell stimulation. (C) RT-PCR analysis assessing the SIY-mRNA levels in the cell lines used in (A) (representative for two independent experiments). (D) Genotyping PCR confirming the presence of the SIY-LUC transgene in the BP-SIY1 cell line (WT band 235 base pairs, SIY-mutation 190 base pairs). (E) Representative histogram assessing the expression profile of MHC-I on the surface of untreated (blue) or IFN-γ-treated (red) BP-SIY1 and BP-SIY2 cell lines.
Figure 6
Figure 6. CXCR3-CXCL9/10 chemokine axis and the presence of CD103+ dendritic cells are associated with the presence of T cells in the TME
(A) Expression level of chemokine receptors CCR5 and CXCR3 on tumor-infiltrating T cells isolated from BP (filled) and BPC (open) tumors. Expression was assessed on T cells isolated from two tumors per data point via quantitative real-time PCR and normalized to 18S (n = 4; data are pooled out of two independent experiments). The tumor weight at time of analysis was 1.5 g ± 0.15 g for BP and 1.8 g ± 0.28 g for BPC (mean ± SD). (B, C) Expression level of CXCL9 and CXCL10 in tumor (CD45, YFP+), stroma (CD45, YFP) and ACP (CD45+, MHCII+, CD11c+) (B) and on CD103+ and CD103 DC (MHCII+, CD11c+, CD103/CD8α) (C) isolated from BP (filled) and BPC (open) tumors (n =4; data are pooled out of two independent experiments). The tumor weight at time of analysis across all experiments was 1.4 g ± 0.1 g for BP and 2 g ± 0.14 g for BPC (mean ± SD). (D, E) Ccr5−/− (black circles) and control (GFP, grey circles) bone marrow chimeras with BP hosts were generated and following tumor induction the amount of tumor infiltrating CD103+ DC (D) and CD3+ T cells (E) were assessed and are depicted as number /gram tumor (n = 7 and 4; data are pooled out of two independent experiments). The tumor weight at time of analysis was 0.7 g ± 0.08 g for control chimeras and 0.8 g ± 0.2 g for Ccr5−/− chimeras. (F, G) Absolute amount of CD103+ DC (F) and CD3+ T cells (G) detected in BP (WT) and BP-Sting−/− tumors. The tumor weight at time of analysis was 1.8 g ± 0.5 g for BP and 2.3 g ± 0.6 g for BP-Sting−/− (mean ± SD). Box plots show median with 95th percentile, maximal deviation shown by error bars; significance was assumed with p ≤ 0.05, with * ≤ 0.05, ** ≤ 0.01, **** ≤ 0.0001. See also Figure S4.
Figure 7
Figure 7. Batf3-driven dendritic cells are sufficient and required for recruitment of effector T cells into the TME
(A) CD11c-DTR/WT (grey circles) and CD11c-DTR/Batf3−/− (black circles) bone marrow chimeras were generated and 21 days following tumor induction diphtheria toxin was given to deplete DTR expression DC. Day 27 post-tumor induction, 1×10⁶ effector T cells were transferred and their accumulation in the tumor was assessed 48h later. Shown are number of 2C T cells detected in the tumor (n = 4). The tumor weight at time of analysis was 0.8 g ± 0.1 g for WT chimeras and 0.6 g ± 0.1 g for Batf3−/− chimeras (mean ± SD). (B–E) BP-SIY and BPC-SIY tumor-bearing mice were injected twice intra-tumorally with Flt3-ligand-derived DC or control injected with PBS 72 hr prior to intravenous injection of effector 2C T cells. 3 days post-T cell injection, the percent (B) and absolute number (C) of 2C T cells and overall T cells (D) in the tumor and the percentage of 2C T cell within CD8+ T cells in the TdLN (E) were assessed and are depicted as number per gram of tumor or percent in CD8+ T cells n = 4, 4, 3 or 6 mice per group (from left to right); data are pooled from two independent experiments). The tumor weight at time of analysis across all experiments was 1.3 g ± 0.1 g for BP-SIY + 2C, 1.7 g ± 0.22 g for BPC-SIY + 2C, 1.5 g ± 0.1 g for BPC-SIY + DC and 1.4 g ± 0.18 g for BPC-SIY + DC + 2C (mean ± SD). Box plots show median with 95th percentile, maximal deviation shown by error bars; significance was assumed with p ≤ 0.05, with * ≤ 0.05; ** ≤ 0.01. See also Figure S5.
Figure 8
Figure 8. Batf3-driven DC gene signature correlates with CXCL9/10/11 expression and effector T cell gene signature in human melanoma patients
(A–C) Gene expression (normalized and log2 transformed) of CXCL9 (A) CXCL10 (B) and CXCL11 (C) from 266 human metastatic melanoma samples were plotted against a Batf3-DC score. (D) Correlation between the CD8+ effector T cell score and the Batf3-DC score. Correlation is shown using R2 and significance was determined using a Spearman correlation (p< 0.0001 for all correlations).

Comment in

References

    1. Alexandre YO, Ghilas S, Sanchez C, Le Bon A, Crozat K, Dalod M. XCR1+ dendritic cells promote memory CD8+ T cell recall upon secondary infections with Listeria monocytogenes or certain viruses. The Journal of experimental medicine. 2016;213:75–92. - PMC - PubMed
    1. Bosenberg M, Muthusamy V, Curley DP, Wang Z, Hobbs C, Nelson B, Nogueira C, Horner JW, 2nd, Depinho R, Chin L. Characterization of melanocyte-specific inducible Cre recombinase transgenic mice. Genesis. 2006;44:262–267. - PubMed
    1. Bottcher JP, Beyer M, Meissner F, Abdullah Z, Sander J, Hochst B, Eickhoff S, Rieckmann JC, Russo C, Bauer T, et al. Functional classification of memory CD8(+) T cells by CX3CR1 expression. Nature communications. 2015;6:8306. - PMC - PubMed
    1. Brahmer JR, Tykodi SS, Chow LQ, Hwu WJ, Topalian SL, Hwu P, Drake CG, Camacho LH, Kauh J, Odunsi K, et al. Safety and activity of anti-PD-L1 antibody in patients with advanced cancer. The New England journal of medicine. 2012;366:2455–2465. - PMC - PubMed
    1. Broz ML, Binnewies M, Boldajipour B, Nelson AE, Pollack JL, Erle DJ, Barczak A, Rosenblum MD, Daud A, Barber DL, et al. Dissecting the tumor myeloid compartment reveals rare activating antigen-presenting cells critical for T cell immunity. Cancer cell. 2014;26:638–652. - PMC - PubMed

MeSH terms