. 2017 May 9;12(5):e0177348.
doi: 10.1371/journal.pone.0177348. eCollection 2017.

Immortalization of chicken preadipocytes by retroviral transduction of chicken TERT and TR

Affiliations

Immortalization of chicken preadipocytes by retroviral transduction of chicken TERT and TR

Wei Wang et al. PLoS One. .

Abstract

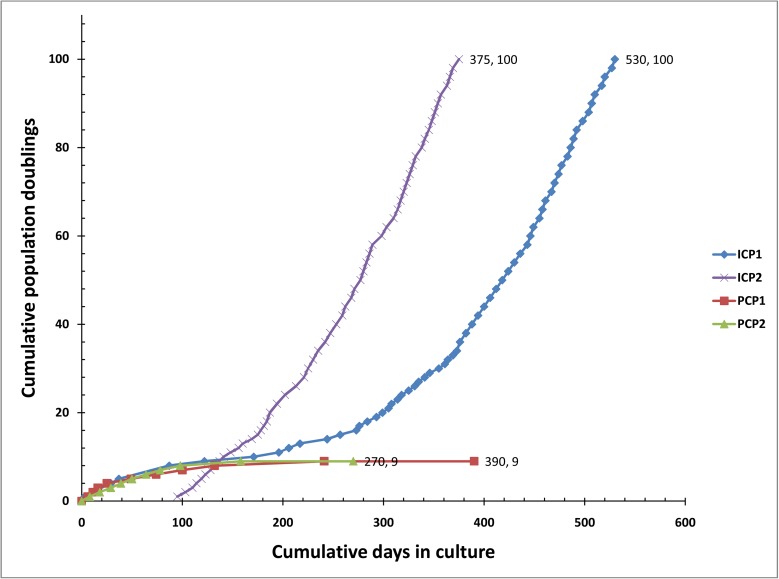
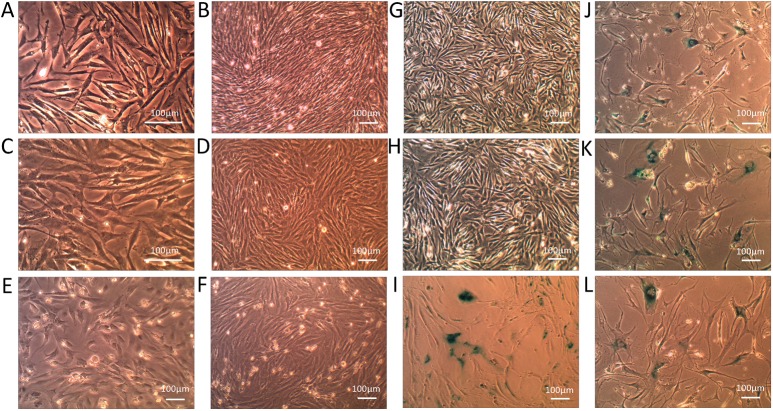
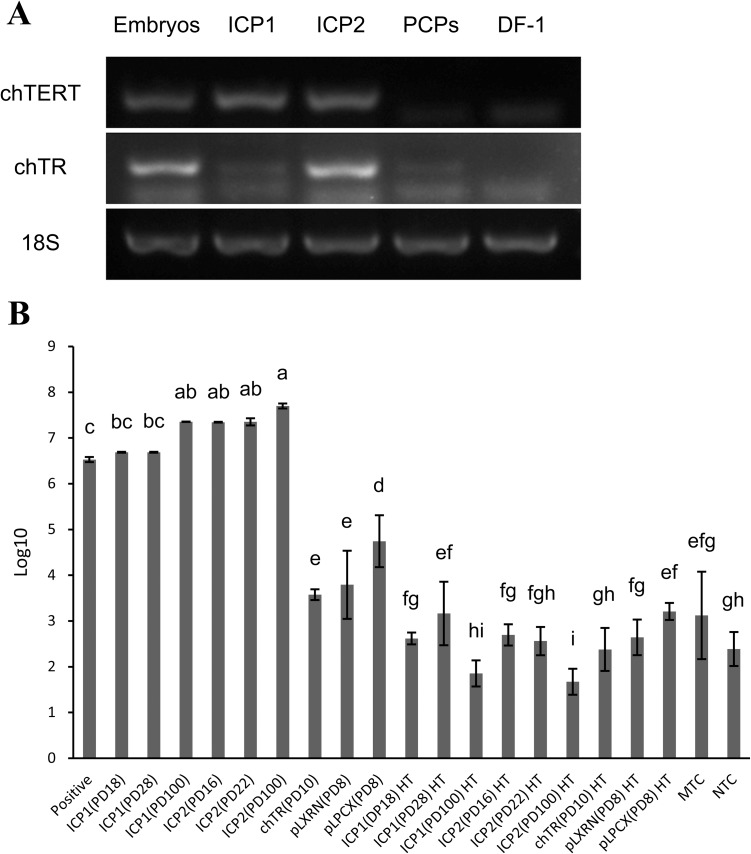
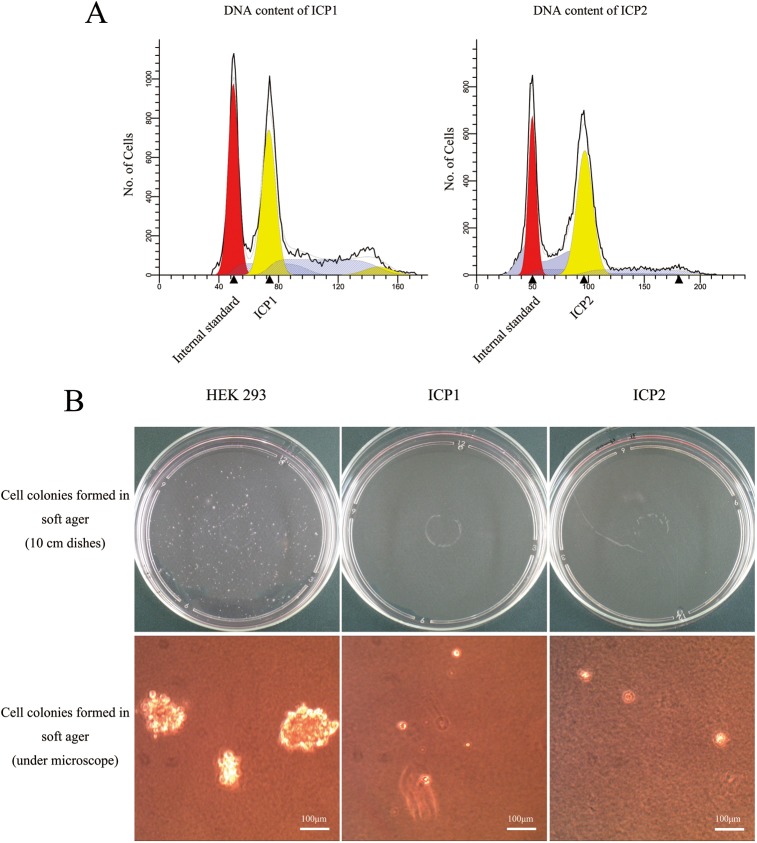
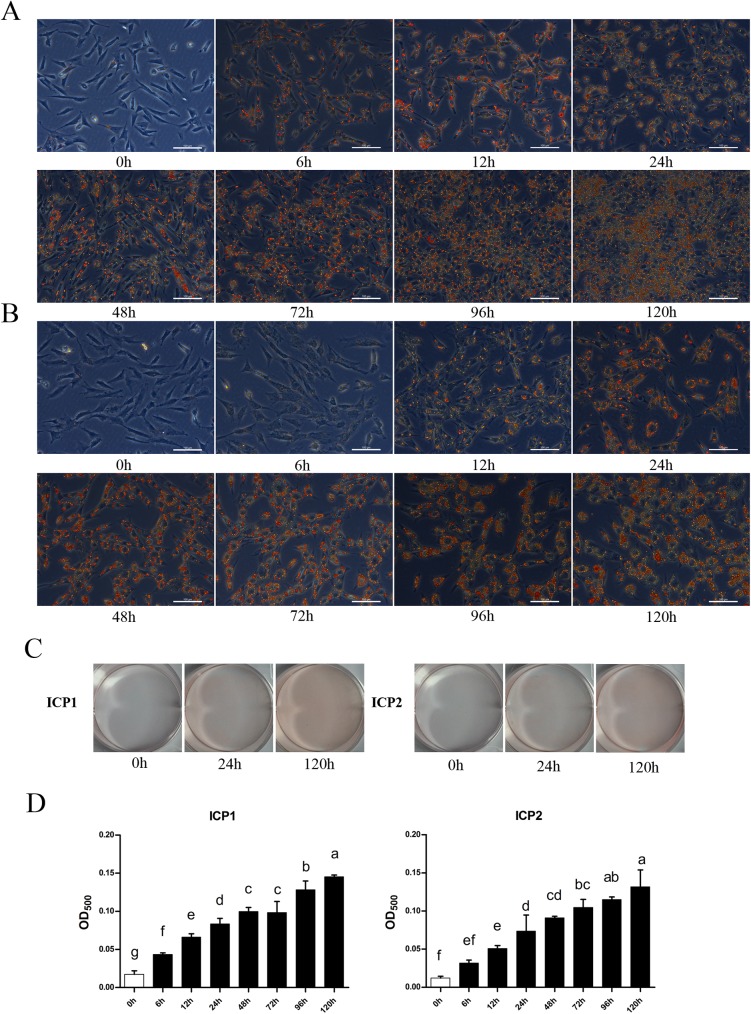
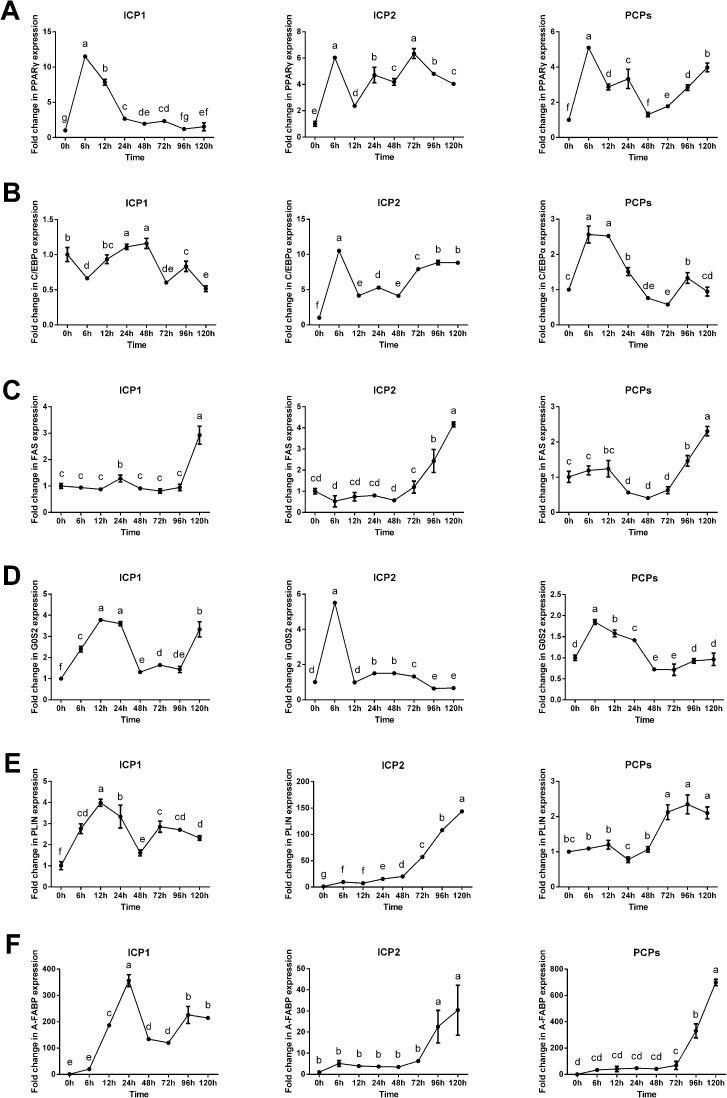
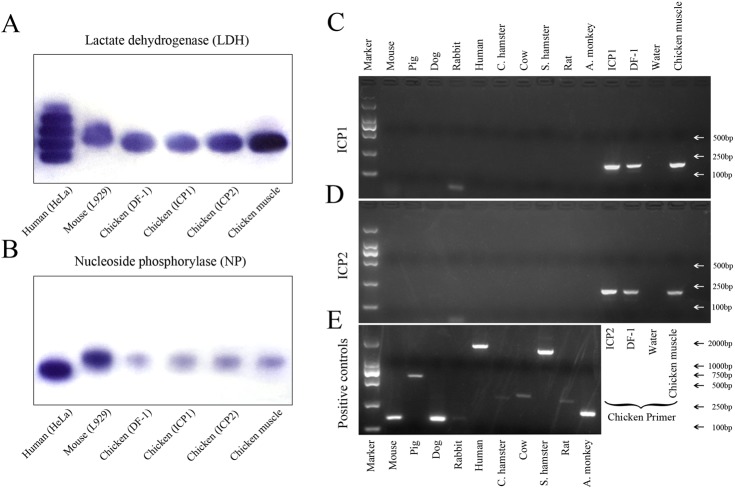
The chicken is an important agricultural animal and model for developmental biology, immunology and virology. Excess fat accumulation continues to be a serious problem for the chicken industry. However, chicken adipogenesis and obesity have not been well investigated, because no chicken preadipocyte cell lines have been generated thus far. Here, we successfully generated two immortalized chicken preadipocyte cell lines through transduction of either chicken telomerase reverse transcriptase (chTERT) alone or in combination with chicken telomerase RNA (chTR). Both of these cell lines have survived >100 population doublings in vitro, display high telomerase activity and have no sign of replicative senescence. Similar to primary chicken preadipocytes, these two cell lines display a fibroblast-like morphology, retain the capacity to differentiate into adipocytes, and do not display any signs of malignant transformation. Isoenzyme analysis and PCR-based analysis confirmed that these two cell lines are of chicken origin and are free from inter-species contamination. To our knowledge, this is the first report demonstrating the generation of immortal chicken cells by introduction of chTERT and chTR. Our established chicken preadipocyte cell lines show great promise as an in vitro model for the investigation of chicken adipogenesis, lipid metabolism, and obesity and its related diseases, and our results also provide clues for immortalizing other avian cell types.


Conflict of interest statement

Competing Interests: The authors have declared that no competing interests exist.

Figures

Fig 1
Fig 1. Cumulative population doublings of immortalized and primary chicken preadipocytes.
Immortalized chicken preadipocytes (ICP1, ICP2) and two batches of primary chicken preadipocytes (PCP1, PCP2) were serially subcultured for more than 1 year. Both ICP1 and ICP2 cell lines grew beyond PD 100. The PCP1 and PCP2 cells were no longer capable of reaching confluence by PD 9. The cumulative PDs of ICP2 were calculated from 95 days (after two rounds of retrovirus infection and drug selection).
Fig 2
Fig 2. Cell morphology comparisons and β-gal staining of immortalized and primary chicken preadipocytes.
(A) and (B) Light microscopy of ICP1 cells at partial and full confluence at PD 22; (C) and (D) Light microscopy of ICP2 cells at partial and full confluence at PD 15; (E) Light microscopy of the PCPs at partial confluence 1 day after culture; (F) Light microscopy of the PCPs at confluence at PD 2; (G) β-gal staining of ICP1 at PD 100; (H) β-gal staining of ICP2 at PD 100; (I) β-gal staining of the senescent PCPs at PD 9; (J) β-gal staining of chTR retrovirus-infected chicken preadipocytes at PD 10; (K) β-gal staining of empty vector (pLXRN) retrovirus-infected chicken preadipocytes at PD 8; (L) β-gal staining of empty vector (pLPCX) retrovirus-infected chicken preadipocytes at PD 8. Scale bar, 100 μm.
Fig 3
Fig 3. Analysis of telomerase gene expression and telomerase activity in immortalized chicken preadipocytes.
(A) RT-PCR expression analyses of chTERT and chTR genes in chicken embryos, ICP1, ICP2, PCPs and DF-1 cells. The 4-day-old AA broiler embryo sample was used as a positive control and DF-1 cells as a negative control. (B) Analysis of telomerase activity in ICP1 and ICP2 cells via TRAP assay. A total of 1 × 10³ telomerase-positive cells were used as a telomerase-positive control. Heat-inactivated samples (HT), minus telomerase control (2 μl CHAPS lysis buffer substituted for the cell extract, MTC) and no template control (2 μl of nuclease free water substituted for the cell extract, NTC) samples were used as telomerase-negative controls. Statistical significance of each test group was evaluated by the Duncan’s multiple test (P<0.05).
Fig 4
Fig 4. Flow cytometric ploidy analysis and soft agar colony formation assay of the immortalized chicken preadipocytes.
(A) DNA content analysis of ICP1 and ICP2 cells by flow cytometry. PCPs and embryo fibroblasts of AA broiler chickens served as internal standards. (B) Soft agar colony formation assay of ICP1 and ICP2 cells. Cell colonies formed on the dishes were observed by the naked eye, and examined under a microscope. Scale bar, 100 μm.
Fig 5
Fig 5. Differentiation of ICP1 and ICP2 cells induced by sodium oleate.
Oil Red O-stained images of ICP1 cells at PD 100 (A) and ICP2 cells at PD 100 (B) induced with sodium oleate at 160 μM for 120 h. (C) Whole cell culture dish views of the Oil Red O staining of ICP1 and ICP2 cells induced with 160 μM sodium oleate for 120 h. (D) Quantification analysis of Oil Red O staining of ICP1 and ICP2 cells induced with 160 μM sodium oleate over time. Statistical significance of each test group was evaluated by the Duncan’s multiple test (P<0.05). Scale bar, 100 μm.
Fig 6
Fig 6. mRNA expression levels of adipocyte differentiation marker genes during the differentiation of ICP1, ICP2 and PCP cells into adipocytes.
ICP1, ICP2 and PCP cells were induced to differentiate by sodium oleate, and gene expression levels of PPARγ (A), C/EBPα (B), FAS (C), GOS2 (D), PLIN (E) and A-FABP (F) were analyzed by quantitative real-time RT-PCR. The results were normalized to the internal control gene (GAPDH). The mean fold changes in expression of these target genes at various time points are shown. The results are given as the mean ± SD of three independent experiments. Statistical significance was determined using the Duncan’s multiple test (P<0.05).
Fig 7
Fig 7. Authentication of ICP1 And ICP2 cell origin by isoenzyme analysis and PCR-based analysis.
(A) and (B) Analysis of LDH and NP isoenzymes in samples from HeLa (human cells), L929 (mouse cells), DF-1 (chicken cells), ICP1, ICP2 cells and chicken muscle tissue. (C) and (D) Authentication of ICP1 and ICP2 cell lines by PCR based analysis. The same-sized PCR product was produced from ICP1, ICP2, DF-1 cells and chicken muscle tissue using chicken-specific primers, but no PCR product was produced from ICP1 and ICP2 cells using 10 other species-specific primers. (E) The amplified PCR products from the genomic DNA samples from the tested animal species.

Similar articles

Cited by

References

    1. Ji B, Ernest B, Gooding JR, Das S, Saxton AM, Simon J, et al. Transcriptomic and metabolomic profiling of chicken adipose tissue in response to insulin neutralization and fasting. BMC Genomics. 2012;13: 441 doi: 10.1186/1471-2164-13-441 - DOI - PMC - PubMed
    1. Simon J. Chicken as a useful species for the comprehension of insulin action. Crit Rev Poultry Biol. 1989;2: 121–148.
    1. Akiba Y, Chida Y, Takahashi T, Ohtomo Y, Sato K, Takahashi K. Persistent hypoglycemia induced by continuous insulin infusion in broiler chickens. Br Poult Sci. 1999;40: 701–705. doi: 10.1080/00071669987124 - DOI - PubMed
    1. Tokushima Y, Sulistiyanto B, Takahashi K, Akiba Y. Insulin-glucose interactions characterised in newly hatched broiler chicks. Br Poult Sci. 2003;44: 746–751. doi: 10.1080/00071660310001645758 - DOI - PubMed
    1. Dupont J, Metayer-Coustard S, Ji B, Rame C, Gespach C, Voy B, et al. Characterization of major elements of insulin signaling cascade in chicken adipose tissue: apparent insulin refractoriness. Gen Comp Endocrinol. 2012;176: 86–93. doi: 10.1016/j.ygcen.2011.12.030 - DOI - PubMed