

Stratification of clear cell renal cell carcinoma (ccRCC) genomes by gene-directed copy number alteration (CNA) analysis
- PMID: 28486536
- PMCID: PMC5423597
- DOI: 10.1371/journal.pone.0176659
Stratification of clear cell renal cell carcinoma (ccRCC) genomes by gene-directed copy number alteration (CNA) analysis
Abstract
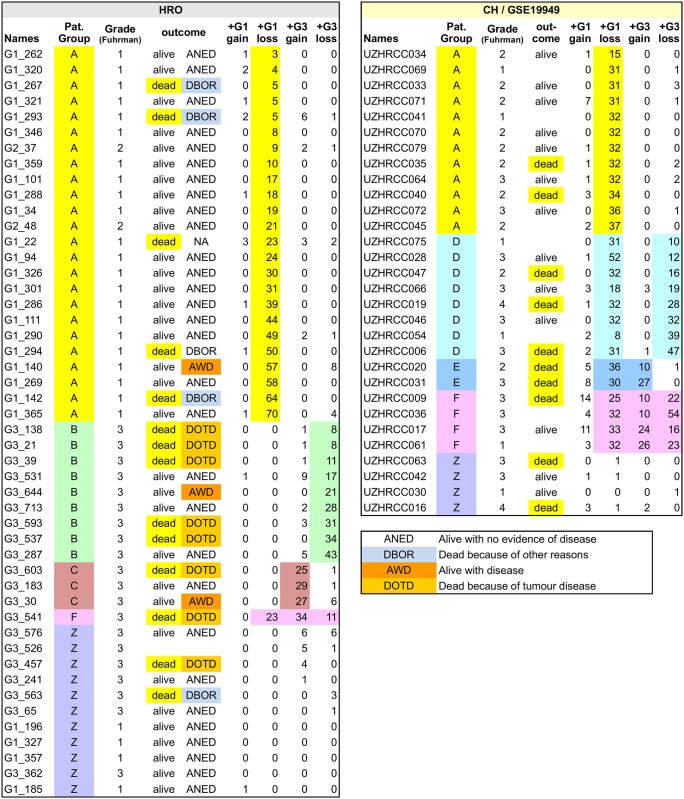
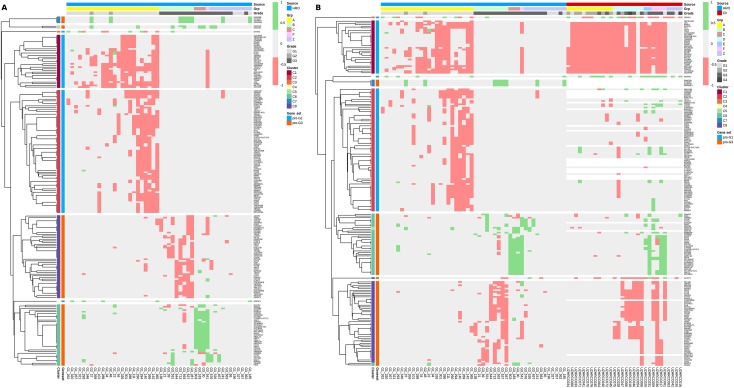
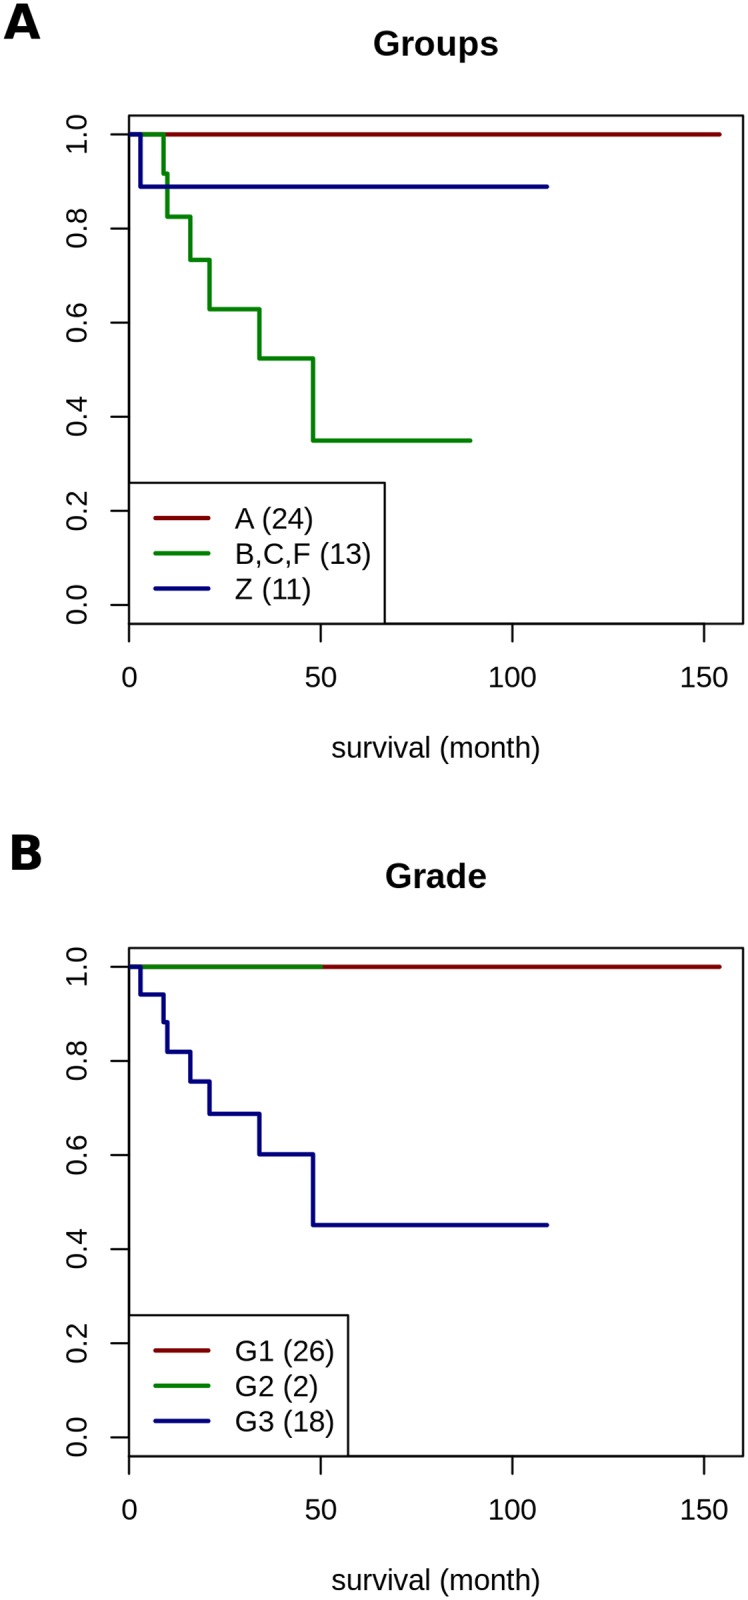
Tumorigenic processes are understood to be driven by epi-/genetic and genomic alterations from single point mutations to chromosomal alterations such as insertions and deletions of nucleotides up to gains and losses of large chromosomal fragments including products of chromosomal rearrangements e.g. fusion genes and proteins. Overall comparisons of copy number alterations (CNAs) presented in 48 clear cell renal cell carcinoma (ccRCC) genomes resulted in ratios of gene losses versus gene gains between 26 ccRCC Fuhrman malignancy grades G1 (ratio 1.25) and 20 G3 (ratio 0.58). Gene losses and gains of 15762 CNA genes were mapped to 795 chromosomal cytoband loci including 280 KEGG pathways. CNAs were classified according to their contribution to Fuhrman tumour gradings G1 and G3. Gene gains and losses turned out to be highly structured processes in ccRCC genomes enabling the subclassification and stratification of ccRCC tumours in a genome-wide manner. CNAs of ccRCC seem to start with common tumour related gene losses flanked by CNAs specifying Fuhrman grade G1 losses and CNA gains favouring grade G3 tumours. The appearance of recurrent CNA signatures implies the presence of causal mechanisms most likely implicated in the pathogenesis and disease-outcome of ccRCC tumours distinguishing lower from higher malignant tumours. The diagnostic quality of initial 201 genes (108 genes supporting G1 and 93 genes G3 phenotypes) has been successfully validated on published Swiss data (GSE19949) leading to a restricted CNA gene set of 171 CNA genes of which 85 genes favour Fuhrman grade G1 and 86 genes Fuhrman grade G3. Regarding these gene sets overall survival decreased with the number of G3 related gene losses plus G3 related gene gains. CNA gene sets presented define an entry to a gene-directed and pathway-related functional understanding of ongoing copy number alterations within and between individual ccRCC tumours leading to CNA genes of prognostic and predictive value.
Conflict of interest statement
Figures
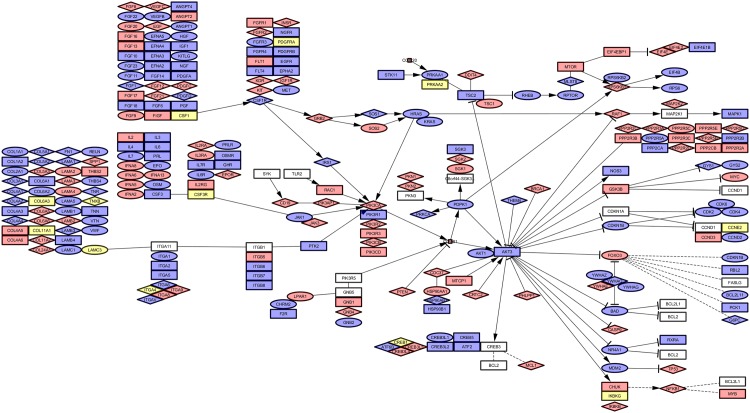
Red = Loss
Blue = Gain
Yellow = Both states (Gain/Loss)
Rectangle = Uncoloured, Gene is not affected
Rectangle = Grade (1/3) equally affected, colour shows aberration
Circle = Grade 3, colour shows aberration
Diamond = Grade 1, colour shows aberration
Similar articles
-
Gene expression analysis in clear cell renal cell carcinoma using gene set enrichment analysis for biostatistical management.BJU Int. 2011 Jul;108(2 Pt 2):E29-35. doi: 10.1111/j.1464-410X.2010.09794.x. Epub 2011 Mar 16. BJU Int. 2011. PMID: 21435154
-
Somatic Copy Number Alterations and Associated Genes in Clear-Cell Renal-Cell Carcinoma in Brazilian Patients.Int J Mol Sci. 2021 Feb 25;22(5):2265. doi: 10.3390/ijms22052265. Int J Mol Sci. 2021. PMID: 33668731 Free PMC article.
-
Identification and validation of an eight-gene expression signature for predicting high Fuhrman grade renal cell carcinoma.Int J Cancer. 2017 Mar 1;140(5):1199-1208. doi: 10.1002/ijc.30535. Int J Cancer. 2017. PMID: 27874173
-
Assessing Genomic Copy Number Alterations as Best Practice for Renal Cell Neoplasia: An Evidence-Based Review from the Cancer Genomics Consortium Workgroup.Cancer Genet. 2020 Jun;244:40-54. doi: 10.1016/j.cancergen.2020.04.004. Epub 2020 May 1. Cancer Genet. 2020. PMID: 32434132 Review.
-
Epigenome Aberrations: Emerging Driving Factors of the Clear Cell Renal Cell Carcinoma.Int J Mol Sci. 2017 Aug 16;18(8):1774. doi: 10.3390/ijms18081774. Int J Mol Sci. 2017. PMID: 28812986 Free PMC article. Review.
Cited by
-
Comprehensive analysis of somatic copy number alterations in clear cell renal cell carcinoma.Mol Carcinog. 2020 Apr;59(4):412-424. doi: 10.1002/mc.23164. Epub 2020 Feb 10. Mol Carcinog. 2020. PMID: 32039517 Free PMC article.
-
A New Survival Model Based on Cholesterol Biosynthesis-Related Genes for Prognostic Prediction in Clear Cell Renal Cell Carcinoma.Biomed Res Int. 2021 Sep 2;2021:9972968. doi: 10.1155/2021/9972968. eCollection 2021. Biomed Res Int. 2021. Retraction in: Biomed Res Int. 2024 Mar 20;2024:9838460. doi: 10.1155/2024/9838460. PMID: 34513998 Free PMC article. Retracted.
-
Comprehensive analysis of copy number variance and sensitivity to common targeted therapy in clear cell renal cell carcinoma: In silico analysis with in vitro validation.Cancer Med. 2020 Aug;9(16):6020-6029. doi: 10.1002/cam4.3281. Epub 2020 Jul 6. Cancer Med. 2020. PMID: 32628820 Free PMC article.
-
Integrative analysis of dysregulated microRNAs and mRNAs in multiple recurrent synchronized renal tumors from patients with von Hippel-Lindau disease.Int J Oncol. 2018 Oct;53(4):1455-1468. doi: 10.3892/ijo.2018.4490. Epub 2018 Jul 19. Int J Oncol. 2018. PMID: 30066860 Free PMC article.
-
Expression of AOX1 Predicts Prognosis of Clear Cell Renal Cell Carcinoma.Front Genet. 2021 Jul 5;12:683173. doi: 10.3389/fgene.2021.683173. eCollection 2021. Front Genet. 2021. PMID: 34290740 Free PMC article.
References
MeSH terms
LinkOut - more resources
Full Text Sources
Other Literature Sources
Medical
Molecular Biology Databases
